Analysis Summary
Notes:
- 1) No attempt has been made to eliminate the non-significant decimal places.
- 2) This batgrbproduct analysis is done using the HEASARC data.
- 3) This batgrbproduct analysis is using the flight position for the mask-weighting calculation.
======================================================================
BAT GRB EVENT DATA PROCESSING REPORT
Process Script Ver: batgrbproduct v2.46
Process Start Time: Wed Jan 22 13:48:32 EST 2014
Host Name: batevent1
Current Working Dir: /local/data/batevent/batevent_reproc/trigger228316
======================================================================
Trigger: 00228316 Segment: 000
BAT Trigger Time: 179224368 [s; MET]
Trigger Stop: 179224432 [s; MET]
UTC: 2006-09-06T08:32:46.573080 [includes UTCF correction]
Where From?: TDRSS position message
BAT
RA: 40.7485000090217 Dec: 30.3494020585399 [deg; J2000]
Catalogged Source?: NO
Point Source?: YES
GRB Indicated?: YES [ by BAT flight software ]
Image S/N Ratio: 7.96
Image Trigger?: YES
Rate S/N Ratio: 0 [ if not an image trigger ]
Image S/N Ratio: 7.96
Analysis Position: [ source = BAT ]
RA: 40.7485000090217 Dec: 30.3494020585399 [deg; J2000]
Refined Position: [ source = BAT pre-slew burst ]
RA: 40.7119716223741 Dec: 30.3561616373423 [deg; J2000]
{ 02h 42m 50.9s , +30d 21' 22.2" }
+/- 2.30678805573973 [arcmin] (estimated 90% radius based on SNR)
+/- 1.00649717813953 [arcmin] (formal 1-sigma fit error)
SNR: 9.2158619370197
Angular difference between the analysis and refined position is 1.934285 arcmin
Partial Coding Fraction: 0.453125 [ including projection effects ]
Duration
T90: 44.5879999995232 +/- 2.59449571961208
Measured from: -39.9280000030994
to: 4.65999999642372 [s; relative to TRIGTIME]
T50: 17.0960000157356 +/- 2.35680543187746
Measured from: -32.3000000119209
to: -15.2039999961853 [s; relative to TRIGTIME]
Fluence
Peak Flux (peak 1 second)
Measured from: -24.8120000064373
to: -23.8120000064373 [s; relative to TRIGTIME]
Total Fluence
Measured from: -41.7960000038147
to: 8.30000001192093 [s; relative to TRIGTIME]
Band 1 Band 2 Band 3 Band 4
15-25 25-50 50-100 100-350 keV
Total 1.317647 1.496176 0.845607 0.203501
0.066231 0.069054 0.059785 0.050217 [error]
Peak 0.073020 0.083412 0.053519 0.001752
0.009681 0.010371 0.008645 0.006966 [error]
[ fluence units of on-axis counts / fully illuminated detector ]
======================================================================
====== Table of the duration information =============================
Value tstart tstop
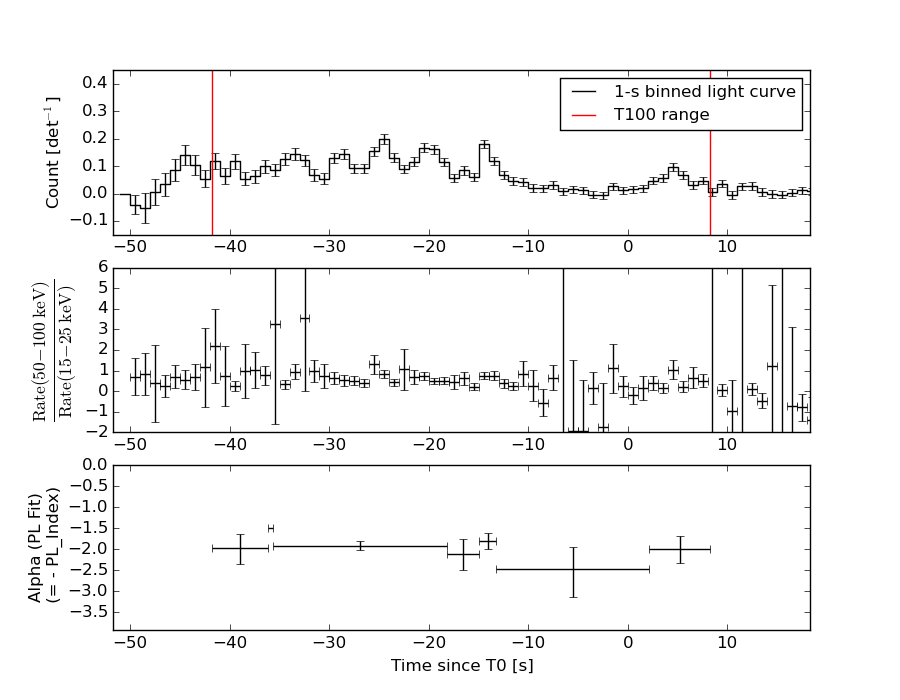
T100 50.096 -41.796 8.300
T90 44.588 -39.928 4.660
T50 17.096 -32.300 -15.204
Peak 1.000 -24.812 -23.812
====== Spectral Analysis Summary =====================================
Model : spectral model: simple power-law (PL) and cutoff power-law (CPL)
Ph_index : photon index: E^{Ph_index}
Ph_90err : 90% error of the photon index
Epeak : Epeak in keV
Epeak_90err: 90% error of Epeak
Norm : normalization at 50 keV in both the PL model and CPL model
Nomr_90err : 90% error of the normalization
chi2 : Chi-Squared
dof : degree of freedo
=== Time-averaged spectral analysis ===
(Best model with acceptable fit: PL)
Model Ph_index Ph_90err_low Ph_90err_hi Epeak Epeak_90err_low Epeak_90err_hi Norm Nomr_90err_low Norm_90err_hi chi2 dof
PL -1.979 -0.105 0.102 - - - 4.95e-03 -3.13e-04 3.10e-04 56.530 57
CPL -1.550 -0.405 0.450 47.803 -18.967 42.777 8.44e-03 -3.28e-03 6.23e-03 53.230 56
=== 1-s peak spectral analysis ===
(Best model with acceptable fit: PL)
Model Ph_index Ph_90err_low Ph_90err_hi Epeak Epeak_90err_low Epeak_90err_hi Norm Nomr_90err_low Norm_90err_hi chi2 dof
PL -1.997 -0.259 0.239 - - - 1.32e-02 -2.24e-03 2.17e-03 66.830 57
CPL -1.533 -0.611 1.163 44.608 N/A N/A 2.40e-02 N/A N/A 66.170 56
=== Fluence/Peak Flux Summary ===
Model Band1 Band2 Band3 Band4 Band5 Total
15-25 25-50 50-100 100-350 15-150 15-350 keV
Fluence PL 4.98e-07 6.84e-07 6.94e-07 1.28e-06 2.29e-06 3.16e-06 erg/cm2
90%_error_low -4.25e-08 -3.75e-08 -5.98e-08 -2.13e-07 -1.39e-07 -2.75e-07 erg/cm2
90%_error_hi 4.35e-08 3.75e-08 6.01e-08 2.40e-07 1.39e-07 2.93e-07 erg/cm2
Peak flux PL 8.78e-01 6.59e-01 3.30e-01 2.37e-01 1.98e+00 2.10e+00 ph/cm2/s
90%_error_low -1.69e-01 -8.96e-02 -7.21e-02 -8.62e-02 -2.71e-01 -2.87e-01 ph/cm2/s
90%_error_hi 1.76e-01 8.96e-02 7.22e-02 1.10e-01 2.71e-01 2.87e-01 ph/cm2/s
Fluence CPL 4.70e-07 7.15e-07 6.96e-07 6.59e-07 2.20e-06 2.54e-06 erg/cm2
90%_error_low -4.96e-08 -4.75e-08 -6.44e-08 -2.93e-07 -1.58e-07 -3.39e-07 erg/cm2
90%_error_hi 5.03e-08 4.85e-08 6.41e-08 5.70e-07 1.59e-07 5.83e-07 erg/cm2
Peak flux CPL 8.34e-01 6.98e-01 3.36e-01 1.34e-01 1.95e+00 2.00e+00 ph/cm2/s
90%_error_low -1.96e-01 -1.50e-01 -7.83e-02 -1.34e-01 -2.77e-01 -3.03e-01 ph/cm2/s
90%_error_hi 9.74e-02 1.24e-01 7.90e-02 1.78e-01 2.76e-01 3.62e-01 ph/cm2/s
======================================================================
Image
Pre-slew 15.0-350.0 keV image (Event data)
#   RAcent    DECcent   POSerr    Theta     Phi              Peak Cts       SNR   Name
   40.7120    30.3562   0.0208    35.2814   152.1794         0.4788870      9.216 TRIG_00228316

Foreground time interval of the image:
 -6.499   8.300 (delta_t =  14.799 [sec])
Background time interval of the image:
Light Curves
Note: The mask-weighted lightcurves have units of either count/det or counts/sec/det, where a det is 0.4 x 0.4 = 0.16 sq cm.
Full-time range; 1 s binning
Other quick-look light curves:
- 64 ms binning (zoomed)
- 16 ms binning (zoomed)
- 8 ms binning (zoomed)
- 2 ms binning (zoomed)
- SN=5 or 10 s binning (full-time range)
- Raw light curve
Spectra
- 64 ms binning (zoomed)
- 16 ms binning (zoomed)
- 8 ms binning (zoomed)
- 2 ms binning (zoomed)
- SN=5 or 10 s binning (full-time range)
- Raw light curve
Spectra
Notes:
- 1) The fitting includes the systematic errors.
- 2) When the burst includes telescope slew time periods, the fitting uses an average response file made from multiple 5-s response files through out the slew time plus single time preiod for the non-slew times, and weighted by the total counts in the corresponding time period using addrmf. An average response file is needed becuase a spectral fit using the pre-slew DRM will introduce some errors in both a spectral shape and a normalization if the PHA file contains a lot of the slew/post-slew time interval.
- 3) For fits to more complicated models (e.g. a power-law over a cutoff power-law), the BAT team has decided to require a chi-square improvement of more than 6 for each extra dof.
Time averaged spectrum fit using the average DRM
Power-law model
Time interval is from  -41.796 sec. to    8.300 sec.

Spectral model in power-law:
------------------------------------------------------------
Parameters  : value       lower 90%   higher 90%
Photon index: -1.97866     ( -0.104827   0.102378 )
Norm@50keV  : 4.95226E-03    ( -0.000313358   0.000310094 )
------------------------------------------------------------
#Fit statistic : Chi-Squared =          56.53 using 59 PHA bins.
# Reduced chi-squared =         0.9917 for     57 degrees of freedom
# Null hypothesis probability =   4.927135e-01

Photon flux (15-150 keV)    in 50.1 sec: 0.735696 ( -0.041815  0.041895 ) ph/cm2/s
Energy fluence (15-150 keV)             : 2.28606e-06 ( -1.38541e-07  1.39473e-07 ) ergs/cm2
Cutoff power-law model
Time interval is from  -41.796 sec. to    8.300 sec.
Spectral model in the cutoff power-law:
------------------------------------------------------------
Parameters  : value       lower 90%   higher 90%
Photon index: -1.54954     ( -0.4051   0.449706 )
Epeak [keV] : 47.8026      ( -18.9669 42.7773 )
Norm@50keV  : 8.44215E-03    ( -0.0032753   0.006227 )
------------------------------------------------------------
#Fit statistic : Chi-Squared =          53.23 using 59 PHA bins.
# Reduced chi-squared =         0.9506 for     56 degrees of freedom
# Null hypothesis probability =   5.802361e-01

Photon flux (15-150 keV)    in 50.1 sec: 0.719271 ( -0.044449  0.0445 ) ph/cm2/s
Energy fluence (15-150 keV)             : 2.20413e-06 ( -1.58078e-07  1.5867e-07 ) ergs/cm2
1-s peak spectrum fit
Power-law model
Time interval is from  -24.812 sec. to  -23.812 sec.

Spectral model in power-law:
------------------------------------------------------------
Parameters  : value       lower 90%   higher 90%
Photon index: -1.99727     ( -0.258626   0.238758 )
Norm@50keV  : 1.32002E-02    ( -0.00223911   0.00216705 )
------------------------------------------------------------
#Fit statistic : Chi-Squared =          66.83 using 59 PHA bins.
# Reduced chi-squared =          1.172 for     57 degrees of freedom
# Null hypothesis probability =   1.752132e-01

Photon flux (15-150 keV)    in 1 sec: 1.97769 ( -0.27082  0.27095 ) ph/cm2/s
Energy fluence (15-150 keV)             : 1.21733e-07 ( -1.92552e-08  1.95533e-08 ) ergs/cm2
Cutoff power-law model
Time interval is from  -24.812 sec. to  -23.812 sec.
Spectral model in the cutoff power-law:
------------------------------------------------------------
Parameters  : value       lower 90%   higher 90%
Photon index: -1.53341     ( -0.611263   1.1633 )
Epeak [keV] : 44.6084      (   )
Norm@50keV  : 2.40109E-02    (     )
------------------------------------------------------------
#Fit statistic : Chi-Squared =          66.17 using 59 PHA bins.
# Reduced chi-squared =          1.182 for     56 degrees of freedom
# Null hypothesis probability =   1.659052e-01

Photon flux (15-150 keV)    in 1 sec: 1.95248 ( -0.27654  0.27593 ) ph/cm2/s
Energy fluence (15-150 keV)             : 0 ( 0  0 ) ergs/cm2
Time-resolved spectra
Distribution
T90 vs. Hardness ratio plot
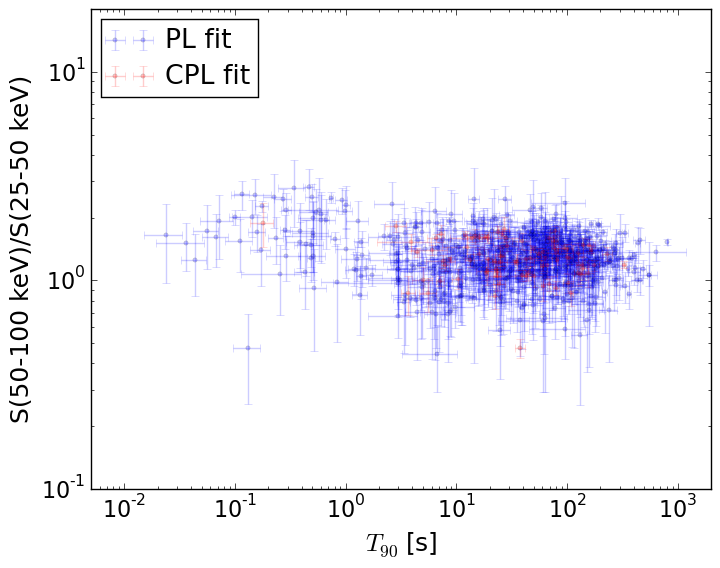
T90                                   = N/A sec.
Hardness ratio (energy fluence ratio) = N/A
S(15-50 keV) vs. S(50-150 keV) plot
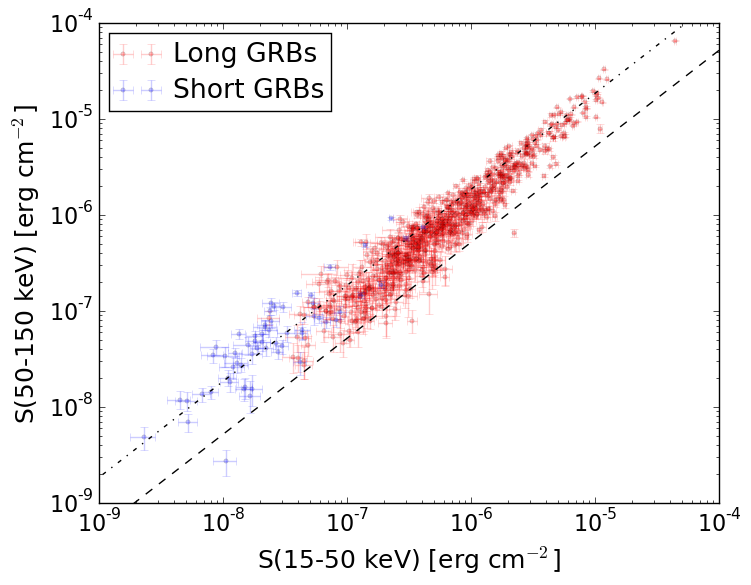
S(15-50 keV)  = N/A
S(50-150 keV) = N/A
The dash-dotted line and the dashed line traces the fluences calculated from the Band function with Epeak = 15 and 150 keV, respectively. Both lines assume a canonical values of alpha = -1 and beta = -2.5.
Mask shadow pattern
IMX = -6.257692935479964E-01, IMY = -3.302189153698654E-01
Spacecraft aspect plot
Bright source in the pre-burst/pre-slew/post-slew images
Pre-burst image of 15-350 keV band
Time interval of the image:
Pre-slew background subtracted image of 15-350 keV band
Time interval of the image:
-6.499390 8.300000

# RAcent  DECcent POSerr Theta    Phi  PeakCts   SNR AngSep     Name
#  [deg]    [deg]    ['] [deg]  [deg]                   [']
 83.6023  22.0158    1.0  33.6 -135.2   0.5580  11.8    1.7	Crab
 24.9675 -22.7287    2.2  39.1   52.3   0.4801   5.4 ------	UNKNOWN
 40.7120  30.3562    1.2  35.3  152.2   0.4788   9.2 ------	UNKNOWN
 65.6703 -45.3591    2.0  45.1   -8.4   0.3549   5.8 ------	UNKNOWN
 99.0355   1.6719    3.0  40.9  -94.5   0.5356   3.9 ------	UNKNOWN
Post-slew image of 15-350 keV band
Time interval of the image:
132.500590 263.982600
265.000000 963.063900

# RAcent  DECcent POSerr Theta    Phi  PeakCts   SNR AngSep     Name
#  [deg]    [deg]    ['] [deg]  [deg]                   [']
 83.6376  22.0286    0.4  39.1  -63.4  33.8794  28.4    0.9	Crab
351.2122  47.7272    2.8  41.4  154.0   3.6969   4.2 ------	UNKNOWN
 48.2942  23.7899    3.2   9.4  -22.6   1.3391   3.6 ------	UNKNOWN
 67.4112 -12.0716    2.7  49.6  -10.4   3.6140   4.2 ------	UNKNOWN
 76.0150   6.2449    2.7  40.9  -36.3   2.9755   4.3 ------	UNKNOWN
 84.4126  -4.5530    4.2  54.4  -33.0   6.2117   2.7 ------	UNKNOWN