Analysis Summary
Notes:
- 1) No attempt has been made to eliminate the non-significant decimal places.
- 2) This batgrbproduct analysis is done using the HEASARC data.
- 3) This batgrbproduct analysis is using the flight position for the mask-weighting calculation.
======================================================================
                  BAT GRB EVENT DATA PROCESSING REPORT
    Process Script Ver: batgrbproduct v2.46
    Process Start Time: Wed Jan 22 13:41:03 EST 2014
             Host Name: batevent1
   Current Working Dir: /local/data/batevent/batevent_reproc/trigger229185
======================================================================

  Trigger: 00229185      Segment: 000

  BAT Trigger Time: 179762155.584   [s; MET]
      Trigger Stop: 179762156.608   [s; MET]
               UTC: 2006-09-12T13:55:54.144260    [includes UTCF correction]
       Where From?: TDRSS position message

  BAT
    RA: 5.28584793860298   Dec: 20.9715924063833  [deg; J2000]

     Catalogged Source?: NO
     Point Source?:      YES
     GRB Indicated?:     YES    [ by BAT flight software ]
     Image S/N Ratio:    19.85
     Image Trigger?:     NO
     Rate S/N Ratio:     81.3879597975032  [ if not an image trigger ]
     Image S/N Ratio:    19.85

  Analysis Position:   [ source = BAT ]
    RA: 5.28584793860298   Dec: 20.9715924063833  [deg; J2000]

  Refined Position:   [ source = BAT pre-slew burst ]
    RA: 5.28077824897349   Dec: 20.9683564981093  [deg; J2000]
        { 00h 21m 07.4s , +20d 58' 06.1" }
         +/- 0.898579971245838 [arcmin] (estimated 90% radius based on SNR)
         +/- 0.253592557013744 [arcmin] (formal 1-sigma fit error)
    SNR: 35.4377306192753

  Angular difference between the analysis and refined position is 0.344052 arcmin

  Partial Coding Fraction: 0.3359375    [ including projection effects ]

  Duration
     T90: 5.0280000269413 +/- 0.580675464663478
        Measured from: -0.11599999666214
                   to: 4.91200003027916     [s; relative to TRIGTIME]
     T50: 1.74800002574921 +/- 0.186290076497368
        Measured from: 0.38400000333786
                   to: 2.13200002908707     [s; relative to TRIGTIME]


  Fluence
     Peak Flux  (peak 1 second)
        Measured from: 0
                   to: 1     [s; relative to TRIGTIME]
     Total Fluence
        Measured from: -0.560000002384186
                   to: 6.11599999666214     [s; relative to TRIGTIME]

             Band 1     Band 2     Band 3     Band 4
              15-25      25-50     50-100    100-350     keV
 Total     0.700217   0.843018   0.572947   0.137242
           0.027030   0.029304   0.025491   0.020757 [error]
 Peak      0.268770   0.390847   0.253709   0.051900
           0.013644   0.015326   0.013477   0.009616 [error]

     [ fluence units of on-axis counts / fully illuminated detector ]

======================================================================


====== Table of the duration information =============================

        Value   tstart    tstop
T100    6.676   -0.560    6.116
T90     5.028   -0.116    4.912
T50     1.748    0.384    2.132
Peak    1.000    0.000    1.000


====== Spectral Analysis Summary =====================================

Model      : spectral model: simple power-law (PL) and cutoff power-law (CPL)
Ph_index   : photon index: E^{Ph_index}
Ph_90err   : 90% error of the photon index
Epeak      : Epeak in keV
Epeak_90err: 90% error of Epeak
Norm       : normalization at 50 keV in both the PL model and CPL model
Nomr_90err : 90% error of the normalization
chi2       : Chi-Squared
dof        : degree of freedo

=== Time-averaged spectral analysis ===
(Best model with acceptable fit: PL)

Model Ph_index Ph_90err_low Ph_90err_hi  Epeak  Epeak_90err_low  Epeak_90err_hi  Norm       Nomr_90err_low    Norm_90err_hi    chi2    dof
PL      -1.729    -0.080      0.080       -           -               -         2.21e-02     -9.61e-04          9.57e-04      67.600   57
CPL     -1.730    -0.078      0.083     9999.290    -9999.280      -9999.290      2.21e-02     -7.02e-03          5.62e-03      67.620   56


=== 1-s peak spectral analysis ===
(Best model with acceptable fit: PL)

Model Ph_index Ph_90err_low Ph_90err_hi  Epeak  Epeak_90err_low  Epeak_90err_hi  Norm       Nomr_90err_low    Norm_90err_hi    chi2    dof
PL      -1.654     -0.083     0.082       -           -               -         6.53e-02     -3.23e-03          3.22e-03      54.500   57
CPL     -1.196     -0.322     0.349       86.386     -18.834        82.700      1.12e-01     -3.47e-02          5.57e-02      48.400   56


=== Fluence/Peak Flux Summary ===

              Model    Band1     Band2     Band3     Band4     Band5     Total
                       15-25     25-50    50-100    100-350    15-150    15-350    keV
Fluence         PL   2.34e-07  3.74e-07  4.51e-07  1.06e-06  1.36e-06  2.12e-06   erg/cm2
      90%_error_low -1.72e-08 -1.62e-08 -2.65e-08 -1.31e-07 -6.16e-08 -1.51e-07   erg/cm2
      90%_error_hi   1.76e-08  1.62e-08  2.65e-08  1.43e-07  6.18e-08  1.61e-07   erg/cm2
Peak flux       PL   3.12e+00  2.86e+00  1.82e+00  1.77e+00  8.54e+00  9.58e+00   ph/cm2/s
      90%_error_low -2.48e-01 -1.44e-01 -1.14e-01 -2.14e-01 -4.19e-01 -4.54e-01   ph/cm2/s
      90%_error_hi   2.54e-01  1.43e-01  1.13e-01  2.31e-01  4.19e-01  4.54e-01   ph/cm2/s

Fluence        CPL   2.34e-07  3.74e-07  4.49e-07  1.06e-06  1.36e-06  2.13e-06   erg/cm2
      90%_error_low -1.72e-08    N/A    -2.47e-08    N/A    -5.62e-08 -3.23e-07   erg/cm2
      90%_error_hi   1.76e-08    N/A     2.84e-08    N/A     6.19e-08  6.57e-08   erg/cm2
Peak flux      CPL   3.03e+00  2.25e+00  1.15e+00  1.00e+00  6.85e+00  7.42e+00   ph/cm2/s
      90%_error_low -3.08e-01 -2.23e-01 -4.73e-02 -9.84e-02 -7.61e-01 -6.72e-01   ph/cm2/s
      90%_error_hi   1.36e-01  1.97e-01  9.51e-02  1.10e-01  6.56e-01  5.61e-01   ph/cm2/s

======================================================================
Image
Pre-slew 15.0-350.0 keV image (Event data)
#   RAcent    DECcent   POSerr    Theta     Phi              Peak Cts       SNR   Name
    5.2808    20.9684   0.0054    33.1688   125.7329         2.2791541     35.438 TRIG_00229185

Foreground time interval of the image:
 -0.560   6.116 (delta_t =   6.676 [sec])
Background time interval of the image:
-239.584  -0.560 (delta_t = 239.024 [sec])
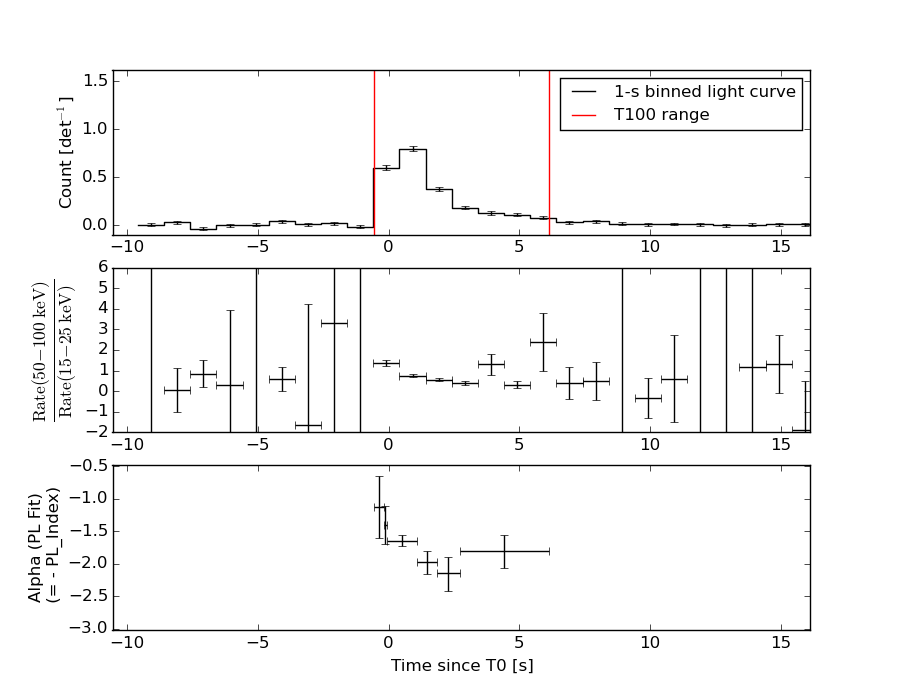
Light Curves
Note: The mask-weighted lightcurves have units of either count/det or counts/sec/det, where a det is 0.4 x 0.4 = 0.16 sq cm.
Full-time range; 1 s binning
Other quick-look light curves:
- 64 ms binning (zoomed)
- 16 ms binning (zoomed)
- 8 ms binning (zoomed)
- 2 ms binning (zoomed)
- SN=5 or 10 s binning (full-time range)
- Raw light curve
Spectra
- 64 ms binning (zoomed)
- 16 ms binning (zoomed)
- 8 ms binning (zoomed)
- 2 ms binning (zoomed)
- SN=5 or 10 s binning (full-time range)
- Raw light curve
Spectra
Notes:
- 1) The fitting includes the systematic errors.
- 2) When the burst includes telescope slew time periods, the fitting uses an average response file made from multiple 5-s response files through out the slew time plus single time preiod for the non-slew times, and weighted by the total counts in the corresponding time period using addrmf. An average response file is needed becuase a spectral fit using the pre-slew DRM will introduce some errors in both a spectral shape and a normalization if the PHA file contains a lot of the slew/post-slew time interval.
- 3) For fits to more complicated models (e.g. a power-law over a cutoff power-law), the BAT team has decided to require a chi-square improvement of more than 6 for each extra dof.
Time averaged spectrum fit using the average DRM
Power-law model

Time interval is from   -0.560 sec. to    6.116 sec.

Spectral model in power-law:
------------------------------------------------------------
Parameters  : value       lower 90%   higher 90%
Photon index: -1.72868     ( -0.0803243   0.0796071 )
Norm@50keV  : 2.21167E-02    ( -0.000960723   0.000956696 )
------------------------------------------------------------
#Fit statistic : Chi-Squared =          67.60 using 59 PHA bins.
# Reduced chi-squared =          1.186 for     57 degrees of freedom
# Null hypothesis probability =   1.589957e-01

Photon flux (15-150 keV)    in 6.676 sec: 2.96753 ( -0.13042  0.1309 ) ph/cm2/s
Energy fluence (15-150 keV)             : 1.36445e-06 ( -6.16218e-08  6.18375e-08 ) ergs/cm2
Cutoff power-law model
Time interval is from   -0.560 sec. to    6.116 sec.
Spectral model in the cutoff power-law:
------------------------------------------------------------
Parameters  : value       lower 90%   higher 90%
Photon index: -1.73009     ( -0.0790603   0.0822274 )
Epeak [keV] : 9999.29      ( -9999.35 -9999.36 )
Norm@50keV  : 2.20796E-02    ( -0.00708595   0.00555418 )
------------------------------------------------------------
#Fit statistic : Chi-Squared =          67.62 using 59 PHA bins.
# Reduced chi-squared =          1.208 for     56 degrees of freedom
# Null hypothesis probability =   1.373128e-01

Photon flux (15-150 keV)    in 6.676 sec: 2.98675 ( -0.15026  0.1119 ) ph/cm2/s
Energy fluence (15-150 keV)             : 1.36423e-06 ( -5.62014e-08  6.18608e-08 ) ergs/cm2
1-s peak spectrum fit
Power-law model
Time interval is from    0.000 sec. to    1.000 sec.

Spectral model in power-law:
------------------------------------------------------------
Parameters  : value       lower 90%   higher 90%
Photon index: -1.65449     ( -0.0828892   0.0821027 )
Norm@50keV  : 6.53178E-02    ( -0.00323374   0.00322237 )
------------------------------------------------------------
#Fit statistic : Chi-Squared =          54.50 using 59 PHA bins.
# Reduced chi-squared =         0.9562 for     57 degrees of freedom
# Null hypothesis probability =   5.692894e-01

Photon flux (15-150 keV)    in 1 sec: 8.54188 ( -0.41887  0.4194 ) ph/cm2/s
Energy fluence (15-150 keV)             : 6.07295e-07 ( -3.1696e-08  3.18362e-08 ) ergs/cm2
Cutoff power-law model
Time interval is from    0.000 sec. to    1.000 sec.
Spectral model in the cutoff power-law:
------------------------------------------------------------
Parameters  : value       lower 90%   higher 90%
Photon index: -1.19628     ( -0.322238   0.348536 )
Epeak [keV] : 86.3861      ( -18.8341 82.7001 )
Norm@50keV  : 0.112149    ( -0.0346971   0.0557271 )
------------------------------------------------------------
#Fit statistic : Chi-Squared =          48.40 using 59 PHA bins.
# Reduced chi-squared =         0.8643 for     56 degrees of freedom
# Null hypothesis probability =   7.548065e-01

Photon flux (15-150 keV)    in 1 sec: 6.84585 ( -0.7608  0.65566 ) ph/cm2/s
Energy fluence (15-150 keV)             : 5.88085e-07 ( -3.47986e-08  3.47027e-08 ) ergs/cm2
Time-resolved spectra
Distribution
T90 vs. Hardness ratio plot
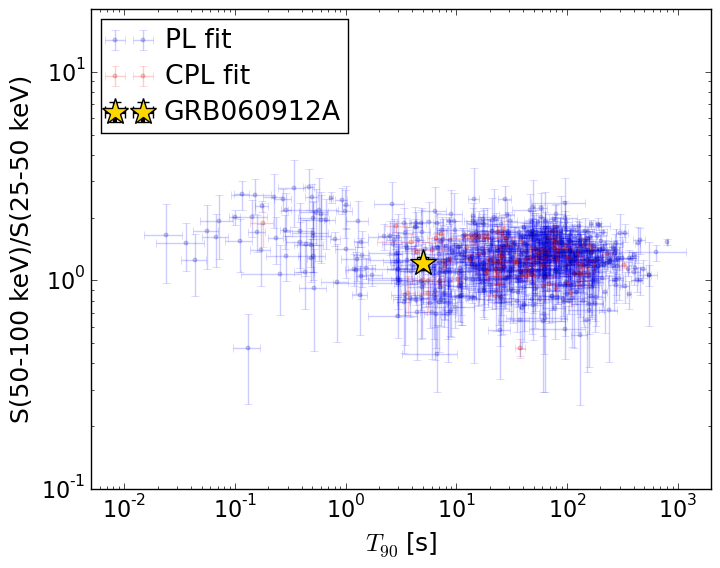
T90                                   = 5.028 sec.
Hardness ratio (energy fluence ratio) = 1.20692432596
S(15-50 keV) vs. S(50-150 keV) plot
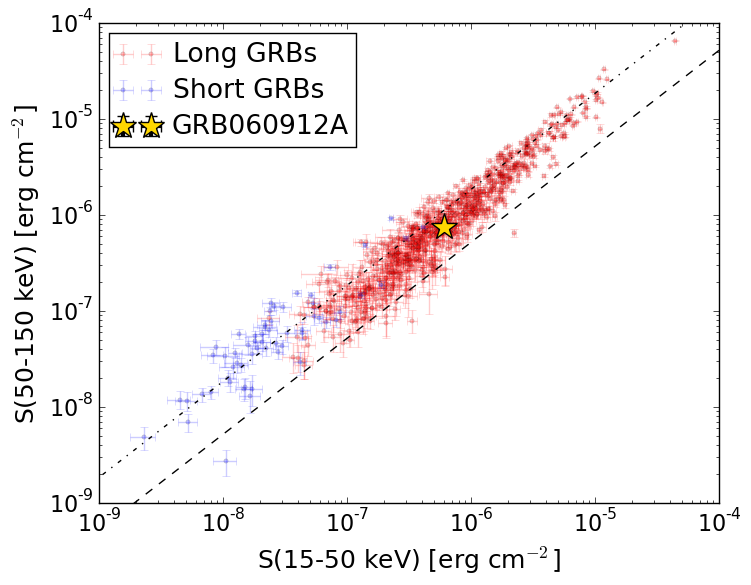
S(15-50 keV)  = 6.074661e-07
S(50-150 keV) = 7.56964e-07
The dash-dotted line and the dashed line traces the fluences calculated from the Band function with Epeak = 15 and 150 keV, respectively. Both lines assume a canonical values of alpha = -1 and beta = -2.5.
Mask shadow pattern
IMX = -3.817101656232284E-01, IMY = -5.305631240612986E-01
Spacecraft aspect plot
Bright source in the pre-burst/pre-slew/post-slew images
Pre-burst image of 15-350 keV band
Time interval of the image:
-239.584000 -0.560000

# RAcent  DECcent POSerr Theta    Phi  PeakCts   SNR AngSep     Name
#  [deg]    [deg]    ['] [deg]  [deg]                   [']
355.5141  12.7222    2.5  38.1  106.0   2.2338   4.6 ------	UNKNOWN
 17.2591  50.9122    2.7  52.1  163.9   2.5176   4.3 ------	UNKNOWN
 49.5971 -54.1787    2.5  56.4  -16.8   2.9734   4.5 ------	UNKNOWN
Pre-slew background subtracted image of 15-350 keV band
Time interval of the image:
-0.560000 6.116000

# RAcent  DECcent POSerr Theta    Phi  PeakCts   SNR AngSep     Name
#  [deg]    [deg]    ['] [deg]  [deg]                   [']
  5.2808  20.9683    0.3  33.2  125.7   2.2789  35.4 ------	UNKNOWN
 74.5641  27.5171    2.2  49.1 -131.8   0.6132   5.2 ------	UNKNOWN
Post-slew image of 15-350 keV band
Time interval of the image:
91.716580 962.515600

# RAcent  DECcent POSerr Theta    Phi  PeakCts   SNR AngSep     Name
#  [deg]    [deg]    ['] [deg]  [deg]                   [']
308.0521  41.0329   12.2  52.0 -175.4   1.1367   1.0    5.5	Cyg X-3
326.1878  38.3360   16.9  37.8 -175.6   0.3855   0.7    1.1	Cyg X-2
319.3383   8.1370    2.5  46.1  139.2   6.9075   4.7 ------	UNKNOWN
 28.5626 -13.0927    3.5  41.0   22.5   2.2205   3.3 ------	UNKNOWN
308.0680  37.6694    0.9  51.8 -179.6  13.9344  12.8 ------	UNKNOWN
 26.6976  29.1347    3.0  21.0  -58.8   1.4936   3.8 ------	UNKNOWN
309.7392  53.9174    2.9  53.1 -159.1   4.9707   4.0 ------	UNKNOWN
 62.4919   8.8548    4.1  56.3  -28.4   6.8111   2.8 ------	UNKNOWN
 61.3116  20.7112    3.2  52.0  -42.1   9.4240   3.6 ------	UNKNOWN