Analysis Summary
Notes:
- 1) No attempt has been made to eliminate the non-significant decimal places.
- 2) This batgrbproduct analysis is done using the HEASARC data.
- 3) This batgrbproduct analysis is using the flight position for the mask-weighting calculation.
======================================================================
                  BAT GRB EVENT DATA PROCESSING REPORT
    Process Script Ver: batgrbproduct v2.46
    Process Start Time: Wed Jan 22 13:36:45 EST 2014
             Host Name: batevent1
   Current Working Dir: /local/data/batevent/batevent_reproc/trigger230115
======================================================================

  Trigger: 00230115      Segment: 000

  BAT Trigger Time: 180344920.128   [s; MET]
      Trigger Stop: 180344921.152   [s; MET]
               UTC: 2006-09-19T07:48:38.674380    [includes UTCF correction]
       Where From?: TDRSS position message

  BAT
    RA: 276.91131212325   Dec: -51.0275372613452  [deg; J2000]

     Catalogged Source?: NO
     Point Source?:      YES
     GRB Indicated?:     YES    [ by BAT flight software ]
     Image S/N Ratio:    9.13
     Image Trigger?:     NO
     Rate S/N Ratio:     25.1594912508182  [ if not an image trigger ]
     Image S/N Ratio:    9.13

  Analysis Position:   [ source = BAT ]
    RA: 276.91131212325   Dec: -51.0275372613452  [deg; J2000]

  Refined Position:   [ source = BAT pre-slew burst ]
    RA: 276.902644615372   Dec: -50.9951488444862  [deg; J2000]
        { 18h 27m 36.6s , -50d 59' 42.5" }
         +/- 1.73338956681534 [arcmin] (estimated 90% radius based on SNR)
         +/- 0.846436941337657 [arcmin] (formal 1-sigma fit error)
    SNR: 13.8623903950303

  Angular difference between the analysis and refined position is 1.970658 arcmin

  Partial Coding Fraction: 0.2929688    [ including projection effects ]

  Duration
     T90: 9.00000002980232 +/- 1.66506215465452
        Measured from: -0.708000004291534
                   to: 8.29200002551079     [s; relative to TRIGTIME]
     T50: 3.21999999880791 +/- 2.73818916804973
        Measured from: 0.0400000214576721
                   to: 3.26000002026558     [s; relative to TRIGTIME]


  Fluence
     Peak Flux  (peak 1 second)
        Measured from: -0.503999978303909
                   to: 0.496000021696091     [s; relative to TRIGTIME]
     Total Fluence
        Measured from: -0.919999986886978
                   to: 9.02799999713898     [s; relative to TRIGTIME]

             Band 1     Band 2     Band 3     Band 4
              15-25      25-50     50-100    100-350     keV
 Total     0.331897   0.349259   0.219154   0.052721
           0.036669   0.033711   0.027664   0.022097 [error]
 Peak      0.054355   0.102812   0.099560   0.019207
           0.012291   0.012125   0.010940   0.007396 [error]

     [ fluence units of on-axis counts / fully illuminated detector ]

======================================================================


====== Table of the duration information =============================

        Value   tstart    tstop
T100    9.948   -0.920    9.028
T90     9.000   -0.708    8.292
T50     3.220    0.040    3.260
Peak    1.000   -0.504    0.496


====== Spectral Analysis Summary =====================================

Model      : spectral model: simple power-law (PL) and cutoff power-law (CPL)
Ph_index   : photon index: E^{Ph_index}
Ph_90err   : 90% error of the photon index
Epeak      : Epeak in keV
Epeak_90err: 90% error of Epeak
Norm       : normalization at 50 keV in both the PL model and CPL model
Nomr_90err : 90% error of the normalization
chi2       : Chi-Squared
dof        : degree of freedo

=== Time-averaged spectral analysis ===
(Best model with acceptable fit: N/A)

Model Ph_index Ph_90err_low Ph_90err_hi  Epeak  Epeak_90err_low  Epeak_90err_hi  Norm       Nomr_90err_low    Norm_90err_hi    chi2    dof
PL      -1.826    -0.188      0.183       -           -               -         5.91e-03     -6.88e-04          6.79e-04      79.100   57
CPL     -0.841    -0.841      1.048       53.341     -10.890        48.802      2.02e-02     -2.02e-02          5.29e-02      75.000   56


=== 1-s peak spectral analysis ===
(Best model with acceptable fit: PL)

Model Ph_index Ph_90err_low Ph_90err_hi  Epeak  Epeak_90err_low  Epeak_90err_hi  Norm       Nomr_90err_low    Norm_90err_hi    chi2    dof
PL      -1.262     -0.196     0.199       -           -               -         1.94e-02     -2.36e-03          2.35e-03      46.620   57
CPL     -0.208     -0.891     1.128       95.238     -24.172       188.448      5.87e-02     -3.51e-02          1.22e-01      42.440   56


=== Fluence/Peak Flux Summary ===

              Model    Band1     Band2     Band3     Band4     Band5     Total
                       15-25     25-50    50-100    100-350    15-150    15-350    keV
Fluence         PL   1.02e-07  1.54e-07  1.73e-07  3.72e-07  5.41e-07  8.01e-07   erg/cm2
      90%_error_low -1.65e-08 -1.64e-08 -2.66e-08 -1.05e-07 -6.31e-08 -1.33e-07   erg/cm2
      90%_error_hi   1.71e-08  1.64e-08  2.68e-08  1.29e-07  6.38e-08  1.51e-07   erg/cm2
Peak flux       PL   6.37e-01  7.39e-01  6.16e-01  8.66e-01  2.30e+00  2.86e+00   ph/cm2/s
      90%_error_low -1.42e-01 -1.08e-01 -8.22e-02 -2.15e-01 -2.95e-01 -3.49e-01   ph/cm2/s
      90%_error_hi   1.53e-01  1.07e-01  8.14e-02  2.54e-01  2.96e-01  3.50e-01   ph/cm2/s

Fluence        CPL   8.98e-08  1.71e-07  1.74e-07  9.88e-08  4.99e-07  5.33e-07   erg/cm2
      90%_error_low -2.00e-08 -2.17e-08 -3.15e-08 -6.39e-08 -6.92e-08 -9.53e-08   erg/cm2
      90%_error_hi   2.01e-08  2.26e-08  3.05e-08  1.95e-07  7.23e-08  2.01e-07   erg/cm2
Peak flux      CPL   4.90e-01  7.84e-01  6.93e-01  3.78e-01  2.21e+00  2.35e+00   ph/cm2/s
      90%_error_low -1.74e-01 -1.23e-01 -1.05e-01 -1.86e-01 -3.06e-01 -3.72e-01   ph/cm2/s
      90%_error_hi   1.91e-01  1.25e-01  1.09e-01  3.80e-01  3.07e-01  4.65e-01   ph/cm2/s

======================================================================
Image
Pre-slew 15.0-350.0 keV image (Event data)

#   RAcent    DECcent   POSerr    Theta     Phi              Peak Cts       SNR   Name
  276.9026   -50.9951   0.0139    32.8743   112.5663         0.9236257     13.862 TRIG_00230115

Foreground time interval of the image:
 -0.920   9.028 (delta_t =   9.948 [sec])
Background time interval of the image:
-239.128  -0.920 (delta_t = 238.208 [sec])
Light Curves
Note: The mask-weighted lightcurves have units of either count/det or counts/sec/det, where a det is 0.4 x 0.4 = 0.16 sq cm.
Full-time range; 1 s binning
Other quick-look light curves:
- 64 ms binning (zoomed)
- 16 ms binning (zoomed)
- 8 ms binning (zoomed)
- 2 ms binning (zoomed)
- SN=5 or 10 s binning (full-time range)
- Raw light curve
Spectra
- 64 ms binning (zoomed)
- 16 ms binning (zoomed)
- 8 ms binning (zoomed)
- 2 ms binning (zoomed)
- SN=5 or 10 s binning (full-time range)
- Raw light curve
Spectra
Notes:
- 1) The fitting includes the systematic errors.
- 2) When the burst includes telescope slew time periods, the fitting uses an average response file made from multiple 5-s response files through out the slew time plus single time preiod for the non-slew times, and weighted by the total counts in the corresponding time period using addrmf. An average response file is needed becuase a spectral fit using the pre-slew DRM will introduce some errors in both a spectral shape and a normalization if the PHA file contains a lot of the slew/post-slew time interval.
- 3) For fits to more complicated models (e.g. a power-law over a cutoff power-law), the BAT team has decided to require a chi-square improvement of more than 6 for each extra dof.
Time averaged spectrum fit using the average DRM
Power-law model

Time interval is from   -0.920 sec. to    9.028 sec.

Spectral model in power-law:
------------------------------------------------------------
Parameters  : value       lower 90%   higher 90%
Photon index: -1.82596     ( -0.187965   0.182925 )
Norm@50keV  : 5.90904E-03    ( -0.000687527   0.000678858 )
------------------------------------------------------------
#Fit statistic : Chi-Squared =          79.10 using 59 PHA bins.
# Reduced chi-squared =          1.388 for     57 degrees of freedom
# Null hypothesis probability =   2.802135e-02

Photon flux (15-150 keV)    in 9.948 sec: 0.822637 ( -0.08917  0.089382 ) ph/cm2/s
Energy fluence (15-150 keV)             : 5.40836e-07 ( -6.31243e-08  6.38025e-08 ) ergs/cm2
Cutoff power-law model

Time interval is from   -0.920 sec. to    9.028 sec.
Spectral model in the cutoff power-law:
------------------------------------------------------------
Parameters  : value       lower 90%   higher 90%
Photon index: -0.84097     ( -0.841277   1.04804 )
Epeak [keV] : 53.3411      ( -10.8902 48.8024 )
Norm@50keV  : 2.01540E-02    ( -0.0201545   0.0529312 )
------------------------------------------------------------
#Fit statistic : Chi-Squared =          75.00 using 59 PHA bins.
# Reduced chi-squared =          1.339 for     56 degrees of freedom
# Null hypothesis probability =   4.583622e-02

Photon flux (15-150 keV)    in 9.948 sec: 0.787372 ( -0.094597  0.094355 ) ph/cm2/s
Energy fluence (15-150 keV)             : 4.98616e-07 ( -6.91625e-08  7.2305e-08 ) ergs/cm2
1-s peak spectrum fit
Power-law model

Time interval is from   -0.504 sec. to    0.496 sec.

Spectral model in power-law:
------------------------------------------------------------
Parameters  : value       lower 90%   higher 90%
Photon index: -1.26196     ( -0.196088   0.199393 )
Norm@50keV  : 1.94446E-02    ( -0.002356   0.00235403 )
------------------------------------------------------------
#Fit statistic : Chi-Squared =          46.62 using 59 PHA bins.
# Reduced chi-squared =         0.8178 for     57 degrees of freedom
# Null hypothesis probability =   8.352867e-01

Photon flux (15-150 keV)    in 1 sec: 2.30435 ( -0.29472  0.29626 ) ph/cm2/s
Energy fluence (15-150 keV)             : 1.94017e-07 ( -2.46144e-08  2.46987e-08 ) ergs/cm2
Cutoff power-law model

Time interval is from   -0.504 sec. to    0.496 sec.
Spectral model in the cutoff power-law:
------------------------------------------------------------
Parameters  : value       lower 90%   higher 90%
Photon index: -0.208306     ( -0.891022   1.12828 )
Epeak [keV] : 95.2380      ( -24.1723 188.448 )
Norm@50keV  : 5.86716E-02    ( -0.0351319   0.121828 )
------------------------------------------------------------
#Fit statistic : Chi-Squared =          42.44 using 59 PHA bins.
# Reduced chi-squared =         0.7579 for     56 degrees of freedom
# Null hypothesis probability =   9.095274e-01

Photon flux (15-150 keV)    in 1 sec: 2.20896 ( -0.30563  0.30741 ) ph/cm2/s
Energy fluence (15-150 keV)             : 1.86097e-07 ( -2.63767e-08  2.61492e-08 ) ergs/cm2
Time-resolved spectra

Distribution
T90 vs. Hardness ratio plot
T90                                   = N/A sec.
Hardness ratio (energy fluence ratio) = N/A
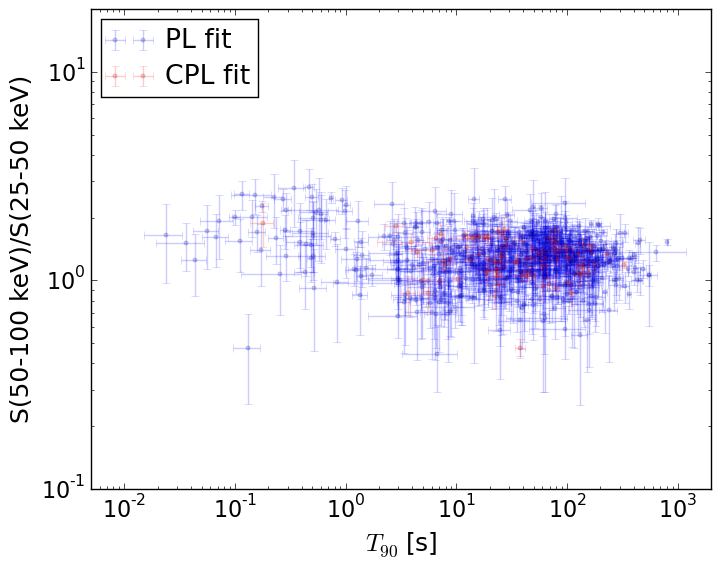
S(15-50 keV) vs. S(50-150 keV) plot

S(15-50 keV)  = N/A
S(50-150 keV) = N/A
The dash-dotted line and the dashed line traces the fluences calculated from the Band function with Epeak = 15 and 150 keV, respectively. Both lines assume a canonical values of alpha = -1 and beta = -2.5.
Mask shadow pattern

IMX = -2.480164407110524E-01, IMY = -5.968109589008466E-01
Spacecraft aspect plot

Bright source in the pre-burst/pre-slew/post-slew images
Pre-burst image of 15-350 keV band
Time interval of the image:
-239.128000 -0.920000

# RAcent  DECcent POSerr Theta    Phi  PeakCts   SNR AngSep     Name
#  [deg]    [deg]    ['] [deg]  [deg]                   [']
170.3099 -60.6192   36.4  44.0 -155.2   0.1203   0.3    0.3	Cen X-3
187.0259 -62.7554   14.1  36.6 -160.5   0.2512   0.8   10.2	GX 301-2
244.9854 -15.6448    0.2  25.2   13.6  12.3633  58.4    0.4	Sco X-1
256.0048 -37.9199    3.9  17.9   81.0   0.6613   3.0    4.6	4U 1700-377
256.3832 -36.4666    5.3  18.5   76.6   0.4875   2.2    3.6	GX 349+2
263.0364 -24.8037    2.1  28.8   56.1   1.6586   5.4    3.8	GX 1+4
264.7820 -44.5496    3.9  24.3  100.4   0.8501   3.0    6.2	4U 1735-44
270.2896 -25.0748    7.2  34.1   63.7   0.6919   1.6    0.4	GX 5-1
270.4398 -25.6089    0.0  33.9   64.6   0.0871   0.2   10.9	GRS 1758-258
274.0979 -13.9172   25.8  43.7   53.0   0.3639   0.4    8.9	GX 17+2
275.7247 -30.2706   12.4  35.8   75.7   0.5144   0.9   11.9	H1820-303
263.0788 -33.7997    1.7  24.5   74.0   1.8723   6.7    4.9	GX 354-0
255.2433 -41.6467    1.7  17.1   93.2   1.4171   6.6 ------	UNKNOWN
217.8669 -27.5919    3.9  16.8  -67.8   0.6329   3.0 ------	UNKNOWN
230.7861  17.7967    2.6  56.4  -16.7   3.9752   4.5 ------	UNKNOWN
Pre-slew background subtracted image of 15-350 keV band
Time interval of the image:
-0.920000 9.028000

# RAcent  DECcent POSerr Theta    Phi  PeakCts   SNR AngSep     Name
#  [deg]    [deg]    ['] [deg]  [deg]                   [']
170.4283 -60.4473   11.8  44.0 -155.0  -0.0508  -1.0   11.1	Cen X-3
186.5852 -62.6318    6.7  36.8 -160.2   0.0703   1.7    8.5	GX 301-2
245.1204 -15.6547    7.6  25.2   13.9  -0.0530  -1.5    8.2	Sco X-1
255.9375 -37.9868    8.1  17.9   81.1  -0.0551  -1.4    8.9	4U 1700-377
256.2470 -36.2790    0.0  18.5   75.9  -0.0293  -0.8   12.6	GX 349+2
263.1044 -24.7149    6.0  28.9   56.1  -0.0982  -1.9    5.5	GX 1+4
264.9299 -44.2996    6.9  24.4   99.7   0.0847   1.7   12.1	4U 1735-44
270.1121 -25.0327    4.2  33.9   63.4   0.2017   2.7    9.8	GX 5-1
270.1647 -25.8774    0.0  33.5   64.8   0.1075   1.5   11.0	GRS 1758-258
273.9946 -13.9101    3.7  43.6   52.9  -0.4567  -3.1    7.6	GX 17+2
275.9292 -30.2802    8.6  35.9   75.8  -0.1262  -1.3    5.2	H1820-303
262.8054 -33.7030    8.8  24.4   73.5   0.0602   1.3   12.1	GX 354-0
276.9027 -50.9952    0.8  32.9  112.6   0.9238  13.9 ------	UNKNOWN
Post-slew image of 15-350 keV band
Time interval of the image:
71.172600 962.940000

# RAcent  DECcent POSerr Theta    Phi  PeakCts   SNR AngSep     Name
#  [deg]    [deg]    ['] [deg]  [deg]                   [']
186.9003 -62.6219   20.4  46.3 -133.4  -0.9654  -0.6   11.1	GX 301-2
244.9826 -15.6327    0.3  43.6  -40.3  40.2191  38.4    0.5	Sco X-1
256.1417 -38.0025    0.0  19.6  -49.2   0.4808   0.9   12.0	4U 1700-377
256.3927 -36.4136    2.3  20.7  -45.8   2.6399   5.0    2.1	GX 349+2
262.9556 -24.7851    2.0  28.3  -20.2   3.0484   5.9    3.8	GX 1+4
264.8623 -44.5397    3.8  10.3  -48.7   1.5248   3.0    7.4	4U 1735-44
268.3502  -1.5056    6.6  50.0   -4.0   1.9611   1.7    3.4	SW J1753.5-0127
270.2707 -25.1049    1.4  26.4   -6.4   4.4454   8.1    1.7	GX 5-1
270.2702 -25.7155    2.4  25.8   -6.6   2.5492   4.7    2.4	GRS 1758-258
274.0035 -13.9889    4.2  37.1    2.5   1.7436   2.8    2.9	GX 17+2
275.9462 -30.3701    1.8  20.6    4.9   3.2193   6.5    1.1	H1820-303
284.9121 -25.0301    4.7  26.7   23.5   1.2804   2.5    9.4	HT1900.1-2455
263.0033 -33.8527    1.3  19.9  -28.6   4.1285   8.8    1.3	GX 354-0
300.4530 -22.3823    3.1  34.0   48.6   2.9721   3.7 ------	UNKNOWN
286.8895 -10.6780    2.3  41.2   22.2   4.0132   4.9 ------	UNKNOWN
255.1552 -41.6185    1.0  17.6  -59.1   5.9830  11.5 ------	UNKNOWN
250.1844 -53.7774    1.8  16.4 -102.9   3.2508   6.4 ------	UNKNOWN
247.8439 -48.8228    1.7  18.7  -87.5   3.7117   6.7 ------	UNKNOWN