Analysis Summary
Notes:
- 1) No attempt has been made to eliminate the non-significant decimal places.
- 2) This batgrbproduct analysis is done using the HEASARC data.
- 3) This batgrbproduct analysis is using the flight position for the mask-weighting calculation.
======================================================================
BAT GRB EVENT DATA PROCESSING REPORT
Process Script Ver: batgrbproduct v2.46
Process Start Time: Wed Jan 22 13:23:17 EST 2014
Host Name: batevent1
Current Working Dir: /local/data/batevent/batevent_reproc/trigger230702
======================================================================
Trigger: 00230702 Segment: 000
BAT Trigger Time: 180704287.68 [s; MET]
Trigger Stop: 180704291.776 [s; MET]
UTC: 2006-09-23T11:38:06.217800 [includes UTCF correction]
Where From?: TDRSS position message
BAT
RA: 238.201486511859 Dec: -30.9072142492461 [deg; J2000]
Catalogged Source?: NO
Point Source?: YES
GRB Indicated?: YES [ by BAT flight software ]
Image S/N Ratio: 9.4
Image Trigger?: NO
Rate S/N Ratio: 10.3923048454133 [ if not an image trigger ]
Image S/N Ratio: 9.4
Analysis Position: [ source = BAT ]
RA: 238.201486511859 Dec: -30.9072142492461 [deg; J2000]
Refined Position: [ source = BAT pre-slew burst ]
RA: 238.187882282817 Dec: -30.9054737709443 [deg; J2000]
{ 15h 52m 45.1s , -30d 54' 19.7" }
+/- 1.6711126016364 [arcmin] (estimated 90% radius based on SNR)
+/- 0.76876867175969 [arcmin] (formal 1-sigma fit error)
SNR: 14.6062519696874
Angular difference between the analysis and refined position is 0.708095 arcmin
Partial Coding Fraction: 0.3632812 [ including projection effects ]
Duration
T90: 8.94800001382828 +/- 1.29634099081825
Measured from: 0.331999987363815
to: 9.28000000119209 [s; relative to TRIGTIME]
T50: 4.30400002002716 +/- 1.05255496990518
Measured from: 2.43599998950958
to: 6.74000000953674 [s; relative to TRIGTIME]
Fluence
Peak Flux (peak 1 second)
Measured from: 4.92800000309944
to: 5.92800000309944 [s; relative to TRIGTIME]
Total Fluence
Measured from: -0.0680000185966492
to: 9.88799998164177 [s; relative to TRIGTIME]
Band 1 Band 2 Band 3 Band 4
15-25 25-50 50-100 100-350 keV
Total 0.391487 0.368509 0.110670 0.029042
0.036084 0.033707 0.029116 0.028135 [error]
Peak 0.062140 0.059262 0.018138 0.005878
0.011742 0.010860 0.009368 0.008608 [error]
[ fluence units of on-axis counts / fully illuminated detector ]
======================================================================
====== Table of the duration information =============================
Value tstart tstop
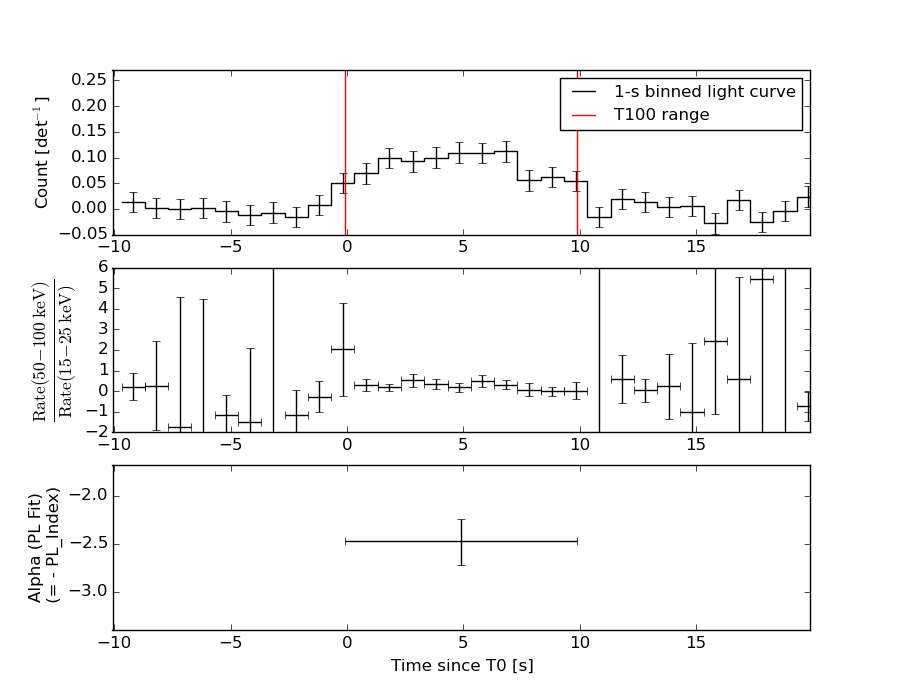
T100 9.956 -0.068 9.888
T90 8.948 0.332 9.280
T50 4.304 2.436 6.740
Peak 1.000 4.928 5.928
====== Spectral Analysis Summary =====================================
Model : spectral model: simple power-law (PL) and cutoff power-law (CPL)
Ph_index : photon index: E^{Ph_index}
Ph_90err : 90% error of the photon index
Epeak : Epeak in keV
Epeak_90err: 90% error of Epeak
Norm : normalization at 50 keV in both the PL model and CPL model
Nomr_90err : 90% error of the normalization
chi2 : Chi-Squared
dof : degree of freedo
=== Time-averaged spectral analysis ===
(Best model with acceptable fit: PL)
Model Ph_index Ph_90err_low Ph_90err_hi Epeak Epeak_90err_low Epeak_90err_hi Norm Nomr_90err_low Norm_90err_hi chi2 dof
PL -2.474 -0.247 0.228 - - - 4.96e-03 -8.37e-04 8.22e-04 58.540 57
CPL -1.814 -0.188 1.302 10.459 N/A N/A 1.26e-02 N/A N/A 57.280 56
=== 1-s peak spectral analysis ===
(Best model with acceptable fit: PL)
Model Ph_index Ph_90err_low Ph_90err_hi Epeak Epeak_90err_low Epeak_90err_hi Norm Nomr_90err_low Norm_90err_hi chi2 dof
PL -2.436 -0.462 0.401 - - - 7.51e-03 -2.45e-03 2.43e-03 59.260 57
CPL 0.017 -2.032 -0.017 26.890 N/A N/A 3.18e-01 N/A N/A 55.860 56
=== Fluence/Peak Flux Summary ===
Model Band1 Band2 Band3 Band4 Band5 Total
15-25 25-50 50-100 100-350 15-150 15-350 keV
Fluence PL 1.59e-07 1.62e-07 1.17e-07 1.35e-07 4.90e-07 5.72e-07 erg/cm2
90%_error_low -2.30e-08 -1.90e-08 -2.62e-08 -5.05e-08 -6.17e-08 -8.96e-08 erg/cm2
90%_error_hi 2.35e-08 1.88e-08 2.77e-08 6.83e-08 6.32e-08 1.01e-07 erg/cm2
Peak flux PL 7.66e-01 4.46e-01 1.65e-01 8.06e-02 1.42e+00 1.46e+00 ph/cm2/s
90%_error_low -2.13e-01 -1.05e-01 -6.56e-02 -4.69e-02 -3.18e-01 -3.26e-01 ph/cm2/s
90%_error_hi 2.21e-01 1.04e-01 7.27e-02 7.71e-02 3.18e-01 3.26e-01 ph/cm2/s
Fluence CPL N/A N/A N/A N/A N/A N/A erg/cm2
90%_error_low -2.30e-08 -1.90e-08 -2.62e-08 -5.05e-08 -6.17e-08 -8.96e-08 erg/cm2
90%_error_hi 2.35e-08 1.88e-08 2.77e-08 6.83e-08 6.32e-08 1.01e-07 erg/cm2
Peak flux CPL 7.03e-01 5.63e-01 6.71e-02 4.90e-04 1.33e+00 1.34e+00 ph/cm2/s
90%_error_low -2.40e-01 -1.52e-01 -6.71e-02 N/A -3.26e-01 -3.29e-01 ph/cm2/s
90%_error_hi 2.44e-01 1.53e-01 1.39e-01 N/A 3.29e-01 3.27e-01 ph/cm2/s
======================================================================
Image
Pre-slew 15.0-350.0 keV image (Event data)
#   RAcent    DECcent   POSerr    Theta     Phi              Peak Cts       SNR   Name
  238.1879   -30.9055   0.0131    46.0736  -156.8753         0.9609352     14.606 TRIG_00230702

Foreground time interval of the image:
 -0.068   9.888 (delta_t =   9.956 [sec])
Background time interval of the image:
-239.680  -0.068 (delta_t = 239.612 [sec])
Light Curves
Note: The mask-weighted lightcurves have units of either count/det or counts/sec/det, where a det is 0.4 x 0.4 = 0.16 sq cm.
Full-time range; 1 s binning
Other quick-look light curves:
- 64 ms binning (zoomed)
- 16 ms binning (zoomed)
- 8 ms binning (zoomed)
- 2 ms binning (zoomed)
- SN=5 or 10 s binning (full-time range)
- Raw light curve
Spectra
- 64 ms binning (zoomed)
- 16 ms binning (zoomed)
- 8 ms binning (zoomed)
- 2 ms binning (zoomed)
- SN=5 or 10 s binning (full-time range)
- Raw light curve
Spectra
Notes:
- 1) The fitting includes the systematic errors.
- 2) When the burst includes telescope slew time periods, the fitting uses an average response file made from multiple 5-s response files through out the slew time plus single time preiod for the non-slew times, and weighted by the total counts in the corresponding time period using addrmf. An average response file is needed becuase a spectral fit using the pre-slew DRM will introduce some errors in both a spectral shape and a normalization if the PHA file contains a lot of the slew/post-slew time interval.
- 3) For fits to more complicated models (e.g. a power-law over a cutoff power-law), the BAT team has decided to require a chi-square improvement of more than 6 for each extra dof.
Time averaged spectrum fit using the average DRM
Power-law model
Time interval is from   -0.068 sec. to    9.888 sec.

Spectral model in power-law:
------------------------------------------------------------
Parameters  : value       lower 90%   higher 90%
Photon index: -2.47374     ( -0.246634   0.227504 )
Norm@50keV  : 4.95785E-03    ( -0.000836987   0.000822281 )
------------------------------------------------------------
#Fit statistic : Chi-Squared =          58.54 using 59 PHA bins.
# Reduced chi-squared =          1.027 for     57 degrees of freedom
# Null hypothesis probability =   4.185311e-01

Photon flux (15-150 keV)    in 9.956 sec: 0.958639 ( -0.105124  0.105201 ) ph/cm2/s
Energy fluence (15-150 keV)             : 4.90303e-07 ( -6.17498e-08  6.32062e-08 ) ergs/cm2
Cutoff power-law model
Time interval is from   -0.068 sec. to    9.888 sec.
Spectral model in the cutoff power-law:
------------------------------------------------------------
Parameters  : value       lower 90%   higher 90%
Photon index: -1.81447     ( -0.187983   1.30195 )
Epeak [keV] : 10.4592      (   )
Norm@50keV  : 1.26316E-02    (     )
------------------------------------------------------------
#Fit statistic : Chi-Squared =          57.28 using 59 PHA bins.
# Reduced chi-squared =          1.023 for     56 degrees of freedom
# Null hypothesis probability =   4.275784e-01

Photon flux (15-150 keV)    in 9.956 sec: 0.934548 ( -0.111141  0.107842 ) ph/cm2/s
Energy fluence (15-150 keV)             : 0 ( 0  0 ) ergs/cm2
1-s peak spectrum fit
Power-law model
Time interval is from    4.928 sec. to    5.928 sec.

Spectral model in power-law:
------------------------------------------------------------
Parameters  : value       lower 90%   higher 90%
Photon index: -2.43605     ( -0.461428   0.401835 )
Norm@50keV  : 7.50593E-03    ( -0.00244453   0.00243357 )
------------------------------------------------------------
#Fit statistic : Chi-Squared =          59.26 using 59 PHA bins.
# Reduced chi-squared =          1.040 for     57 degrees of freedom
# Null hypothesis probability =   3.930457e-01

Photon flux (15-150 keV)    in 1 sec: 1.41884 ( -0.31798  0.31819 ) ph/cm2/s
Energy fluence (15-150 keV)             : 7.38499e-08 ( -1.8854e-08  1.97187e-08 ) ergs/cm2
Cutoff power-law model
Time interval is from    4.928 sec. to    5.928 sec.
Spectral model in the cutoff power-law:
------------------------------------------------------------
Parameters  : value       lower 90%   higher 90%
Photon index: 0.0171221     ( -2.06789   -0.0528611 )
Epeak [keV] : 26.8898      (   )
Norm@50keV  : 0.317531    (     )
------------------------------------------------------------
#Fit statistic : Chi-Squared =          55.85 using 59 PHA bins.
# Reduced chi-squared =         0.9974 for     56 degrees of freedom
# Null hypothesis probability =   4.803649e-01

Photon flux (15-150 keV)    in 1 sec: 1.33308 ( -0.32638  0.32901 ) ph/cm2/s
Energy fluence (15-150 keV)             : 0 ( 0  0 ) ergs/cm2
Time-resolved spectra
Distribution
T90 vs. Hardness ratio plot
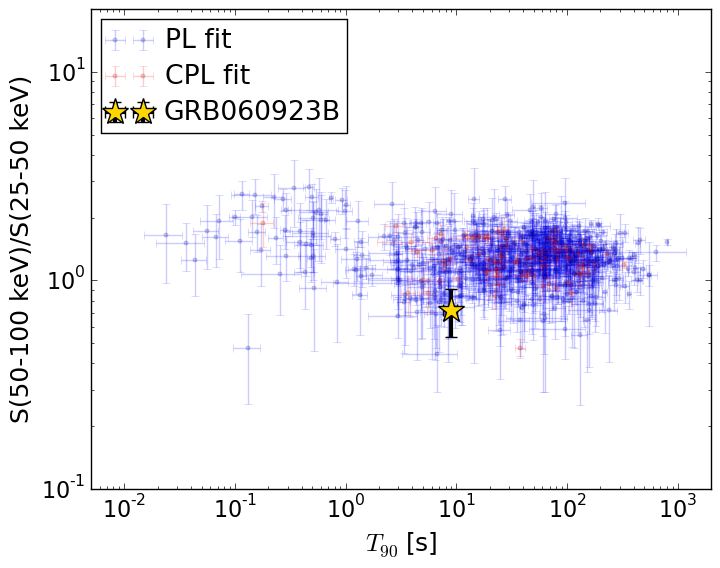
T90                                   = 8.948 sec.
Hardness ratio (energy fluence ratio) = 0.720128997979
S(15-50 keV) vs. S(50-150 keV) plot
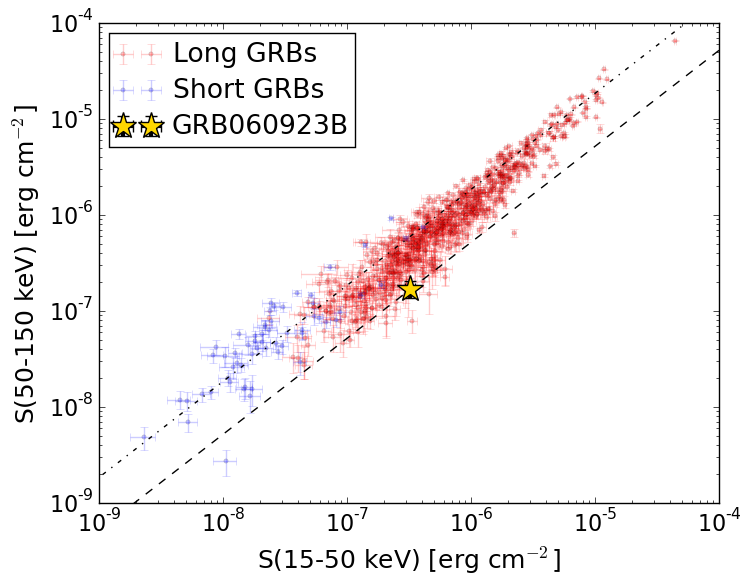
S(15-50 keV)  = 3.209453e-07
S(50-150 keV) = 1.6935626e-07
The dash-dotted line and the dashed line traces the fluences calculated from the Band function with Epeak = 15 and 150 keV, respectively. Both lines assume a canonical values of alpha = -1 and beta = -2.5.
Mask shadow pattern
IMX = -9.547791601715945E-01, IMY = 4.077347397311630E-01
Spacecraft aspect plot
Bright source in the pre-burst/pre-slew/post-slew images
Pre-burst image of 15-350 keV band
Time interval of the image:
-239.680000 -0.068000

# RAcent  DECcent POSerr Theta    Phi  PeakCts   SNR AngSep     Name
#  [deg]    [deg]    ['] [deg]  [deg]                   [']
244.9831 -15.6404    0.2  29.6 -157.5  12.5364  52.8    0.2	Sco X-1
254.4607  35.3451    1.8  23.0    3.1   1.5210   6.5    0.2	Her X-1
256.0200 -37.8621    1.9  50.3 -178.0   3.2547   6.2    1.9	4U 1700-377
256.4340 -36.4427    6.4  48.8 -178.5   0.7840   1.8    1.2	GX 349+2
263.0945 -24.7457    8.3  38.0  170.9   0.4604   1.4    4.7	GX 1+4
268.3932  -1.3044   11.0  19.3  137.5   0.2497   1.0    9.0	SW J1753.5-0127
270.2347 -24.9761    5.3  40.3  161.3   0.9306   2.2    6.7	GX 5-1
270.3100 -25.8908    6.8  41.2  161.8   0.7556   1.7    8.9	GRS 1758-258
274.0133 -14.0253   27.0  32.6  146.8   0.1486   0.4    0.8	GX 17+2
276.0567 -30.2018   24.6  47.3  158.0   0.3302   0.5   12.0	H1820-303
284.9276 -25.0439   59.5  47.7  145.2   0.1719   0.2    9.5	HT1900.1-2455
288.7050  10.9054    3.3  33.4   92.3   1.8166   3.4    6.0	GRS 1915+105
262.9665 -33.8717    3.0  46.9  173.9   1.7874   3.8    2.5	GX 354-0
231.3413  -8.1506    2.8  30.9 -127.0   1.1591   4.1 ------	UNKNOWN
208.0506  32.7121    3.2  47.1  -53.1   3.8613   3.7 ------	UNKNOWN
Pre-slew background subtracted image of 15-350 keV band
Time interval of the image:
-0.068000 9.888000

# RAcent  DECcent POSerr Theta    Phi  PeakCts   SNR AngSep     Name
#  [deg]    [deg]    ['] [deg]  [deg]                   [']
245.0958 -15.6468    4.4  29.6 -157.7  -0.1014  -2.6    6.7	Sco X-1
254.2785  35.4843    6.0  23.1    2.7   0.0735   1.9   12.2	Her X-1
255.8604 -37.8064    6.5  50.2 -177.8   0.1463   1.8    6.4	4U 1700-377
256.4607 -36.4347   30.2  48.8 -178.5   0.0295   0.4    1.4	GX 349+2
262.9227 -24.6741    7.3  37.9  171.1  -0.0818  -1.6    6.4	GX 1+4
268.2215  -1.3156    0.0  19.2  137.9  -0.0460  -1.2   12.0	SW J1753.5-0127
270.2606 -25.0717    5.9  40.4  161.3  -0.1220  -2.0    1.4	GX 5-1
270.3601 -25.7063   12.4  41.0  161.6   0.0598   0.9    3.8	GRS 1758-258
274.1039 -14.0453   17.1  32.7  146.7   0.0342   0.7    5.7	GX 17+2
275.8462 -30.2350   10.4  47.3  158.2  -0.1091  -1.1    8.9	H1820-303
284.9069 -24.8840    3.7  47.5  145.1  -0.4239  -3.1    7.4	HT1900.1-2455
288.9293  11.0634    8.0  33.6   92.0   0.1178   1.5   10.5	GRS 1915+105
262.9827 -33.6846   11.0  46.7  173.9   0.0775   1.1    9.0	GX 354-0
286.9731  56.5503    2.8  50.7   25.8   0.6880   4.1 ------	UNKNOWN
239.3845  61.6710    2.2  50.5   -5.9   0.4358   5.2 ------	UNKNOWN
238.1879 -30.9055    0.8  46.1 -156.9   0.9613  14.6 ------	UNKNOWN
222.6574  49.9861    2.5  45.8  -24.9   0.3000   4.7 ------	UNKNOWN
Post-slew image of 15-350 keV band
Time interval of the image:
101.220590 388.920600

# RAcent  DECcent POSerr Theta    Phi  PeakCts   SNR AngSep     Name
#  [deg]    [deg]    ['] [deg]  [deg]                   [']
170.2972 -60.6233   78.3  52.7 -162.9   0.1051   0.1    0.5	Cen X-3
187.0181 -62.7662  113.3  45.4 -167.6   0.0485   0.1    9.9	GX 301-2
244.9781 -15.6388    0.2  16.5    6.0  13.2803  55.9    0.1	Sco X-1
255.9948 -37.8419    0.7  16.2  102.5   4.0199  15.9    0.4	4U 1700-377
256.4786 -36.4127    3.0  16.2   97.2   0.9802   3.9    2.2	GX 349+2
263.1171 -24.7487    2.2  22.8   62.9   1.8299   5.3    5.9	GX 1+4
264.6753 -44.3124    6.4  24.7  112.6  -0.6215  -1.8    8.8	4U 1735-44
268.4950  -1.3423    0.0  41.2   32.3   0.5796   1.0   10.1	SW J1753.5-0127
270.2497 -25.1149    5.2  28.8   68.8   0.8618   2.2    2.8	GX 5-1
270.1383 -25.8432    5.1  28.5   70.2   0.9049   2.2   10.7	GRS 1758-258
273.9866 -13.8997    8.8  37.0   53.1   0.7369   1.3    8.3	GX 17+2
276.0304 -30.4718    5.6  32.4   81.5   1.1201   2.1    8.3	H1820-303
262.9567 -33.8641    1.9  21.1   87.0   1.8611   6.1    2.4	GX 354-0
156.8627 -59.1634    4.8  59.5 -161.7   6.2567   2.4 ------	UNKNOWN
195.5740 -16.9828    4.2  41.1  -98.0   5.1088   2.8 ------	UNKNOWN
183.7363 -31.8199    2.8  46.0 -123.8   6.2952   4.1 ------	UNKNOWN
218.1162  17.4035    4.7  52.0  -42.3   4.3281   2.5 ------	UNKNOWN