Analysis Summary
Notes:
- 1) No attempt has been made to eliminate the non-significant decimal places.
- 2) This batgrbproduct analysis is done using the HEASARC data.
- 3) This batgrbproduct analysis is using the flight position for the mask-weighting calculation.
======================================================================
                  BAT GRB EVENT DATA PROCESSING REPORT
    Process Script Ver: batgrbproduct v2.46
    Process Start Time: Wed Jan 22 13:19:19 EST 2014
             Host Name: batevent1
   Current Working Dir: /local/data/batevent/batevent_reproc/trigger230711
======================================================================

  Trigger: 00230711      Segment: 000

  BAT Trigger Time: 180711184   [s; MET]
      Trigger Stop: 180711272   [s; MET]
               UTC: 2006-09-23T13:33:02.537640    [includes UTCF correction]
       Where From?: TDRSS position message

  BAT
    RA: 346.126952999923   Dec: 3.94232297853285  [deg; J2000]

     Catalogged Source?: NO
     Point Source?:      YES
     GRB Indicated?:     YES    [ by BAT flight software ]
     Image S/N Ratio:    11.45
     Image Trigger?:     YES
     Rate S/N Ratio:     0  [ if not an image trigger ]
     Image S/N Ratio:    11.45

  Analysis Position:   [ source = BAT ]
    RA: 346.126952999923   Dec: 3.94232297853285  [deg; J2000]

  Refined Position:   [ source = BAT pre-slew burst ]
    RA: 346.119979611968   Dec: 3.9386274639519  [deg; J2000]
        { 23h 04m 28.8s , +03d 56' 19.1" }
         +/- 2.06991008803673 [arcmin] (estimated 90% radius based on SNR)
         +/- 0.76067956405974 [arcmin] (formal 1-sigma fit error)
    SNR: 10.7586832428085

  Angular difference between the analysis and refined position is 0.472651 arcmin

  Partial Coding Fraction: 0.1738281    [ including projection effects ]

  Duration
     T90: 73.7279999554157 +/- 9.93160611239548
        Measured from: 8.85600000619888
                   to: 82.5839999616146     [s; relative to TRIGTIME]
     T50: 30.5279999673367 +/- 11.9638843075177
        Measured from: 26.472000002861
                   to: 56.9999999701977     [s; relative to TRIGTIME]


  Fluence
     Peak Flux  (peak 1 second)
        Measured from: 27.5
                   to: 28.5     [s; relative to TRIGTIME]
     Total Fluence
        Measured from: 6.82400000095367
                   to: 86.6159999966621     [s; relative to TRIGTIME]

             Band 1     Band 2     Band 3     Band 4
              15-25      25-50     50-100    100-350     keV
 Total     1.070236   1.324310   0.398699   0.184159
           0.110689   0.116936   0.103485   0.098425 [error]
 Peak      0.048130   0.036328   0.015754   0.006414
           0.013766   0.013555   0.012411   0.011316 [error]

     [ fluence units of on-axis counts / fully illuminated detector ]

======================================================================


====== Table of the duration information =============================

        Value   tstart    tstop
T100   79.792    6.824   86.616
T90    73.728    8.856   82.584
T50    30.528   26.472   57.000
Peak    1.000   27.500   28.500


====== Spectral Analysis Summary =====================================

Model      : spectral model: simple power-law (PL) and cutoff power-law (CPL)
Ph_index   : photon index: E^{Ph_index}
Ph_90err   : 90% error of the photon index
Epeak      : Epeak in keV
Epeak_90err: 90% error of Epeak
Norm       : normalization at 50 keV in both the PL model and CPL model
Nomr_90err : 90% error of the normalization
chi2       : Chi-Squared
dof        : degree of freedo

=== Time-averaged spectral analysis ===
(Best model with acceptable fit: PL)

Model Ph_index Ph_90err_low Ph_90err_hi  Epeak  Epeak_90err_low  Epeak_90err_hi  Norm       Nomr_90err_low    Norm_90err_hi    chi2    dof
PL      -2.244    -0.236      0.219       -           -               -         2.08e-03     -3.43e-04          3.36e-04      52.870   57
CPL     -1.129    -0.886      1.685       28.322     -26.767         9.172      1.04e-02     -1.04e-02          1.17e-01      50.410   56


=== 1-s peak spectral analysis ===
(Best model with acceptable fit: N/A)

Model Ph_index Ph_90err_low Ph_90err_hi  Epeak  Epeak_90err_low  Epeak_90err_hi  Norm       Nomr_90err_low    Norm_90err_hi    chi2    dof
PL      -2.098     -0.816     0.622       -           -               -         5.67e-03     -2.95e-03          2.81e-03      38.100   57
CPL     -0.026     -2.118     0.026       41.860      N/A           N/A         8.14e-02        N/A               N/A         36.500   56


=== Fluence/Peak Flux Summary ===

              Model    Band1     Band2     Band3     Band4     Band5     Total
                       15-25     25-50    50-100    100-350    15-150    15-350    keV
Fluence         PL   4.28e-07  5.01e-07  4.23e-07  6.05e-07  1.57e-06  1.96e-06   erg/cm2
      90%_error_low -6.19e-08 -5.95e-08 -9.28e-08 -2.22e-07 -2.15e-07 -3.53e-07   erg/cm2
      90%_error_hi   6.30e-08  5.89e-08  9.74e-08  2.97e-07  2.22e-07  4.09e-07   erg/cm2
Peak flux       PL   4.16e-01  2.95e-01  1.38e-01  9.02e-02  8.92e-01  9.39e-01   ph/cm2/s
      90%_error_low -1.96e-01 -1.17e-01 -8.39e-02 -9.02e-02 -3.44e-01 -3.64e-01   ph/cm2/s
      90%_error_hi   2.13e-01  1.15e-01  9.21e-02  1.47e-01  3.44e-01  3.69e-01   ph/cm2/s

Fluence        CPL   4.07e-07  5.62e-07  3.50e-07  8.81e-08  1.39e-06  1.41e-06   erg/cm2
      90%_error_low -6.94e-08 -8.70e-08 -1.46e-07    N/A    -2.33e-07 -2.50e-07   erg/cm2
      90%_error_hi   6.84e-08  9.08e-08  1.35e-07    N/A     2.87e-07  5.84e-07   erg/cm2
Peak flux      CPL   3.18e-01  3.76e-01  1.48e-01  1.34e-02  8.55e-01  8.55e-01   ph/cm2/s
      90%_error_low     N/A   -1.58e-01 -1.01e-01 -1.34e-02 -5.31e-01 -4.03e-01   ph/cm2/s
      90%_error_hi      N/A    1.69e-01  1.16e-01  1.25e-01  3.48e-01  3.57e-01   ph/cm2/s

======================================================================
Image
Pre-slew 15.0-350.0 keV image (Event data)
#   RAcent    DECcent   POSerr    Theta     Phi              Peak Cts       SNR   Name
  346.1200     3.9386   0.0179    36.8819    65.4624         2.7499743     10.759 TRIG_00230711

Foreground time interval of the image:
  6.824  86.616 (delta_t =  79.792 [sec])
Background time interval of the image:
-239.000   6.824 (delta_t = 245.824 [sec])
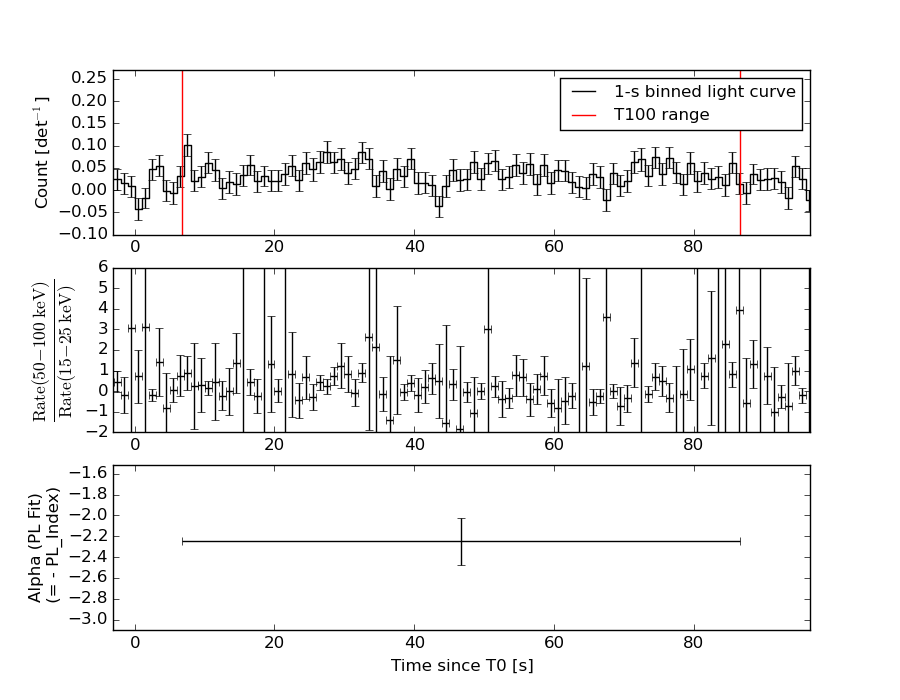
Light Curves
Note: The mask-weighted lightcurves have units of either count/det or counts/sec/det, where a det is 0.4 x 0.4 = 0.16 sq cm.
Full-time range; 1 s binning
Other quick-look light curves:
- 64 ms binning (zoomed)
- 16 ms binning (zoomed)
- 8 ms binning (zoomed)
- 2 ms binning (zoomed)
- SN=5 or 10 s binning (full-time range)
- Raw light curve
Spectra
- 64 ms binning (zoomed)
- 16 ms binning (zoomed)
- 8 ms binning (zoomed)
- 2 ms binning (zoomed)
- SN=5 or 10 s binning (full-time range)
- Raw light curve
Spectra
Notes:
- 1) The fitting includes the systematic errors.
- 2) When the burst includes telescope slew time periods, the fitting uses an average response file made from multiple 5-s response files through out the slew time plus single time preiod for the non-slew times, and weighted by the total counts in the corresponding time period using addrmf. An average response file is needed becuase a spectral fit using the pre-slew DRM will introduce some errors in both a spectral shape and a normalization if the PHA file contains a lot of the slew/post-slew time interval.
- 3) For fits to more complicated models (e.g. a power-law over a cutoff power-law), the BAT team has decided to require a chi-square improvement of more than 6 for each extra dof.
Time averaged spectrum fit using the average DRM
Power-law model
Time interval is from    6.824 sec. to   86.616 sec.

Spectral model in power-law:
------------------------------------------------------------
Parameters  : value       lower 90%   higher 90%
Photon index: -2.2436     ( -0.236028   0.218623 )
Norm@50keV  : 2.07708E-03    ( -0.000342968   0.000336412 )
------------------------------------------------------------
#Fit statistic : Chi-Squared =          52.87 using 59 PHA bins.
# Reduced chi-squared =         0.9275 for     57 degrees of freedom
# Null hypothesis probability =   6.308149e-01

Photon flux (15-150 keV)    in 79.79 sec: 0.351980 ( -0.03909  0.03909 ) ph/cm2/s
Energy fluence (15-150 keV)             : 1.56877e-06 ( -2.15048e-07  2.21708e-07 ) ergs/cm2
Cutoff power-law model
Time interval is from    6.824 sec. to   86.616 sec.
Spectral model in the cutoff power-law:
------------------------------------------------------------
Parameters  : value       lower 90%   higher 90%
Photon index: -1.12926     ( -0.887265   1.68352 )
Epeak [keV] : 28.3216      ( -26.7766 9.16199 )
Norm@50keV  : 1.03766E-02    ( -0.0104096   0.11716 )
------------------------------------------------------------
#Fit statistic : Chi-Squared =          50.41 using 59 PHA bins.
# Reduced chi-squared =         0.9002 for     56 degrees of freedom
# Null hypothesis probability =   6.854827e-01

Photon flux (15-150 keV)    in 79.79 sec: 0.339051 ( -0.041017  0.041398 ) ph/cm2/s
Energy fluence (15-150 keV)             : 1.38809e-06 ( -2.33047e-07  2.87116e-07 ) ergs/cm2
1-s peak spectrum fit
Power-law model
Time interval is from   27.500 sec. to   28.500 sec.

Spectral model in power-law:
------------------------------------------------------------
Parameters  : value       lower 90%   higher 90%
Photon index: -2.09755     ( -0.815286   0.62289 )
Norm@50keV  : 5.67378E-03    ( -0.00294643   0.00280951 )
------------------------------------------------------------
#Fit statistic : Chi-Squared =          38.10 using 59 PHA bins.
# Reduced chi-squared =         0.6683 for     57 degrees of freedom
# Null hypothesis probability =   9.744983e-01

Photon flux (15-150 keV)    in 1 sec: 0.891630 ( -0.343971  0.34398 ) ph/cm2/s
Energy fluence (15-150 keV)             : 5.27036e-08 ( -2.35763e-08  2.54286e-08 ) ergs/cm2
Cutoff power-law model
Time interval is from   27.500 sec. to   28.500 sec.
Spectral model in the cutoff power-law:
------------------------------------------------------------
Parameters  : value       lower 90%   higher 90%
Photon index: -0.0263354     ( -2.26546   -0.12114 )
Epeak [keV] : 41.8599      (   )
Norm@50keV  : 8.13717E-02    (     )
------------------------------------------------------------
#Fit statistic : Chi-Squared =          36.50 using 59 PHA bins.
# Reduced chi-squared =         0.6518 for     56 degrees of freedom
# Null hypothesis probability =   9.797829e-01

Photon flux (15-150 keV)    in 1 sec: 0.855341 ( -0.531402  0.348219 ) ph/cm2/s
Energy fluence (15-150 keV)             : 4.95713e-08 ( -2.06811e-08  2.39427e-08 ) ergs/cm2
Time-resolved spectra
Distribution
T90 vs. Hardness ratio plot
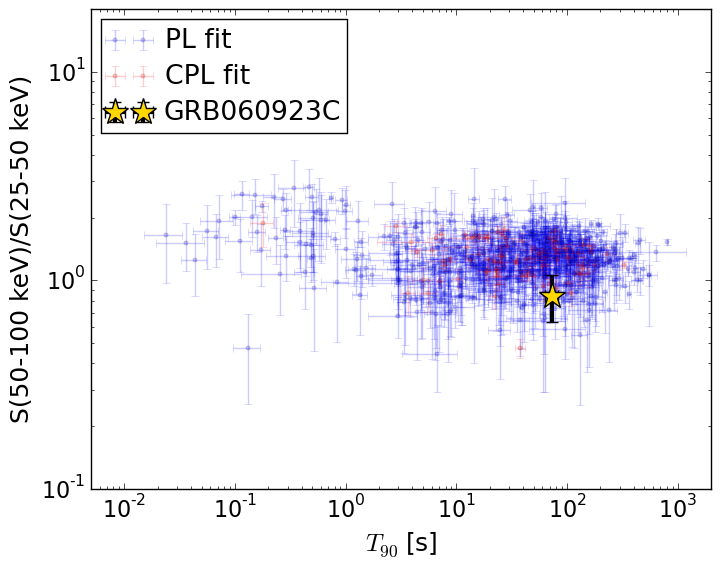
T90                                   = 73.728 sec.
Hardness ratio (energy fluence ratio) = 0.844675746662
S(15-50 keV) vs. S(50-150 keV) plot
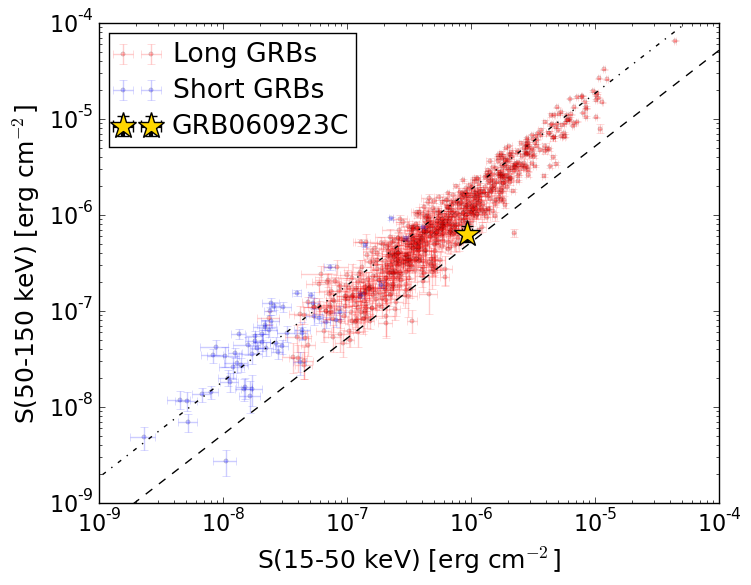
S(15-50 keV)  = 9.288687e-07
S(50-150 keV) = 6.399075e-07
The dash-dotted line and the dashed line traces the fluences calculated from the Band function with Epeak = 15 and 150 keV, respectively. Both lines assume a canonical values of alpha = -1 and beta = -2.5.
Mask shadow pattern
IMX = 3.116029084608269E-01, IMY = -6.825640912998497E-01
Spacecraft aspect plot

Bright source in the pre-burst/pre-slew/post-slew images
Pre-burst image of 15-350 keV band
Time interval of the image:
-239.000000 6.824000

# RAcent  DECcent POSerr Theta    Phi  PeakCts   SNR AngSep     Name
#  [deg]    [deg]    ['] [deg]  [deg]                   [']
285.1042 -24.9698   10.1  57.6  -26.8   1.4230   1.1    4.7	HT1900.1-2455
 14.5430  -7.4317    2.6  33.2  119.8   1.5385   4.4 ------	UNKNOWN
 10.2768 -47.8148    2.8  20.9 -143.8   0.6852   4.1 ------	UNKNOWN
309.4091 -35.5550    2.1  34.5  -32.7   1.1734   5.4 ------	UNKNOWN
 39.2553 -55.4099    2.7  40.2 -146.8   1.1240   4.2 ------	UNKNOWN
324.1916 -70.8044    4.8  40.9  -92.8   2.2592   2.4 ------	UNKNOWN
Pre-slew background subtracted image of 15-350 keV band
Time interval of the image:
6.824000 86.616000

# RAcent  DECcent POSerr Theta    Phi  PeakCts   SNR AngSep     Name
#  [deg]    [deg]    ['] [deg]  [deg]                   [']
285.0305 -25.1017    6.2  57.6  -26.9  -0.9907  -1.9   10.9	HT1900.1-2455
356.6368   6.3311    2.3  39.3   82.5   2.1577   5.1  429.9	UNKNOWN
346.1200   3.9386    1.1  36.9   65.5   2.7499  10.8 ------	UNKNOWN
 52.9668 -48.5106    2.4  48.1 -157.6   0.9275   4.7 ------	UNKNOWN
Post-slew image of 15-350 keV band
Time interval of the image:
190.500600 963.103200

# RAcent  DECcent POSerr Theta    Phi  PeakCts   SNR AngSep     Name
#  [deg]    [deg]    ['] [deg]  [deg]                   [']
326.2631  38.4197    4.0  38.9  -39.7   1.7538   2.9    7.3	Cyg X-2
 23.0203  43.3653    3.5  51.1   19.6   6.5386   3.3 ------	UNKNOWN
331.6243 -18.0449    3.3  26.3 -161.9   1.3745   3.5 ------	UNKNOWN
317.0617 -48.4911    2.3  58.3 -172.3  10.4057   4.9 ------	UNKNOWN
306.1538 -43.3880    4.6  59.5 -161.7   9.0493   2.5 ------	UNKNOWN
324.3788  57.6259    3.9  56.3  -28.3   6.4713   2.9 ------	UNKNOWN
311.2437  40.8078    3.1  48.3  -50.0   7.3648   3.7 ------	UNKNOWN
305.0203   7.2351    4.4  41.1  -98.1   6.5298   2.7 ------	UNKNOWN
303.5000  -2.2338    3.5  43.1 -112.1   6.0183   3.3 ------	UNKNOWN