Analysis Summary
Notes:
- 1) No attempt has been made to eliminate the non-significant decimal places.
- 2) This batgrbproduct analysis is done using the HEASARC data.
- 3) This batgrbproduct analysis is using the flight position for the mask-weighting calculation.
======================================================================
                  BAT GRB EVENT DATA PROCESSING REPORT
    Process Script Ver: batgrbproduct v2.46
    Process Start Time: Wed Jan 22 13:09:13 EST 2014
             Host Name: batevent1
   Current Working Dir: /local/data/batevent/batevent_reproc/trigger231362
======================================================================

  Trigger: 00231362      Segment: 000

  BAT Trigger Time: 181058856.768   [s; MET]
      Trigger Stop: 181058857.024   [s; MET]
               UTC: 2006-09-27T14:07:35.297340    [includes UTCF correction]
       Where From?: TDRSS position message

  BAT
    RA: 329.55252602015   Dec: 5.35273339381842  [deg; J2000]

     Catalogged Source?: NO
     Point Source?:      YES
     GRB Indicated?:     YES    [ by BAT flight software ]
     Image S/N Ratio:    12.06
     Image Trigger?:     NO
     Rate S/N Ratio:     32.1403173599764  [ if not an image trigger ]
     Image S/N Ratio:    12.06

  Analysis Position:   [ source = BAT ]
    RA: 329.55252602015   Dec: 5.35273339381842  [deg; J2000]

  Refined Position:   [ source = BAT pre-slew burst ]
    RA: 329.550783526144   Dec: 5.36836317898992  [deg; J2000]
        { 21h 58m 12.2s , +05d 22' 06.1" }
         +/- 0.819646589645426 [arcmin] (estimated 90% radius based on SNR)
         +/- 0.188250911544374 [arcmin] (formal 1-sigma fit error)
    SNR: 40.4118655725539

  Angular difference between the analysis and refined position is 0.943546 arcmin

  Partial Coding Fraction: 0.8203125    [ including projection effects ]

  Duration
     T90: 22.4160000085831 +/- 1.19091395444634
        Measured from: -0.0800000131130219
                   to: 22.33599999547     [s; relative to TRIGTIME]
     T50: 15.7599999904633 +/- 5.19767638389395
        Measured from: 1.07600000500679
                   to: 16.83599999547     [s; relative to TRIGTIME]


  Fluence
     Peak Flux  (peak 1 second)
        Measured from: 0.215999990701675
                   to: 1.21599999070168     [s; relative to TRIGTIME]
     Total Fluence
        Measured from: -0.992000013589859
                   to: 23.7520000040531     [s; relative to TRIGTIME]

             Band 1     Band 2     Band 3     Band 4
              15-25      25-50     50-100    100-350     keV
 Total     0.565441   0.832084   0.526809   0.077255
           0.026364   0.027983   0.024841   0.020986 [error]
 Peak      0.064426   0.131529   0.124873   0.035873
           0.005995   0.007091   0.006874   0.005084 [error]

     [ fluence units of on-axis counts / fully illuminated detector ]

======================================================================


====== Table of the duration information =============================

        Value   tstart    tstop
T100   24.744   -0.992   23.752
T90    22.416   -0.080   22.336
T50    15.760    1.076   16.836
Peak    1.000    0.216    1.216


====== Spectral Analysis Summary =====================================

Model      : spectral model: simple power-law (PL) and cutoff power-law (CPL)
Ph_index   : photon index: E^{Ph_index}
Ph_90err   : 90% error of the photon index
Epeak      : Epeak in keV
Epeak_90err: 90% error of Epeak
Norm       : normalization at 50 keV in both the PL model and CPL model
Nomr_90err : 90% error of the normalization
chi2       : Chi-Squared
dof        : degree of freedo

=== Time-averaged spectral analysis ===
(Best model with acceptable fit: CPL)

Model Ph_index Ph_90err_low Ph_90err_hi  Epeak  Epeak_90err_low  Epeak_90err_hi  Norm       Nomr_90err_low    Norm_90err_hi    chi2    dof
PL      -1.610    -0.076      0.076       -           -               -         5.22e-03     -2.33e-04          2.33e-04      74.230   57
CPL     -0.808    -0.347      0.378       70.673      -9.572        19.385      1.36e-02     -4.56e-03          7.68e-03      57.000   56


=== 1-s peak spectral analysis ===
(Best model with acceptable fit: CPL)

Model Ph_index Ph_90err_low Ph_90err_hi  Epeak  Epeak_90err_low  Epeak_90err_hi  Norm       Nomr_90err_low    Norm_90err_hi    chi2    dof
PL      -1.013     -0.095     0.097       -           -               -         2.38e-02     -1.39e-03          1.39e-03      69.190   57
CPL     -0.286     -0.406     0.449      130.199     -30.069        91.161      5.18e-02     -1.79e-02          3.04e-02      59.150   56


=== Fluence/Peak Flux Summary ===

              Model    Band1     Band2     Band3     Band4     Band5     Total
                       15-25     25-50    50-100    100-350    15-150    15-350    keV
Fluence         PL   1.83e-07  3.14e-07  4.12e-07  1.09e-06  1.21e-06  2.00e-06   erg/cm2
      90%_error_low -1.31e-08 -1.39e-08 -2.43e-08 -1.31e-07 -5.78e-08 -1.52e-07   erg/cm2
      90%_error_hi   1.33e-08  1.39e-08  2.43e-08  1.43e-07  5.81e-08  1.61e-07   erg/cm2
Peak flux       PL   6.15e-01  8.28e-01  8.20e-01  1.46e+00  2.74e+00  3.73e+00   ph/cm2/s
      90%_error_low -6.83e-02 -5.85e-02 -5.28e-02 -1.87e-01 -1.63e-01 -2.39e-01   ph/cm2/s
      90%_error_hi   7.09e-02  5.80e-02  5.25e-02  2.04e-01  1.63e-01  2.43e-01   ph/cm2/s

Fluence        CPL   1.61e-07  3.39e-07  4.19e-07  3.61e-07  1.12e-06  1.28e-06   erg/cm2
      90%_error_low -1.56e-08 -1.77e-08 -2.72e-08 -1.23e-07 -6.74e-08 -1.39e-07   erg/cm2
      90%_error_hi   1.58e-08  1.79e-08  2.71e-08  1.94e-07  6.80e-08  2.02e-07   erg/cm2
Peak flux      CPL   5.21e-01  8.73e-01  8.91e-01  7.34e-01  2.68e+00  3.02e+00   ph/cm2/s
      90%_error_low -8.26e-02 -6.67e-02 -6.57e-02 -2.16e-01 -1.66e-01 -2.71e-01   ph/cm2/s
      90%_error_hi   8.55e-02  6.77e-02  6.67e-02  3.24e-01  1.66e-01  3.45e-01   ph/cm2/s

======================================================================
Image
Pre-slew 15.0-350.0 keV image (Event data)
#   RAcent    DECcent   POSerr    Theta     Phi              Peak Cts       SNR   Name
  329.5508     5.3684   0.0048    16.5992   -97.6503         1.4821745     40.412 TRIG_00231362

Foreground time interval of the image:
 -0.992   9.533 (delta_t =  10.525 [sec])
Background time interval of the image:
-239.768  -0.992 (delta_t = 238.776 [sec])
Light Curves
Note: The mask-weighted lightcurves have units of either count/det or counts/sec/det, where a det is 0.4 x 0.4 = 0.16 sq cm.
Full-time range; 1 s binning
Other quick-look light curves:
- 64 ms binning (zoomed)
- 16 ms binning (zoomed)
- 8 ms binning (zoomed)
- 2 ms binning (zoomed)
- SN=5 or 10 s binning (full-time range)
- Raw light curve
Spectra
- 64 ms binning (zoomed)
- 16 ms binning (zoomed)
- 8 ms binning (zoomed)
- 2 ms binning (zoomed)
- SN=5 or 10 s binning (full-time range)
- Raw light curve
Spectra
Notes:
- 1) The fitting includes the systematic errors.
- 2) When the burst includes telescope slew time periods, the fitting uses an average response file made from multiple 5-s response files through out the slew time plus single time preiod for the non-slew times, and weighted by the total counts in the corresponding time period using addrmf. An average response file is needed becuase a spectral fit using the pre-slew DRM will introduce some errors in both a spectral shape and a normalization if the PHA file contains a lot of the slew/post-slew time interval.
- 3) For fits to more complicated models (e.g. a power-law over a cutoff power-law), the BAT team has decided to require a chi-square improvement of more than 6 for each extra dof.
Time averaged spectrum fit using the average DRM
Power-law model
Time interval is from   -0.992 sec. to   23.752 sec.

Spectral model in power-law:
------------------------------------------------------------
Parameters  : value       lower 90%   higher 90%
Photon index: -1.61032     ( -0.0764688   0.0759302 )
Norm@50keV  : 5.22115E-03    ( -0.000233266   0.000232534 )
------------------------------------------------------------
#Fit statistic : Chi-Squared =          74.23 using 59 PHA bins.
# Reduced chi-squared =          1.302 for     57 degrees of freedom
# Null hypothesis probability =   6.231334e-02

Photon flux (15-150 keV)    in 24.74 sec: 0.673127 ( -0.029492  0.029527 ) ph/cm2/s
Energy fluence (15-150 keV)             : 1.2067e-06 ( -5.77813e-08  5.81219e-08 ) ergs/cm2
Cutoff power-law model
Time interval is from   -0.992 sec. to   23.752 sec.
Spectral model in the cutoff power-law:
------------------------------------------------------------
Parameters  : value       lower 90%   higher 90%
Photon index: -0.808277     ( -0.346798   0.377522 )
Epeak [keV] : 70.6728      ( -9.57195 19.3853 )
Norm@50keV  : 1.36282E-02    ( -0.00455536   0.00768349 )
------------------------------------------------------------
#Fit statistic : Chi-Squared =          57.00 using 59 PHA bins.
# Reduced chi-squared =          1.018 for     56 degrees of freedom
# Null hypothesis probability =   4.377227e-01

Photon flux (15-150 keV)    in 24.74 sec: 0.644669 ( -0.031652  0.031682 ) ph/cm2/s
Energy fluence (15-150 keV)             : 1.12029e-06 ( -6.73829e-08  6.7966e-08 ) ergs/cm2
1-s peak spectrum fit
Power-law model
Time interval is from    0.216 sec. to    1.216 sec.

Spectral model in power-law:
------------------------------------------------------------
Parameters  : value       lower 90%   higher 90%
Photon index: -1.01308     ( -0.0954837   0.0967712 )
Norm@50keV  : 2.37716E-02    ( -0.00139246   0.00139166 )
------------------------------------------------------------
#Fit statistic : Chi-Squared =          69.19 using 59 PHA bins.
# Reduced chi-squared =          1.214 for     57 degrees of freedom
# Null hypothesis probability =   1.290708e-01

Photon flux (15-150 keV)    in 1 sec: 2.73878 ( -0.16266  0.16278 ) ph/cm2/s
Energy fluence (15-150 keV)             : 2.559e-07 ( -1.64251e-08  1.64955e-08 ) ergs/cm2
Cutoff power-law model
Time interval is from    0.216 sec. to    1.216 sec.
Spectral model in the cutoff power-law:
------------------------------------------------------------
Parameters  : value       lower 90%   higher 90%
Photon index: -0.285971     ( -0.406067   0.448947 )
Epeak [keV] : 130.199      ( -30.0691 91.1615 )
Norm@50keV  : 5.18132E-02    ( -0.017871   0.0304036 )
------------------------------------------------------------
#Fit statistic : Chi-Squared =          59.15 using 59 PHA bins.
# Reduced chi-squared =          1.056 for     56 degrees of freedom
# Null hypothesis probability =   3.611598e-01

Photon flux (15-150 keV)    in 1 sec: 2.67951 ( -0.16632  0.16626 ) ph/cm2/s
Energy fluence (15-150 keV)             : 2.46496e-07 ( -1.76728e-08  1.76171e-08 ) ergs/cm2
Time-resolved spectra

Distribution
T90 vs. Hardness ratio plot
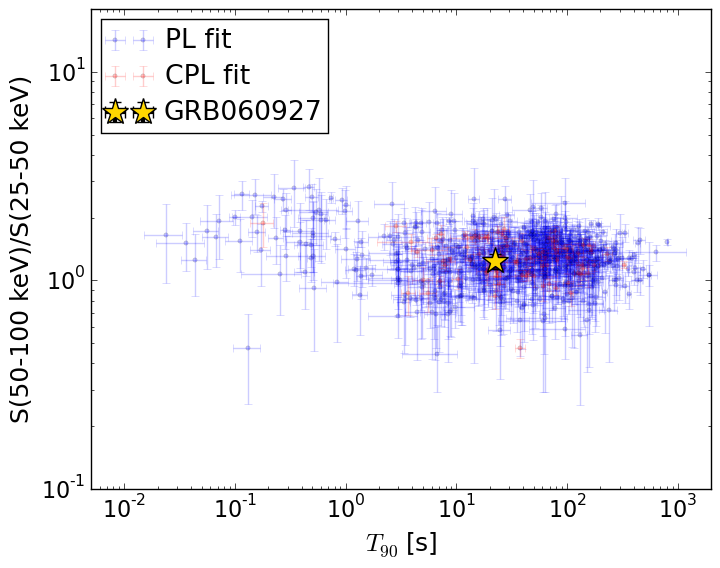
T90                                   = 22.416 sec.
Hardness ratio (energy fluence ratio) = 1.23512258264
S(15-50 keV) vs. S(50-150 keV) plot
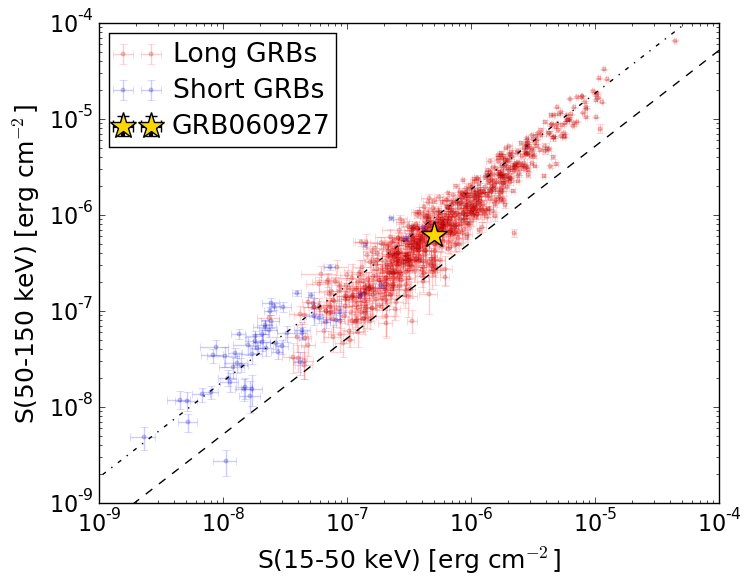
S(15-50 keV)  = 5.008854e-07
S(50-150 keV) = 6.194092e-07
The dash-dotted line and the dashed line traces the fluences calculated from the Band function with Epeak = 15 and 150 keV, respectively. Both lines assume a canonical values of alpha = -1 and beta = -2.5.
Mask shadow pattern
IMX = -3.968452576536684E-02, IMY = 2.954447692596853E-01
Spacecraft aspect plot
Bright source in the pre-burst/pre-slew/post-slew images
Pre-burst image of 15-350 keV band
Time interval of the image:
-239.768000 -0.992000

# RAcent  DECcent POSerr Theta    Phi  PeakCts   SNR AngSep     Name
#  [deg]    [deg]    ['] [deg]  [deg]                   [']
326.1422  38.3288    6.3  38.9  -38.5   0.4746   1.8    1.4	Cyg X-2
  8.3618 -42.0634    2.6  50.2  145.4   3.7509   4.5 ------	UNKNOWN
Pre-slew background subtracted image of 15-350 keV band
Time interval of the image:
-0.992000 9.532590

# RAcent  DECcent POSerr Theta    Phi  PeakCts   SNR AngSep     Name
#  [deg]    [deg]    ['] [deg]  [deg]                   [']
325.9896  38.2823    7.5  38.9  -38.7  -0.0839  -1.5    8.9	Cyg X-2
329.5508   5.3684    0.3  16.6  -97.7   1.4822  40.4 ------	UNKNOWN
Post-slew image of 15-350 keV band
Time interval of the image:
48.932600 396.232640

# RAcent  DECcent POSerr Theta    Phi  PeakCts   SNR AngSep     Name
#  [deg]    [deg]    ['] [deg]  [deg]                   [']
288.7587  11.0074    5.3  40.8  -84.1   2.2782   2.2    4.4	GRS 1915+105
299.5841  35.2092    0.4  40.7  -43.5  12.8954  31.2    0.5	Cyg X-1
308.1027  40.8073   14.7  40.3  -30.1  -0.2804  -0.8    8.7	Cyg X-3
326.0982  38.3252    5.0  33.1   -9.7   0.5575   2.3    3.5	Cyg X-2
 10.6331  38.9513    2.6  50.0   37.1   4.5022   4.4 ------	UNKNOWN
  1.6608 -25.1968    2.7  43.7  131.1   3.3321   4.4 ------	UNKNOWN
308.0902  37.6436    1.1  37.8  -33.0   3.1514  10.3 ------	UNKNOWN
288.4237  -8.3772    2.6  43.3 -113.0   4.1064   4.4 ------	UNKNOWN