Analysis Summary
Notes:
- 1) No attempt has been made to eliminate the non-significant decimal places.
- 2) This batgrbproduct analysis is done using the HEASARC data.
- 3) This batgrbproduct analysis is using the flight position for the mask-weighting calculation.
======================================================================
BAT GRB EVENT DATA PROCESSING REPORT
Process Script Ver: batgrbproduct v2.46
Process Start Time: Wed Jan 22 12:56:22 EST 2014
Host Name: batevent1
Current Working Dir: /local/data/batevent/batevent_reproc/trigger232339
======================================================================
Trigger: 00232339 Segment: 000
BAT Trigger Time: 181684232 [s; MET]
Trigger Stop: 181684233.024 [s; MET]
UTC: 2006-10-04T19:50:30.514260 [includes UTCF correction]
Where From?: TDRSS position message
BAT
RA: 97.7482318589518 Dec: -45.8937054140806 [deg; J2000]
Catalogged Source?: NO
Point Source?: YES
GRB Indicated?: YES [ by BAT flight software ]
Image S/N Ratio: 8.2
Image Trigger?: NO
Rate S/N Ratio: 13.1909059582729 [ if not an image trigger ]
Image S/N Ratio: 8.2
Analysis Position: [ source = BAT ]
RA: 97.7482318589518 Dec: -45.8937054140806 [deg; J2000]
Refined Position: [ source = BAT pre-slew burst ]
RA: 97.7899603829384 Dec: -45.9036907045942 [deg; J2000]
{ 06h 31m 09.6s , -45d 54' 13.3" }
+/- 0.853517703176131 [arcmin] (estimated 90% radius based on SNR)
+/- 0.280696740095995 [arcmin] (formal 1-sigma fit error)
SNR: 38.1404830742578
Angular difference between the analysis and refined position is 1.842531 arcmin
Partial Coding Fraction: 0.984375 [ including projection effects ]
Duration
T90: 6.25999999046326 +/- 0.649356614430661
Measured from: 0.840000003576279
to: 7.09999999403954 [s; relative to TRIGTIME]
T50: 1.91600000858307 +/- 0.266563320438603
Measured from: 2.64399999380112
to: 4.56000000238419 [s; relative to TRIGTIME]
Fluence
Peak Flux (peak 1 second)
Measured from: 2.67199999094009
to: 3.67199999094009 [s; relative to TRIGTIME]
Total Fluence
Measured from: 0.243999987840652
to: 8.11599999666214 [s; relative to TRIGTIME]
Band 1 Band 2 Band 3 Band 4
15-25 25-50 50-100 100-350 keV
Total 0.321732 0.413388 0.224682 0.050821
0.014491 0.015357 0.013277 0.010897 [error]
Peak 0.088534 0.119723 0.080566 0.025874
0.005768 0.006319 0.005547 0.004122 [error]
[ fluence units of on-axis counts / fully illuminated detector ]
======================================================================
====== Table of the duration information =============================
Value tstart tstop
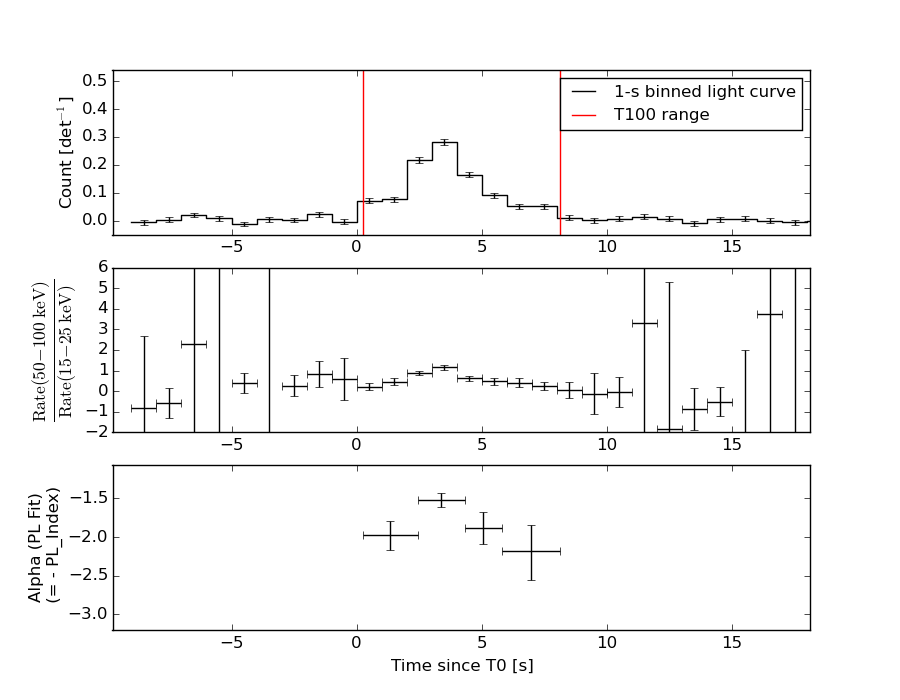
T100 7.872 0.244 8.116
T90 6.260 0.840 7.100
T50 1.916 2.644 4.560
Peak 1.000 2.672 3.672
====== Spectral Analysis Summary =====================================
Model : spectral model: simple power-law (PL) and cutoff power-law (CPL)
Ph_index : photon index: E^{Ph_index}
Ph_90err : 90% error of the photon index
Epeak : Epeak in keV
Epeak_90err: 90% error of Epeak
Norm : normalization at 50 keV in both the PL model and CPL model
Nomr_90err : 90% error of the normalization
chi2 : Chi-Squared
dof : degree of freedo
=== Time-averaged spectral analysis ===
(Best model with acceptable fit: PL)
Model Ph_index Ph_90err_low Ph_90err_hi Epeak Epeak_90err_low Epeak_90err_hi Norm Nomr_90err_low Norm_90err_hi chi2 dof
PL -1.774 -0.089 0.088 - - - 7.85e-03 -4.07e-04 4.04e-04 62.630 57
CPL -1.401 -0.363 0.403 74.243 -18.048 489.559 1.24e-02 -4.38e-03 7.81e-03 59.580 56
=== 1-s peak spectral analysis ===
(Best model with acceptable fit: PL)
Model Ph_index Ph_90err_low Ph_90err_hi Epeak Epeak_90err_low Epeak_90err_hi Norm Nomr_90err_low Norm_90err_hi chi2 dof
PL -1.596 -0.106 0.105 - - - 1.96e-02 -1.26e-03 1.25e-03 67.640 57
CPL -1.163 -0.442 0.499 90.573 -26.505 3733.197 3.34e-02 -1.37e-02 2.78e-02 64.860 56
=== Fluence/Peak Flux Summary ===
Model Band1 Band2 Band3 Band4 Band5 Total
15-25 25-50 50-100 100-350 15-150 15-350 keV
Fluence PL 1.02e-07 1.59e-07 1.86e-07 4.19e-07 5.69e-07 8.66e-07 erg/cm2
90%_error_low -7.89e-09 -7.60e-09 -1.31e-08 -5.91e-08 -3.03e-08 -7.10e-08 erg/cm2
90%_error_hi 8.07e-09 7.60e-09 1.31e-08 6.55e-08 3.06e-08 7.59e-08 erg/cm2
Peak flux PL 8.85e-01 8.41e-01 5.57e-01 5.72e-01 2.52e+00 2.85e+00 ph/cm2/s
90%_error_low -8.69e-02 -5.26e-02 -4.56e-02 -8.90e-02 -1.53e-01 -1.74e-01 ph/cm2/s
90%_error_hi 8.91e-02 5.25e-02 4.55e-02 9.86e-02 1.53e-01 1.75e-01 ph/cm2/s
Fluence CPL 9.68e-08 1.65e-07 1.86e-07 2.29e-07 5.48e-07 6.77e-07 erg/cm2
90%_error_low -9.32e-09 -9.65e-09 -1.39e-08 -9.68e-08 -3.66e-08 -1.04e-07 erg/cm2
90%_error_hi 9.45e-09 9.86e-09 1.39e-08 1.82e-07 3.66e-08 1.84e-07 erg/cm2
Peak flux CPL 8.32e-01 8.81e-01 5.69e-01 3.34e-01 2.47e+00 2.62e+00 ph/cm2/s
90%_error_low -1.02e-01 -6.66e-02 -4.91e-02 -1.38e-01 -1.61e-01 -2.18e-01 ph/cm2/s
90%_error_hi 1.04e-01 6.85e-02 4.98e-02 2.47e-01 1.60e-01 2.80e-01 ph/cm2/s
======================================================================
Image
Pre-slew 15.0-350.0 keV image (Event data)
#   RAcent    DECcent   POSerr    Theta     Phi              Peak Cts       SNR   Name
   97.7900   -45.9037   0.0050    16.5629   173.7856         1.0477228     38.140 TRIG_00232339

Foreground time interval of the image:
  0.244   8.116 (delta_t =   7.872 [sec])
Background time interval of the image:
-239.000   0.244 (delta_t = 239.244 [sec])
Light Curves
Note: The mask-weighted lightcurves have units of either count/det or counts/sec/det, where a det is 0.4 x 0.4 = 0.16 sq cm.
Full-time range; 1 s binning
Other quick-look light curves:
- 64 ms binning (zoomed)
- 16 ms binning (zoomed)
- 8 ms binning (zoomed)
- 2 ms binning (zoomed)
- SN=5 or 10 s binning (full-time range)
- Raw light curve
Spectra
- 64 ms binning (zoomed)
- 16 ms binning (zoomed)
- 8 ms binning (zoomed)
- 2 ms binning (zoomed)
- SN=5 or 10 s binning (full-time range)
- Raw light curve
Spectra
Notes:
- 1) The fitting includes the systematic errors.
- 2) When the burst includes telescope slew time periods, the fitting uses an average response file made from multiple 5-s response files through out the slew time plus single time preiod for the non-slew times, and weighted by the total counts in the corresponding time period using addrmf. An average response file is needed becuase a spectral fit using the pre-slew DRM will introduce some errors in both a spectral shape and a normalization if the PHA file contains a lot of the slew/post-slew time interval.
- 3) For fits to more complicated models (e.g. a power-law over a cutoff power-law), the BAT team has decided to require a chi-square improvement of more than 6 for each extra dof.
Time averaged spectrum fit using the average DRM
Power-law model
Time interval is from    0.244 sec. to    8.116 sec.

Spectral model in power-law:
------------------------------------------------------------
Parameters  : value       lower 90%   higher 90%
Photon index: -1.77354     ( -0.0893243   0.0881569 )
Norm@50keV  : 7.84782E-03    ( -0.000406705   0.000404009 )
------------------------------------------------------------
#Fit statistic : Chi-Squared =          62.63 using 59 PHA bins.
# Reduced chi-squared =          1.099 for     57 degrees of freedom
# Null hypothesis probability =   2.832484e-01

Photon flux (15-150 keV)    in 7.872 sec: 1.07057 ( -0.05207  0.05215 ) ph/cm2/s
Energy fluence (15-150 keV)             : 5.69436e-07 ( -3.03289e-08  3.05554e-08 ) ergs/cm2
Cutoff power-law model
Time interval is from    0.244 sec. to    8.116 sec.
Spectral model in the cutoff power-law:
------------------------------------------------------------
Parameters  : value       lower 90%   higher 90%
Photon index: -1.4009     ( -0.363485   0.402689 )
Epeak [keV] : 74.2430      ( -18.0478 489.559 )
Norm@50keV  : 1.24006E-02    ( -0.00437646   0.00781153 )
------------------------------------------------------------
#Fit statistic : Chi-Squared =          59.58 using 59 PHA bins.
# Reduced chi-squared =          1.064 for     56 degrees of freedom
# Null hypothesis probability =   3.467427e-01

Photon flux (15-150 keV)    in 7.872 sec: 1.04827 ( -0.05636  0.05629 ) ph/cm2/s
Energy fluence (15-150 keV)             : 5.4846e-07 ( -3.65957e-08  3.65521e-08 ) ergs/cm2
1-s peak spectrum fit
Power-law model
Time interval is from    2.672 sec. to    3.672 sec.

Spectral model in power-law:
------------------------------------------------------------
Parameters  : value       lower 90%   higher 90%
Photon index: -1.59616     ( -0.105902   0.104673 )
Norm@50keV  : 1.96029E-02    ( -0.00125576   0.00124823 )
------------------------------------------------------------
#Fit statistic : Chi-Squared =          67.64 using 59 PHA bins.
# Reduced chi-squared =          1.187 for     57 degrees of freedom
# Null hypothesis probability =   1.581685e-01

Photon flux (15-150 keV)    in 1 sec: 2.51616 ( -0.15341  0.1535 ) ph/cm2/s
Energy fluence (15-150 keV)             : 1.83443e-07 ( -1.26618e-08  1.27575e-08 ) ergs/cm2
Cutoff power-law model
Time interval is from    2.672 sec. to    3.672 sec.
Spectral model in the cutoff power-law:
------------------------------------------------------------
Parameters  : value       lower 90%   higher 90%
Photon index: -1.1631     ( -0.441688   0.498853 )
Epeak [keV] : 90.5732      ( -26.5305 3733.17 )
Norm@50keV  : 3.33833E-02    ( -0.0136438   0.0277617 )
------------------------------------------------------------
#Fit statistic : Chi-Squared =          64.86 using 59 PHA bins.
# Reduced chi-squared =          1.158 for     56 degrees of freedom
# Null hypothesis probability =   1.951216e-01

Photon flux (15-150 keV)    in 1 sec: 2.47155 ( -0.16079  0.16005 ) ph/cm2/s
Energy fluence (15-150 keV)             : 1.7623e-07 ( -1.47941e-08  1.47377e-08 ) ergs/cm2
Time-resolved spectra
Distribution
T90 vs. Hardness ratio plot
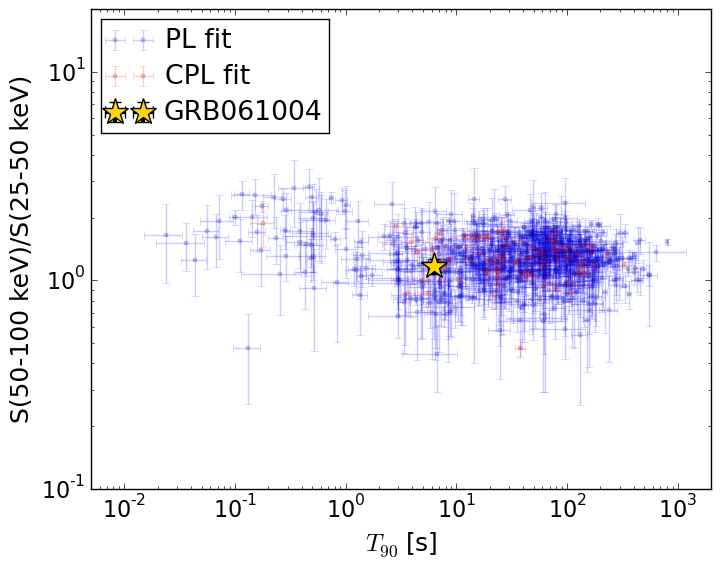
T90                                   = 6.26 sec.
Hardness ratio (energy fluence ratio) = 1.17001132069
S(15-50 keV) vs. S(50-150 keV) plot
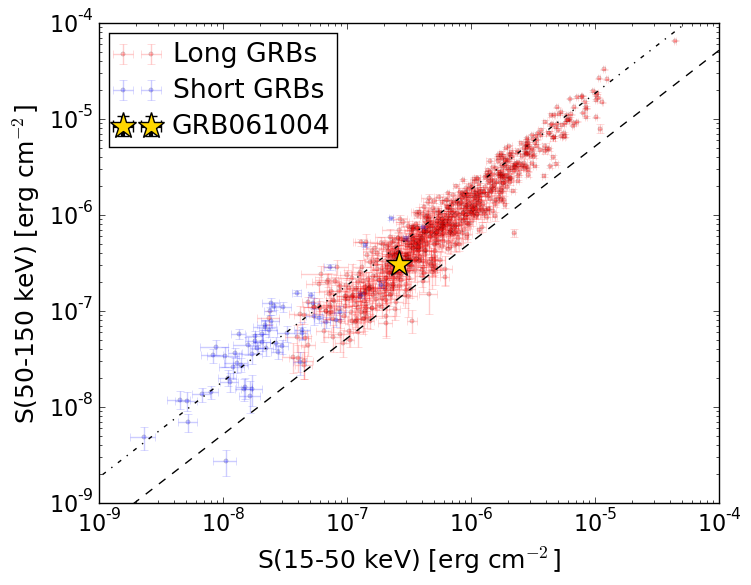
S(15-50 keV)  = 2.607723e-07
S(50-150 keV) = 3.08669e-07
The dash-dotted line and the dashed line traces the fluences calculated from the Band function with Epeak = 15 and 150 keV, respectively. Both lines assume a canonical values of alpha = -1 and beta = -2.5.
Mask shadow pattern
IMX = -2.956600595998222E-01, IMY = -3.219439490819969E-02
Spacecraft aspect plot
Bright source in the pre-burst/pre-slew/post-slew images
Pre-burst image of 15-350 keV band
Time interval of the image:
-239.000000 0.244000

# RAcent  DECcent POSerr Theta    Phi  PeakCts   SNR AngSep     Name
#  [deg]    [deg]    ['] [deg]  [deg]                   [']
135.4840 -40.5624    2.4  32.3 -125.8   1.1421   4.7    2.1	Vela X-1
170.4363 -60.6019    5.2  33.9  -70.7  -0.6100  -2.2    3.8	Cen X-3
186.6933 -62.8212    2.3  38.4  -59.6   1.7265   4.9    3.2	GX 301-2
344.6761 -55.0981    3.5  50.7   31.5   2.6844   3.3 ------	UNKNOWN
 71.5396 -26.6783    2.4  39.0  132.8   1.8365   4.9 ------	UNKNOWN
319.3029 -69.9762    2.2  44.1    7.7   1.5825   5.2 ------	UNKNOWN
134.7878 -16.0016    3.7  54.0 -143.2   3.3072   3.2 ------	UNKNOWN
Pre-slew background subtracted image of 15-350 keV band
Time interval of the image:
0.244000 8.116000

# RAcent  DECcent POSerr Theta    Phi  PeakCts   SNR AngSep     Name
#  [deg]    [deg]    ['] [deg]  [deg]                   [']
135.2974 -40.4637   20.7  32.3 -126.1   0.0229   0.6   11.9	Vela X-1
170.4676 -60.7479    4.9  33.8  -70.5   0.1182   2.3    8.7	Cen X-3
186.8109 -62.6861    3.7  38.6  -59.7  -0.1823  -3.1    6.6	GX 301-2
352.3584 -60.6514    2.5  43.8   31.3   0.3103   4.6 ------	UNKNOWN
 97.7905 -45.9037    0.3  16.6  173.8   1.0476  38.1 ------	UNKNOWN
Post-slew image of 15-350 keV band
Time interval of the image:
49.300600 963.080000

# RAcent  DECcent POSerr Theta    Phi  PeakCts   SNR AngSep     Name
#  [deg]    [deg]    ['] [deg]  [deg]                   [']
135.5122 -40.5575    1.6  27.8  -92.5   4.4139   7.1    0.8	Vela X-1
170.4072 -60.6195   30.6  43.3  -48.1   0.4999   0.4    2.7	Cen X-3
186.9051 -62.9440   35.3  49.9  -41.6  -0.6777  -0.3   12.4	GX 301-2
 53.4305 -27.4422    2.5  39.4   97.2   6.2359   4.7 ------	UNKNOWN
 75.9149  -3.5267    3.4  46.5  144.1   4.8556   3.4 ------	UNKNOWN
 30.7865 -82.5624    2.9  41.6    5.2   2.6167   4.0 ------	UNKNOWN
270.6637 -76.9485    4.1  57.1   -7.0   5.0353   2.8 ------	UNKNOWN
213.9254 -68.3778    4.4  56.3  -28.5   7.0585   2.6 ------	UNKNOWN
134.2118  -5.8660    3.7  50.9 -135.5   7.3086   3.1 ------	UNKNOWN