Analysis Summary
Notes:
- 1) No attempt has been made to eliminate the non-significant decimal places.
- 2) This batgrbproduct analysis is done using the HEASARC data.
- 3) This batgrbproduct analysis is using the flight position for the mask-weighting calculation.
======================================================================
BAT GRB EVENT DATA PROCESSING REPORT
Process Script Ver: batgrbproduct v2.46
Process Start Time: Wed Jan 22 12:45:32 EST 2014
Host Name: batevent1
Current Working Dir: /local/data/batevent/batevent_reproc/trigger232683
======================================================================
Trigger: 00232683 Segment: 000
BAT Trigger Time: 181908490.304 [s; MET]
Trigger Stop: 181908491.328 [s; MET]
UTC: 2006-10-07T10:08:08.812840 [includes UTCF correction]
Where From?: TDRSS position message
BAT
RA: 46.3175910410402 Dec: -50.4878550139145 [deg; J2000]
Catalogged Source?: NO
Point Source?: YES
GRB Indicated?: YES [ by BAT flight software ]
Image S/N Ratio: 15.62
Image Trigger?: NO
Rate S/N Ratio: 73.1846978541279 [ if not an image trigger ]
Image S/N Ratio: 15.62
Analysis Position: [ source = BAT ]
RA: 46.3175910410402 Dec: -50.4878550139145 [deg; J2000]
Refined Position: [ source = BAT pre-slew burst ]
RA: 46.3058254064013 Dec: -50.4948031374968 [deg; J2000]
{ 03h 05m 13.4s , -50d 29' 41.3" }
+/- 0.901511405342841 [arcmin] (estimated 90% radius based on SNR)
+/- 0.268897257817658 [arcmin] (formal 1-sigma fit error)
SNR: 35.2732276025779
Angular difference between the analysis and refined position is 0.612780 arcmin
Partial Coding Fraction: 0.1953125 [ including projection effects ]
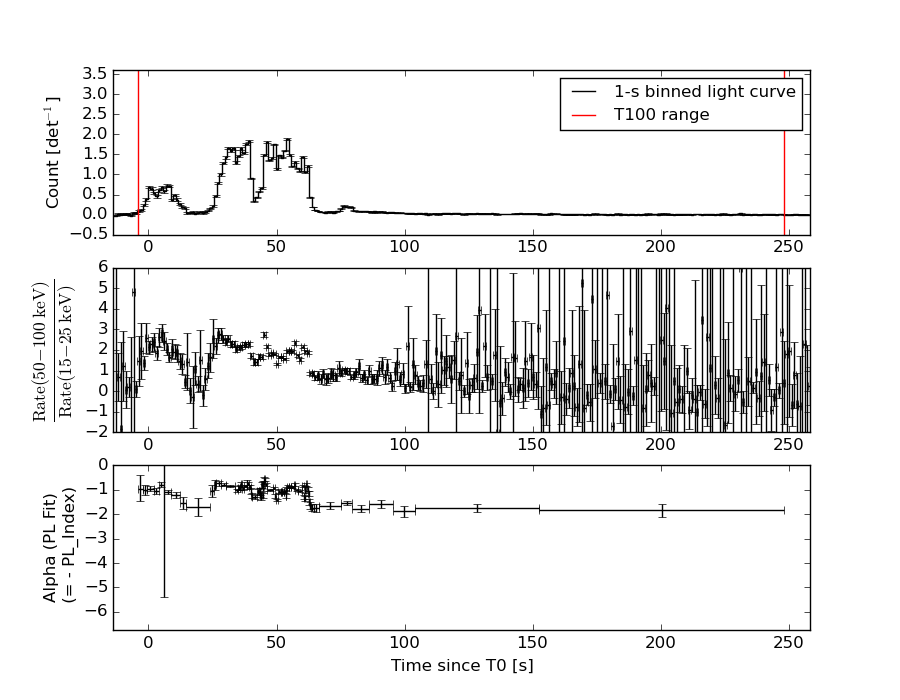
Duration
T90: 75.7360000014305 +/- 2.48255352208967
Measured from: 3.62800002098083
to: 79.3640000224113 [s; relative to TRIGTIME]
T50: 23.0160000026226 +/- 0.198715875951865
Measured from: 31.5600000023842
to: 54.5760000050068 [s; relative to TRIGTIME]
Fluence
Peak Flux (peak 1 second)
Measured from: 45.1440000236034
to: 46.1440000236034 [s; relative to TRIGTIME]
Total Fluence
Measured from: -4.05599999427795
to: 248.288000017405 [s; relative to TRIGTIME]
Band 1 Band 2 Band 3 Band 4
15-25 25-50 50-100 100-350 keV
Total 12.075275 20.561754 21.858439 8.008755
0.112736 0.129654 0.129900 0.108045 [error]
Peak 0.292306 0.587193 0.773372 0.327645
0.009468 0.012733 0.015156 0.012774 [error]
[ fluence units of on-axis counts / fully illuminated detector ]
======================================================================
====== Table of the duration information =============================
Value tstart tstop
T100 252.344 -4.056 248.288
T90 75.736 3.628 79.364
T50 23.016 31.560 54.576
Peak 1.000 45.144 46.144
====== Spectral Analysis Summary =====================================
Model : spectral model: simple power-law (PL) and cutoff power-law (CPL)
Ph_index : photon index: E^{Ph_index}
Ph_90err : 90% error of the photon index
Epeak : Epeak in keV
Epeak_90err: 90% error of Epeak
Norm : normalization at 50 keV in both the PL model and CPL model
Nomr_90err : 90% error of the normalization
chi2 : Chi-Squared
dof : degree of freedo
=== Time-averaged spectral analysis ===
(Best model with acceptable fit: PL)
Model Ph_index Ph_90err_low Ph_90err_hi Epeak Epeak_90err_low Epeak_90err_hi Norm Nomr_90err_low Norm_90err_hi chi2 dof
PL -1.020 -0.023 0.023 - - - 1.66e-02 -2.28e-04 2.28e-04 27.930 57
CPL -1.014 -0.023 0.047 9997.890 -9997.890 -9997.890 1.67e-02 -2.11e-04 6.52e-04 28.270 56
=== 1-s peak spectral analysis ===
(Best model with acceptable fit: N/A)
Model Ph_index Ph_90err_low Ph_90err_hi Epeak Epeak_90err_low Epeak_90err_hi Norm Nomr_90err_low Norm_90err_hi chi2 dof
PL -0.684 -0.046 0.046 - - - 1.27e-01 -3.22e-03 3.21e-03 43.400 57
CPL -0.595 -0.104 0.096 993.487 -993.487 -993.487 1.38e-01 -1.30e-02 6.63e-03 44.800 56
=== Fluence/Peak Flux Summary ===
Model Band1 Band2 Band3 Band4 Band5 Total
15-25 25-50 50-100 100-350 15-150 15-350 keV
Fluence PL 3.42e-06 8.44e-06 1.66e-05 8.15e-05 4.50e-05 1.10e-04 erg/cm2
90%_error_low -1.05e-07 -1.56e-07 -1.99e-07 -2.35e-06 -5.32e-07 -2.35e-06 erg/cm2
90%_error_hi 1.07e-07 1.56e-07 1.99e-07 2.40e-06 5.31e-07 2.39e-06 erg/cm2
Peak flux PL 1.69e-03 2.10e-02 2.14e-01 2.07e+01 9.64e-01 2.07e+01 ph/cm2/s
90%_error_low N/A N/A N/A N/A N/A N/A ph/cm2/s
90%_error_hi N/A N/A N/A N/A N/A N/A ph/cm2/s
Fluence CPL 3.41e-06 8.44e-06 1.67e-05 8.09e-05 4.50e-05 1.09e-04 erg/cm2
90%_error_low N/A -1.56e-07 N/A N/A -5.31e-07 N/A erg/cm2
90%_error_hi N/A 1.56e-07 N/A N/A 5.30e-07 N/A erg/cm2
Peak flux CPL 2.43e+00 3.96e+00 4.93e+00 1.25e+01 1.47e+01 2.33e+01 ph/cm2/s
90%_error_low -1.64e-01 -1.25e-01 -1.22e-01 -1.25e+00 -4.01e-01 -8.12e-01 ph/cm2/s
90%_error_hi 1.12e-01 1.23e-01 1.40e-01 -7.22e-02 3.73e-01 6.84e-01 ph/cm2/s
======================================================================
Image
Pre-slew 15.0-350.0 keV image (Event data)
#   RAcent    DECcent   POSerr    Theta     Phi              Peak Cts       SNR   Name
   46.3058   -50.4948   0.0054    36.0550   109.7556         8.4119131     35.273 TRIG_00232683

Foreground time interval of the image:
 -4.056  14.797 (delta_t =  18.853 [sec])
Background time interval of the image:
-35.403  -4.056 (delta_t =  31.347 [sec])
Light Curves
Note: The mask-weighted lightcurves have units of either count/det or counts/sec/det, where a det is 0.4 x 0.4 = 0.16 sq cm.
Full-time range; 1 s binning
Other quick-look light curves:
- 64 ms binning (zoomed)
- 16 ms binning (zoomed)
- 8 ms binning (zoomed)
- 2 ms binning (zoomed)
- SN=5 or 10 s binning (full-time range)
- Raw light curve
Spectra
- 64 ms binning (zoomed)
- 16 ms binning (zoomed)
- 8 ms binning (zoomed)
- 2 ms binning (zoomed)
- SN=5 or 10 s binning (full-time range)
- Raw light curve
Spectra
Notes:
- 1) The fitting includes the systematic errors.
- 2) When the burst includes telescope slew time periods, the fitting uses an average response file made from multiple 5-s response files through out the slew time plus single time preiod for the non-slew times, and weighted by the total counts in the corresponding time period using addrmf. An average response file is needed becuase a spectral fit using the pre-slew DRM will introduce some errors in both a spectral shape and a normalization if the PHA file contains a lot of the slew/post-slew time interval.
- 3) For fits to more complicated models (e.g. a power-law over a cutoff power-law), the BAT team has decided to require a chi-square improvement of more than 6 for each extra dof.
Time averaged spectrum fit using the average DRM
Power-law model
Time interval is from   -4.056 sec. to  248.288 sec.

Spectral model in power-law:
------------------------------------------------------------
Parameters  : value       lower 90%   higher 90%
Photon index: -1.02025     ( -0.0232508   0.0233575 )
Norm@50keV  : 1.66048E-02    ( -0.000228442   0.000227482 )
------------------------------------------------------------
#Fit statistic : Chi-Squared =          27.93 using 59 PHA bins.
# Reduced chi-squared =         0.4899 for     57 degrees of freedom
# Null hypothesis probability =   9.995803e-01

Photon flux (15-150 keV)    in 252.3 sec: 1.91391 ( -0.0277  0.02784 ) ph/cm2/s
Energy fluence (15-150 keV)             : 4.49861e-05 ( -5.32467e-07  5.31281e-07 ) ergs/cm2
Cutoff power-law model
Time interval is from   -4.056 sec. to  248.288 sec.
Spectral model in the cutoff power-law:
------------------------------------------------------------
Parameters  : value       lower 90%   higher 90%
Photon index: -1.01355     ( -0.0234432   0.0473298 )
Epeak [keV] : 9997.89      ( -9998.2 -9998.2 )
Norm@50keV  : 1.66998E-02    ( -0.000210801   0.000652384 )
------------------------------------------------------------
#Fit statistic : Chi-Squared =          28.27 using 59 PHA bins.
# Reduced chi-squared =         0.5048 for     56 degrees of freedom
# Null hypothesis probability =   9.992693e-01

Photon flux (15-150 keV)    in 252.3 sec: 1.91293 (    ) ph/cm2/s
Energy fluence (15-150 keV)             : 4.49798e-05 ( -5.31278e-07  5.30251e-07 ) ergs/cm2
1-s peak spectrum fit
Power-law model
Time interval is from   45.144 sec. to   46.144 sec.

Spectral model in power-law:
------------------------------------------------------------
Parameters  : value       lower 90%   higher 90%
Photon index: -0.684462     ( -0.0460264   0.0463159 )
Norm@50keV  : 0.127101    ( -0.00322189   0.00320638 )
------------------------------------------------------------
#Fit statistic : Chi-Squared =          43.40 using 59 PHA bins.
# Reduced chi-squared =         0.7614 for     57 degrees of freedom
# Null hypothesis probability =   9.079452e-01

Photon flux (15-150 keV)    in 1 sec: 0.964414 (    ) ph/cm2/s
Energy fluence (15-150 keV)             : 1.56257e-06 ( -4.17423e-08  4.17833e-08 ) ergs/cm2
Cutoff power-law model
Time interval is from   45.144 sec. to   46.144 sec.
Spectral model in the cutoff power-law:
------------------------------------------------------------
Parameters  : value       lower 90%   higher 90%
Photon index: -0.676081     ( -0.103495   0.0955801 )
Epeak [keV] : 9997.06      ( -9997.25 -9997.25 )
Norm@50keV  : 0.128087    ( -0.00304655   0.0165454 )
------------------------------------------------------------
#Fit statistic : Chi-Squared =          43.47 using 59 PHA bins.
# Reduced chi-squared =         0.7762 for     56 degrees of freedom
# Null hypothesis probability =   8.891009e-01

Photon flux (15-150 keV)    in 1 sec: 14.7176 ( -0.4006  0.3728 ) ph/cm2/s
Energy fluence (15-150 keV)             : 1.56426e-06 ( -4.75938e-08  4.34214e-08 ) ergs/cm2
Time-resolved spectra
Distribution
T90 vs. Hardness ratio plot
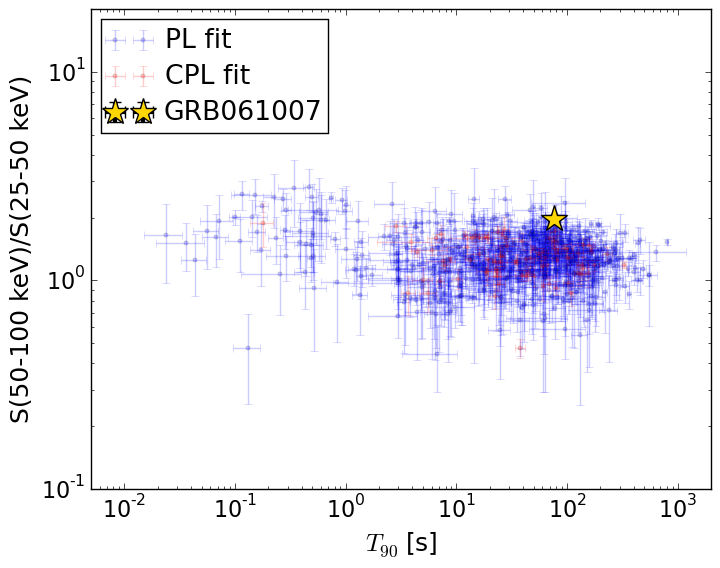
T90                                   = 75.736 sec.
Hardness ratio (energy fluence ratio) = 1.97215018197
S(15-50 keV) vs. S(50-150 keV) plot
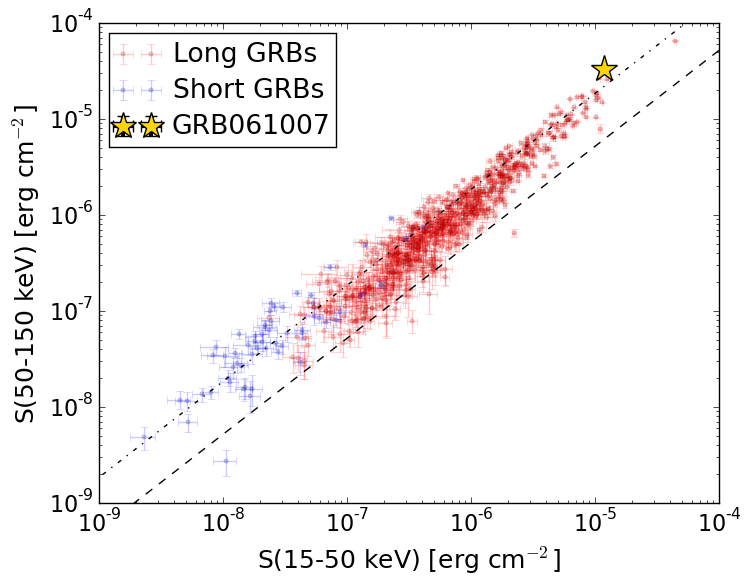
S(15-50 keV)  = 1.1862198e-05
S(50-150 keV) = 3.312366e-05
The dash-dotted line and the dashed line traces the fluences calculated from the Band function with Epeak = 15 and 150 keV, respectively. Both lines assume a canonical values of alpha = -1 and beta = -2.5.
Mask shadow pattern
IMX = -2.460731369944117E-01, IMY = -6.851610378352506E-01
Spacecraft aspect plot
Bright source in the pre-burst/pre-slew/post-slew images
Pre-burst image of 15-350 keV band
Time interval of the image:
-35.403400 -4.056000

# RAcent  DECcent POSerr Theta    Phi  PeakCts   SNR AngSep     Name
#  [deg]    [deg]    ['] [deg]  [deg]                   [']
135.8050 -40.6144    0.0  39.8 -142.5  -0.1772  -2.1   13.1	Vela X-1
170.4489 -60.8005    3.2  25.3  -93.1   0.2376   3.6   11.3	Cen X-3
186.9068 -62.9431    0.0  26.4  -74.8   0.0144   0.2   12.4	GX 301-2
264.7078 -44.5086    5.4  55.3  -14.9   0.3970   2.1    3.8	4U 1735-44
 92.0664 -37.4541    2.0  42.5  165.2   0.5243   5.8 ------	UNKNOWN
291.2513 -53.4222    2.3  47.4    7.9   0.5786   5.1 ------	UNKNOWN
145.2024 -56.2181    1.7  25.5 -125.8   0.4179   6.9 ------	UNKNOWN
Pre-slew background subtracted image of 15-350 keV band
Time interval of the image:
-4.056000 14.796600

# RAcent  DECcent POSerr Theta    Phi  PeakCts   SNR AngSep     Name
#  [deg]    [deg]    ['] [deg]  [deg]                   [']
135.4501 -40.6888   25.6  39.7 -142.9   0.0381   0.4    8.8	Vela X-1
170.4342 -60.8155    0.0  25.3  -93.1  -0.1454  -2.0   12.1	Cen X-3
186.9121 -62.6405   14.6  26.7  -75.1  -0.0580  -0.8   10.5	GX 301-2
264.6212 -44.4497   11.4  55.4  -14.9   0.2156   1.0    5.2	4U 1735-44
 46.3058 -50.4948    0.3  36.1  109.8   8.4113  35.3 ------	UNKNOWN
289.7856 -44.3441    2.4  56.4    6.7   2.1607   4.9 ------	UNKNOWN
179.4233 -69.0770    3.1  19.6  -74.4   0.2299   3.7 ------	UNKNOWN
135.2909 -25.1401    3.4  55.1 -145.3   1.0194   3.4 ------	UNKNOWN
153.8824 -36.8515    1.8  45.6 -122.7   1.4963   6.3 ------	UNKNOWN
Post-slew image of 15-350 keV band
Time interval of the image:
69.796600 962.772000

# RAcent  DECcent POSerr Theta    Phi  PeakCts   SNR AngSep     Name
#  [deg]    [deg]    ['] [deg]  [deg]                   [']
 46.3208 -50.4866    0.6   0.0  113.3   6.9142  18.0 ------	UNKNOWN
 54.0792 -70.8733    3.5  20.7  -59.2   1.3857   3.2 ------	UNKNOWN