Analysis Summary
Notes:
- 1) No attempt has been made to eliminate the non-significant decimal places.
- 2) This batgrbproduct analysis is done using the HEASARC data.
- 3) This batgrbproduct analysis is using the flight position for the mask-weighting calculation.
======================================================================
                  BAT GRB EVENT DATA PROCESSING REPORT
    Process Script Ver: batgrbproduct v2.46
    Process Start Time: Thu Sep 11 15:34:47 EDT 2014
             Host Name: batevent1
   Current Working Dir: /local/data/batevent/batevent_reproc/trigger234905
======================================================================

  Trigger: 00234905      Segment: 000

  BAT Trigger Time: 183137949.184   [s; MET]
      Trigger Stop: 183137950.208   [s; MET]
               UTC: 2006-10-21T15:39:07.663300    [includes UTCF correction]
       Where From?: TDRSS position message

  BAT
    RA: 145.134075795178   Dec: -21.9284421197878  [deg; J2000]

     Catalogged Source?: NO
     Point Source?:      YES
     GRB Indicated?:     YES    [ by BAT flight software ]
     Image S/N Ratio:    9.12
     Image Trigger?:     NO
     Rate S/N Ratio:     19.313207915828  [ if not an image trigger ]
     Image S/N Ratio:    9.12

  Analysis Position:   [ source = BAT ]
    RA: 145.134075795178   Dec: -21.9284421197878  [deg; J2000]

  Refined Position:   [ source = BAT pre-slew burst ]
    RA: 145.148793923512   Dec: -21.9537581305796  [deg; J2000]
        { 09h 40m 35.7s , -21d 57' 13.5" }
         +/- 0.623033480857319 [arcmin] (estimated 90% radius based on SNR)
         +/- 0.200341417891382 [arcmin] (formal 1-sigma fit error)
    SNR: 59.7961941635248

  Angular difference between the analysis and refined position is 1.725748 arcmin

  Partial Coding Fraction: 0.6484375    [ including projection effects ]

  Duration
     T90: 47.8200000226498 +/- 5.63259405640524
        Measured from: 1.57600000500679
                   to: 49.3960000276566     [s; relative to TRIGTIME]
     T50: 10.7639999985695 +/- 1.27006771456351
        Measured from: 3.15200001001358
                   to: 13.9160000085831     [s; relative to TRIGTIME]


  Fluence
     Peak Flux  (peak 1 second)
        Measured from: 2.4360000193119
                   to: 3.4360000193119     [s; relative to TRIGTIME]
     Total Fluence
        Measured from: -0.00799998641014099
                   to: 64.9600000083447     [s; relative to TRIGTIME]

             Band 1     Band 2     Band 3     Band 4
              15-25      25-50     50-100    100-350     keV
 Total     1.074427   1.603145   1.415414   0.397512
           0.043679   0.046106   0.041201   0.034723 [error]
 Peak      0.159571   0.277796   0.247144   0.094189
           0.008468   0.010193   0.010130   0.008177 [error]

     [ fluence units of on-axis counts / fully illuminated detector ]

======================================================================


====== Table of the duration information =============================

        Value   tstart    tstop
T100   64.968   -0.008   64.960
T90    47.820    1.576   49.396
T50    10.764    3.152   13.916
Peak    1.000    2.436    3.436


====== Spectral Analysis Summary =====================================

Model      : spectral model: simple power-law (PL) and cutoff power-law (CPL)
Ph_index   : photon index: E^{Ph_index}
Ph_90err   : 90% error of the photon index
Epeak      : Epeak in keV
Epeak_90err: 90% error of Epeak
Norm       : normalization at 50 keV in both the PL model and CPL model
Nomr_90err : 90% error of the normalization
chi2       : Chi-Squared
dof        : degree of freedo

=== Time-averaged spectral analysis ===
(Best model with acceptable fit: PL)

Model Ph_index Ph_90err_low Ph_90err_hi  Epeak  Epeak_90err_low  Epeak_90err_hi  Norm       Nomr_90err_low    Norm_90err_hi    chi2    dof
PL      -1.282    -0.061      0.062       -           -               -         4.67e-03     -1.50e-04          1.50e-04      40.540   57
CPL     -1.269    -0.074      0.194     9973.470    -9973.470      -9973.470      4.74e-03     -1.93e-04          1.08e-04      40.860   56


=== 1-s peak spectral analysis ===
(Best model with acceptable fit: PL)

Model Ph_index Ph_90err_low Ph_90err_hi  Epeak  Epeak_90err_low  Epeak_90err_hi  Norm       Nomr_90err_low    Norm_90err_hi    chi2    dof
PL      -1.134     -0.077     0.078       -           -               -         5.26e-02     -2.16e-03          2.16e-03      68.950   57
CPL     -1.134     -0.073     0.083     9999.360    -9999.360      -9999.360      5.28e-02     -2.17e-03          2.17e-03      69.070   56


=== Fluence/Peak Flux Summary ===

              Model    Band1     Band2     Band3     Band4     Band5     Total
                       15-25     25-50    50-100    100-350    15-150    15-350    keV
Fluence         PL   3.16e-07  6.64e-07  1.09e-06  4.06e-06  3.01e-06  6.13e-06   erg/cm2
      90%_error_low -2.12e-08 -2.59e-08 -4.17e-08 -3.55e-07 -1.04e-07 -3.76e-07   erg/cm2
      90%_error_hi   2.17e-08  2.58e-08  4.16e-08  3.79e-07  1.04e-07  3.96e-07   erg/cm2
Peak flux       PL   1.52e+00  1.91e+00  1.74e+00  2.76e+00  6.12e+00  7.94e+00   ph/cm2/s
      90%_error_low -1.29e-01 -9.60e-02 -8.40e-02 -2.86e-01 -2.59e-01 -3.56e-01   ph/cm2/s
      90%_error_hi   1.32e-01  9.53e-02  8.34e-02  3.08e-01  2.59e-01  3.61e-01   ph/cm2/s

Fluence        CPL   3.19e-07  6.64e-07  1.09e-06  4.21e-06  3.02e-06  6.20e-06   erg/cm2
      90%_error_low    N/A    -2.64e-08 -4.93e-08 -1.16e-06    N/A    -1.39e-06   erg/cm2
      90%_error_hi     N/A     2.65e-08  6.09e-08  -1.68e-07    N/A     1.97e-07   erg/cm2
Peak flux      CPL   1.52e+00  1.90e+00  1.74e+00  2.95e+00  6.15e+00  8.12e+00   ph/cm2/s
      90%_error_low -1.29e-01 -8.63e-02 -8.40e-02     N/A   -2.94e-01 -6.41e-01   ph/cm2/s
      90%_error_hi   1.32e-01  1.05e-01  8.36e-02     N/A    2.23e-01  1.23e-01   ph/cm2/s

======================================================================
Image
Pre-slew 15.0-350.0 keV image (Event data)
#   RAcent    DECcent   POSerr    Theta     Phi              Peak Cts       SNR   Name
  145.1488   -21.9538   0.0032    25.2554   -62.4924         3.2401347     59.796 TRIG_00234905

Foreground time interval of the image:
 -0.008  10.517 (delta_t =  10.525 [sec])
Background time interval of the image:
-239.184  -0.008 (delta_t = 239.176 [sec])
Light Curves
Note: The mask-weighted lightcurves have units of either count/det or counts/sec/det, where a det is 0.4 x 0.4 = 0.16 sq cm.
Full-time range; 1 s binning
Other quick-look light curves:
- 64 ms binning (zoomed)
- 16 ms binning (zoomed)
- 8 ms binning (zoomed)
- 2 ms binning (zoomed)
- SN=5 or 10 s binning (full-time range)
- Raw light curve
Spectra
- 64 ms binning (zoomed)
- 16 ms binning (zoomed)
- 8 ms binning (zoomed)
- 2 ms binning (zoomed)
- SN=5 or 10 s binning (full-time range)
- Raw light curve
Spectra
Notes:
- 1) The fitting includes the systematic errors.
- 2) When the burst includes telescope slew time periods, the fitting uses an average response file made from multiple 5-s response files through out the slew time plus single time preiod for the non-slew times, and weighted by the total counts in the corresponding time period using addrmf. An average response file is needed becuase a spectral fit using the pre-slew DRM will introduce some errors in both a spectral shape and a normalization if the PHA file contains a lot of the slew/post-slew time interval.
- 3) For fits to more complicated models (e.g. a power-law over a cutoff power-law), the BAT team has decided to require a chi-square improvement of more than 6 for each extra dof.
Time averaged spectrum fit using the average DRM
Power-law model
Time interval is from   -0.008 sec. to   64.960 sec.

Spectral model in power-law:
------------------------------------------------------------
Parameters  : value       lower 90%   higher 90%
Photon index: -1.2825     ( -0.0613626   0.0616236 )
Norm@50keV  : 4.67405E-03    ( -0.000150323   0.000150272 )
------------------------------------------------------------
#Fit statistic : Chi-Squared =          40.54 using 59 PHA bins.
# Reduced chi-squared =         0.7113 for     57 degrees of freedom
# Null hypothesis probability =   9.512246e-01

Photon flux (15-150 keV)    in 64.97 sec: 0.555874 ( -0.019268  0.019338 ) ph/cm2/s
Energy fluence (15-150 keV)             : 3.01421e-06 ( -1.04139e-07  1.04346e-07 ) ergs/cm2
Cutoff power-law model
Time interval is from   -0.008 sec. to   64.960 sec.
Spectral model in the cutoff power-law:
------------------------------------------------------------
Parameters  : value       lower 90%   higher 90%
Photon index: -1.27847     ( -0.0636875   0.204697 )
Epeak [keV] : 1.00000E+04      ( -10000 -10000 )
Norm@50keV  : 4.69397E-03    ( -0.000150534   0.000150497 )
------------------------------------------------------------
#Fit statistic : Chi-Squared =          40.56 using 59 PHA bins.
# Reduced chi-squared =         0.7244 for     56 degrees of freedom
# Null hypothesis probability =   9.399984e-01

Photon flux (15-150 keV)    in 64.97 sec: 0.557284 ( -0.026154  0.022172 ) ph/cm2/s
Energy fluence (15-150 keV)             : 3.02157e-06 ( 0  0 ) ergs/cm2
1-s peak spectrum fit
Power-law model
Time interval is from    2.436 sec. to    3.436 sec.

Spectral model in power-law:
------------------------------------------------------------
Parameters  : value       lower 90%   higher 90%
Photon index: -1.13396     ( -0.0773161   0.0777252 )
Norm@50keV  : 5.25598E-02    ( -0.00216087   0.00216066 )
------------------------------------------------------------
#Fit statistic : Chi-Squared =          68.95 using 59 PHA bins.
# Reduced chi-squared =          1.210 for     57 degrees of freedom
# Null hypothesis probability =   1.332620e-01

Photon flux (15-150 keV)    in 1 sec: 6.11823 ( -0.25857  0.259 ) ph/cm2/s
Energy fluence (15-150 keV)             : 5.43776e-07 ( -2.5382e-08  2.54831e-08 ) ergs/cm2
Cutoff power-law model
Time interval is from    2.436 sec. to    3.436 sec.
Spectral model in the cutoff power-law:
------------------------------------------------------------
Parameters  : value       lower 90%   higher 90%
Photon index: -1.13441     ( -0.0732845   0.083104 )
Epeak [keV] : 9999.36      ( -9999.36 -9999.36 )
Norm@50keV  : 5.28306E-02    ( -0.0021703   0.00217115 )
------------------------------------------------------------
#Fit statistic : Chi-Squared =          69.07 using 59 PHA bins.
# Reduced chi-squared =          1.233 for     56 degrees of freedom
# Null hypothesis probability =   1.127022e-01

Photon flux (15-150 keV)    in 1 sec: 6.15230 ( -0.29423  0.22329 ) ph/cm2/s
Energy fluence (15-150 keV)             : 5.43551e-07 ( -2.53837e-08  2.54329e-08 ) ergs/cm2
Time-resolved spectra
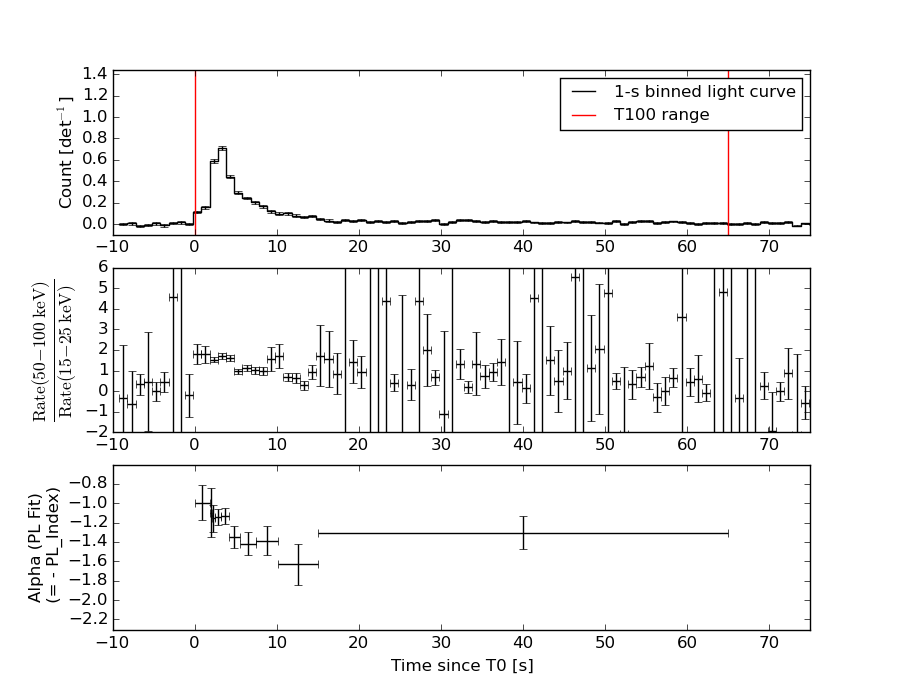
Distribution
T90 vs. Hardness ratio plot
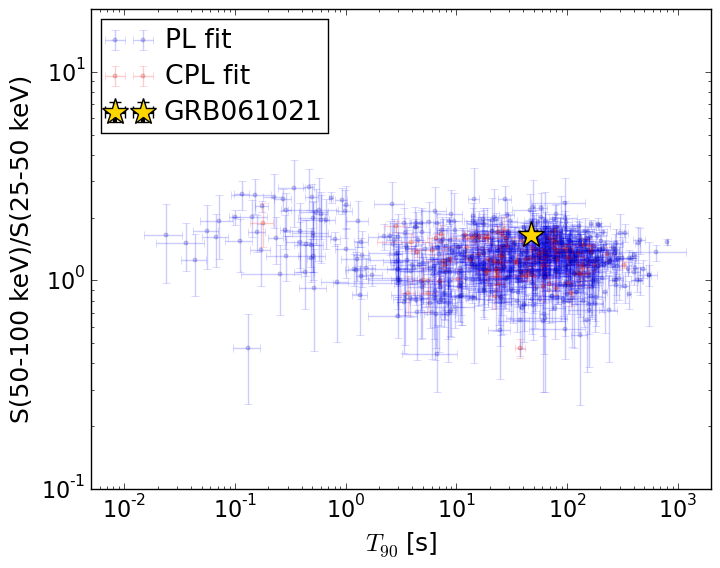
T90                                   = 47.82 sec.
Hardness ratio (energy fluence ratio) = 1.64437268782
S(15-50 keV) vs. S(50-150 keV) plot
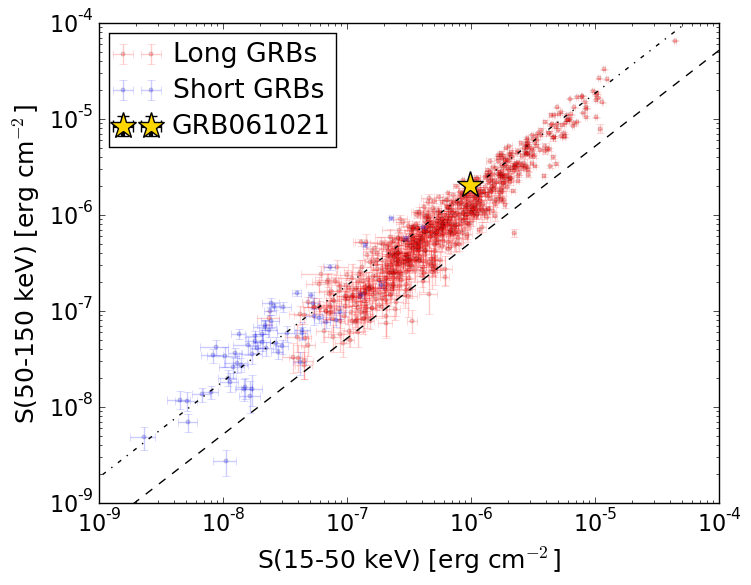
S(15-50 keV)  = 9.80658e-07
S(50-150 keV) = 2.0335516e-06
The dash-dotted line and the dashed line traces the fluences calculated from the Band function with Epeak = 15 and 150 keV, respectively. Both lines assume a canonical values of alpha = -1 and beta = -2.5.
Mask shadow pattern
IMX = 2.178837436603384E-01, IMY = 4.184145176900618E-01
Spacecraft aspect plot
Bright source in the pre-burst/pre-slew/post-slew images
Pre-burst image of 15-350 keV band
Time interval of the image:
-239.184000 -0.008000

# RAcent  DECcent POSerr Theta    Phi  PeakCts   SNR AngSep     Name
#  [deg]    [deg]    ['] [deg]  [deg]                   [']
135.5473 -40.5872    2.0  36.7  -28.9   1.2856   5.7    2.1	Vela X-1
105.0356  38.0284    2.4  47.1  141.0   3.0331   4.8 ------	UNKNOWN
131.2591  30.1155    2.8  35.5  171.5   0.9342   4.1 ------	UNKNOWN
127.2232  -8.3913    2.2   3.7  -38.3   0.7700   5.2 ------	UNKNOWN
131.8146 -49.9963    2.6  45.3  -21.9   1.2771   4.4 ------	UNKNOWN
126.5022 -57.7968    3.0  52.8  -17.0   1.6571   3.9 ------	UNKNOWN
Pre-slew background subtracted image of 15-350 keV band
Time interval of the image:
-0.008000 10.516600

# RAcent  DECcent POSerr Theta    Phi  PeakCts   SNR AngSep     Name
#  [deg]    [deg]    ['] [deg]  [deg]                   [']
135.5160 -40.5553   69.1  36.6  -28.9   0.0103   0.2    0.6	Vela X-1
 87.1007   4.4126    2.9  39.8   86.4   0.5699   4.0 ------	UNKNOWN
110.5557  25.1555    2.9  33.6  137.9   0.2683   4.0 ------	UNKNOWN
148.6634  31.9211    2.6  42.8 -167.6   0.2751   4.4 ------	UNKNOWN
145.1488 -21.9538    0.2  25.3  -62.5   3.2402  59.8 ------	UNKNOWN
164.7017 -20.5178    2.2  40.8  -80.6   0.8808   5.2 ------	UNKNOWN
Post-slew image of 15-350 keV band
Time interval of the image:
58.916600 542.916000

# RAcent  DECcent POSerr Theta    Phi  PeakCts   SNR AngSep     Name
#  [deg]    [deg]    ['] [deg]  [deg]                   [']
135.5425 -40.5077    2.5  20.3   21.7   4.2401   4.6    2.9	Vela X-1
170.4896 -60.4762    6.2  42.4  -17.9   2.6432   1.9   10.2	Cen X-3
186.6266 -62.7617    1.1  49.4  -23.2  19.1577  10.3    1.0	GX 301-2
114.0665  -9.9792    2.5  32.1  107.2   7.9698   4.7 ------	UNKNOWN
103.2579 -69.9906    3.0  54.0   16.7  18.3723   3.9 ------	UNKNOWN
146.9080  29.4270    2.8  51.4 -177.7   9.7350   4.2 ------	UNKNOWN
173.9144 -63.0864    2.9  45.5  -17.5   6.3786   4.0 ------	UNKNOWN
161.2866   1.1403    2.7  28.0 -143.3   4.0455   4.3 ------	UNKNOWN