Analysis Summary
Notes:
- 1) No attempt has been made to eliminate the non-significant decimal places.
- 2) This batgrbproduct analysis is done using the HEASARC data.
- 3) This batgrbproduct analysis is using the flight position for the mask-weighting calculation.
======================================================================
                  BAT GRB EVENT DATA PROCESSING REPORT
    Process Script Ver: batgrbproduct v2.46
    Process Start Time: Wed Jan 22 12:19:20 EST 2014
             Host Name: batevent1
   Current Working Dir: /local/data/batevent/batevent_reproc/trigger235715
======================================================================

  Trigger: 00235715      Segment: 000

  BAT Trigger Time: 183691584   [s; MET]
      Trigger Stop: 183691712   [s; MET]
               UTC: 2006-10-28T01:26:22.466000    [includes UTCF correction]
       Where From?: TDRSS position message

  BAT
    RA: 97.2117735881431   Dec: 46.2699444035206  [deg; J2000]

     Catalogged Source?: NO
     Point Source?:      YES
     GRB Indicated?:     YES    [ by BAT flight software ]
     Image S/N Ratio:    8.1
     Image Trigger?:     YES
     Rate S/N Ratio:     0  [ if not an image trigger ]
     Image S/N Ratio:    8.1

  Analysis Position:   [ source = BAT ]
    RA: 97.2117735881431   Dec: 46.2699444035206  [deg; J2000]

  Refined Position:   [ source = BAT pre-slew burst ]
    RA: 97.1872250788109   Dec: 46.2897368338446  [deg; J2000]
        { 06h 28m 44.9s , +46d 17' 23.1" }
         +/- 2.51095129091513 [arcmin] (estimated 90% radius based on SNR)
         +/- 1.33099245056577 [arcmin] (formal 1-sigma fit error)
    SNR: 8.16433517246874

  Angular difference between the analysis and refined position is 1.564146 arcmin

  Partial Coding Fraction: 0.3554688    [ including projection effects ]

  Duration
     T90: 105.812000006437 +/- 36.9372000045884
        Measured from: 57.0200000107288
                   to: 162.832000017166     [s; relative to TRIGTIME]
     T50: 42.0320000052452 +/- 17.5047662030556
        Measured from: 79.8240000009537
                   to: 121.856000006199     [s; relative to TRIGTIME]


  Fluence
     Peak Flux  (peak 1 second)
        Measured from: 79.9359999895096
                   to: 80.9359999895096     [s; relative to TRIGTIME]
     Total Fluence
        Measured from: 46.7879999876022
                   to: 166.143999993801     [s; relative to TRIGTIME]

             Band 1     Band 2     Band 3     Band 4
              15-25      25-50     50-100    100-350     keV
 Total     0.533122   0.547030   0.439639   0.144819
           0.081833   0.084725   0.074169   0.065460 [error]
 Peak      0.012696   0.033029   0.021660   0.018205
           0.008018   0.008280   0.007057   0.006267 [error]

     [ fluence units of on-axis counts / fully illuminated detector ]

======================================================================


====== Table of the duration information =============================

        Value   tstart    tstop
T100  119.356   46.788  166.144
T90   105.812   57.020  162.832
T50    42.032   79.824  121.856
Peak    1.000   79.936   80.936


====== Spectral Analysis Summary =====================================

Model      : spectral model: simple power-law (PL) and cutoff power-law (CPL)
Ph_index   : photon index: E^{Ph_index}
Ph_90err   : 90% error of the photon index
Epeak      : Epeak in keV
Epeak_90err: 90% error of Epeak
Norm       : normalization at 50 keV in both the PL model and CPL model
Nomr_90err : 90% error of the normalization
chi2       : Chi-Squared
dof        : degree of freedo

=== Time-averaged spectral analysis ===
(Best model with acceptable fit: PL)

Model Ph_index Ph_90err_low Ph_90err_hi  Epeak  Epeak_90err_low  Epeak_90err_hi  Norm       Nomr_90err_low    Norm_90err_hi    chi2    dof
PL      -1.676    -0.296      0.284       -           -               -         8.62e-04     -1.48e-04          1.43e-04      51.240   57
CPL     -1.685    -0.289      0.355     9999.340    -9999.330      -9999.340      8.57e-04     -1.43e-04          9.16e-04      51.250   56


=== 1-s peak spectral analysis ===
(Best model with acceptable fit: PL)

Model Ph_index Ph_90err_low Ph_90err_hi  Epeak  Epeak_90err_low  Epeak_90err_hi  Norm       Nomr_90err_low    Norm_90err_hi    chi2    dof
PL      -1.052     -0.506     0.611       -           -               -         5.51e-03     -1.65e-03          1.57e-03      58.540   57
CPL     -1.066     -0.492     0.731     9999.360    -9999.360      -9999.360      5.56e-03     -1.66e-03          2.26e-02      58.550   56


=== Fluence/Peak Flux Summary ===

              Model    Band1     Band2     Band3     Band4     Band5     Total
                       15-25     25-50    50-100    100-350    15-150    15-350    keV
Fluence         PL   1.55e-07  2.56e-07  3.20e-07  7.97e-07  9.54e-07  1.53e-06   erg/cm2
      90%_error_low -3.69e-08 -3.86e-08 -7.49e-08 -3.31e-07 -1.71e-07 -4.08e-07   erg/cm2
      90%_error_hi   3.85e-08  3.85e-08  7.46e-08  4.62e-07  1.75e-07  5.14e-07   erg/cm2
Peak flux       PL   1.48e-01  1.94e-01  1.88e-01  3.22e-01  6.36e-01  8.52e-01   ph/cm2/s
      90%_error_low -4.61e-02 -7.82e-02 -5.58e-02 -1.70e-01 -1.91e-01 -2.42e-01   ph/cm2/s
      90%_error_hi   1.03e-01  7.22e-02  5.44e-02  2.90e-01  1.93e-01  2.56e-01   ph/cm2/s

Fluence        CPL   1.59e-07  2.03e-07  3.17e-07  8.94e-07  9.63e-07  1.52e-06   erg/cm2
      90%_error_low -5.34e-08 -6.10e-08 -1.59e-07 -5.80e-07 -2.37e-07 -5.54e-07   erg/cm2
      90%_error_hi   4.81e-08  3.93e-08  -7.78e-08  1.11e-07  7.82e-08  4.14e-07   erg/cm2
Peak flux      CPL   1.57e-01  1.93e-01  1.86e-01  3.81e-01  6.43e-01  8.59e-01   ph/cm2/s
      90%_error_low     N/A   -8.92e-02 -5.46e-02     N/A   -2.99e-01 -8.59e-01   ph/cm2/s
      90%_error_hi      N/A    8.62e-02  5.79e-02     N/A    2.15e-01  2.46e-01   ph/cm2/s

======================================================================
Image
Pre-slew 15.0-350.0 keV image (Event data)
#   RAcent    DECcent   POSerr    Theta     Phi              Peak Cts       SNR   Name
   97.1872    46.2897   0.0237    30.1905   101.2201         1.2901305      8.164 TRIG_00235715

Foreground time interval of the image:
 46.788 136.101 (delta_t =  89.313 [sec])
Background time interval of the image:
-239.000  46.788 (delta_t = 285.788 [sec])
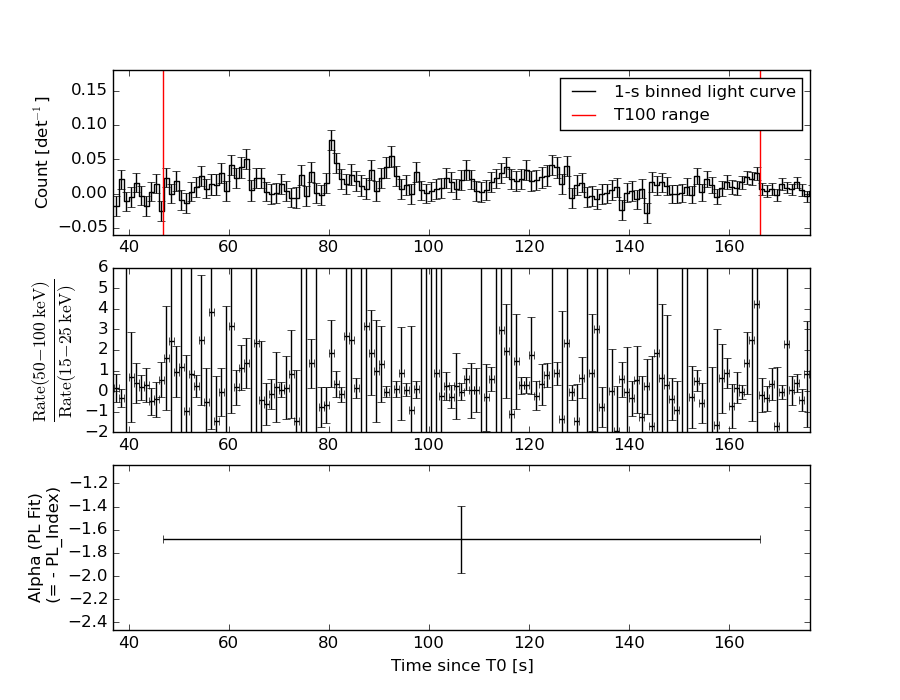
Light Curves
Note: The mask-weighted lightcurves have units of either count/det or counts/sec/det, where a det is 0.4 x 0.4 = 0.16 sq cm.
Full-time range; 1 s binning
Other quick-look light curves:
- 64 ms binning (zoomed)
- 16 ms binning (zoomed)
- 8 ms binning (zoomed)
- 2 ms binning (zoomed)
- SN=5 or 10 s binning (full-time range)
- Raw light curve
Spectra
- 64 ms binning (zoomed)
- 16 ms binning (zoomed)
- 8 ms binning (zoomed)
- 2 ms binning (zoomed)
- SN=5 or 10 s binning (full-time range)
- Raw light curve
Spectra
Notes:
- 1) The fitting includes the systematic errors.
- 2) When the burst includes telescope slew time periods, the fitting uses an average response file made from multiple 5-s response files through out the slew time plus single time preiod for the non-slew times, and weighted by the total counts in the corresponding time period using addrmf. An average response file is needed becuase a spectral fit using the pre-slew DRM will introduce some errors in both a spectral shape and a normalization if the PHA file contains a lot of the slew/post-slew time interval.
- 3) For fits to more complicated models (e.g. a power-law over a cutoff power-law), the BAT team has decided to require a chi-square improvement of more than 6 for each extra dof.
Time averaged spectrum fit using the average DRM
Power-law model
Time interval is from   46.788 sec. to  166.144 sec.

Spectral model in power-law:
------------------------------------------------------------
Parameters  : value       lower 90%   higher 90%
Photon index: -1.67597     ( -0.296507   0.284205 )
Norm@50keV  : 8.61542E-04    ( -0.000148017   0.000143067 )
------------------------------------------------------------
#Fit statistic : Chi-Squared =          51.24 using 59 PHA bins.
# Reduced chi-squared =         0.8989 for     57 degrees of freedom
# Null hypothesis probability =   6.899886e-01

Photon flux (15-150 keV)    in 119.4 sec: 0.113483 ( -0.017127  0.017144 ) ph/cm2/s
Energy fluence (15-150 keV)             : 9.54497e-07 ( -1.71185e-07  1.74765e-07 ) ergs/cm2
Cutoff power-law model
Time interval is from   46.788 sec. to  166.144 sec.
Spectral model in the cutoff power-law:
------------------------------------------------------------
Parameters  : value       lower 90%   higher 90%
Photon index: -1.68492     ( -0.289231   0.35457 )
Epeak [keV] : 9999.34      ( -9999.35 -9999.36 )
Norm@50keV  : 8.56838E-04    ( -0.00014681   0.000911879 )
------------------------------------------------------------
#Fit statistic : Chi-Squared =          51.25 using 59 PHA bins.
# Reduced chi-squared =         0.9152 for     56 degrees of freedom
# Null hypothesis probability =   6.549228e-01

Photon flux (15-150 keV)    in 119.4 sec: 0.113701 ( -0.0175802  0.01712 ) ph/cm2/s
Energy fluence (15-150 keV)             : 9.62664e-07 ( -2.36818e-07  7.81532e-08 ) ergs/cm2
1-s peak spectrum fit
Power-law model
Time interval is from   79.936 sec. to   80.936 sec.

Spectral model in power-law:
------------------------------------------------------------
Parameters  : value       lower 90%   higher 90%
Photon index: -1.05182     ( -0.506503   0.610531 )
Norm@50keV  : 5.50991E-03    ( -0.00164979   0.00157137 )
------------------------------------------------------------
#Fit statistic : Chi-Squared =          58.54 using 59 PHA bins.
# Reduced chi-squared =          1.027 for     57 degrees of freedom
# Null hypothesis probability =   4.185925e-01

Photon flux (15-150 keV)    in 1 sec: 0.636462 ( -0.191152  0.192826 ) ph/cm2/s
Energy fluence (15-150 keV)             : 5.85302e-08 ( -1.69487e-08  1.70834e-08 ) ergs/cm2
Cutoff power-law model

Time interval is from   79.936 sec. to   80.936 sec.
Spectral model in the cutoff power-law:
------------------------------------------------------------
Parameters  : value       lower 90%   higher 90%
Photon index: -1.06561     ( -0.492793   0.729798 )
Epeak [keV] : 9999.36      ( -9999.36 -9999.36 )
Norm@50keV  : 5.55614E-03    ( -0.00166187   0.022572 )
------------------------------------------------------------
#Fit statistic : Chi-Squared =          58.55 using 59 PHA bins.
# Reduced chi-squared =          1.046 for     56 degrees of freedom
# Null hypothesis probability =   3.818650e-01

Photon flux (15-150 keV)    in 1 sec: 0.643064 ( -0.298922  0.214771 ) ph/cm2/s
Energy fluence (15-150 keV)             : 5.88925e-08 ( -1.98588e-08  1.92649e-08 ) ergs/cm2
Time-resolved spectra
Distribution
T90 vs. Hardness ratio plot
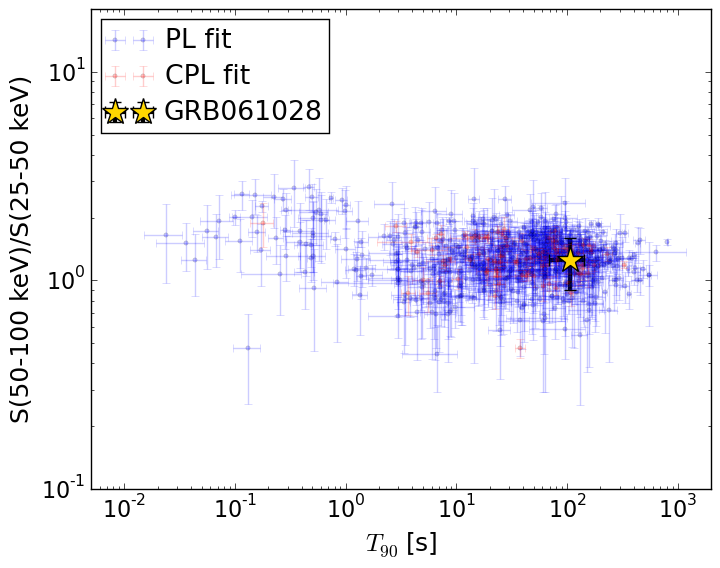
T90                                   = 105.812 sec.
Hardness ratio (energy fluence ratio) = 1.25184380744
S(15-50 keV) vs. S(50-150 keV) plot
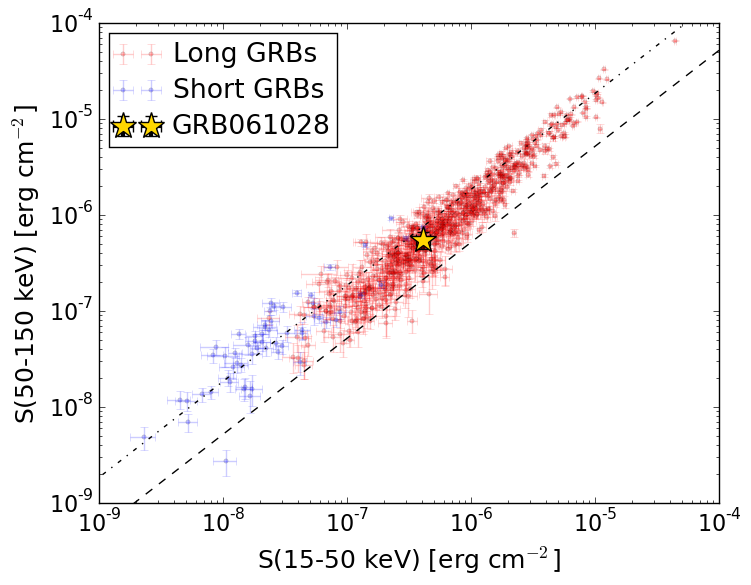
S(15-50 keV)  = 4.10771e-07
S(50-150 keV) = 5.437176e-07
The dash-dotted line and the dashed line traces the fluences calculated from the Band function with Epeak = 15 and 150 keV, respectively. Both lines assume a canonical values of alpha = -1 and beta = -2.5.
Mask shadow pattern
IMX = -1.132042114696700E-01, IMY = -5.706716966819677E-01
Spacecraft aspect plot
Bright source in the pre-burst/pre-slew/post-slew images
Pre-burst image of 15-350 keV band
Time interval of the image:
-239.000000 46.788000

# RAcent  DECcent POSerr Theta    Phi  PeakCts   SNR AngSep     Name
#  [deg]    [deg]    ['] [deg]  [deg]                   [']
 60.8739  81.0208    3.1  46.9  156.2   1.9265   3.7 ------	UNKNOWN
143.0461  39.0349    2.5   4.0  -57.8   0.7440   4.5 ------	UNKNOWN
151.2284  49.8128    3.2  11.5 -149.4   0.5883   3.6 ------	UNKNOWN
164.2009  -3.4208    3.2  50.7  -44.6   3.7120   3.7 ------	UNKNOWN
Pre-slew background subtracted image of 15-350 keV band
Time interval of the image:
46.788000 136.100590

# RAcent  DECcent POSerr Theta    Phi  PeakCts   SNR AngSep     Name
#  [deg]    [deg]    ['] [deg]  [deg]                   [']
100.1911  12.9040    2.4  44.6   49.5   1.8484   4.7 ------	UNKNOWN
 73.4956  68.0501    2.2  42.8  138.2   1.3495   5.3 ------	UNKNOWN
 97.1872  46.2897    1.4  30.2  101.2   1.2899   8.2 ------	UNKNOWN
Post-slew image of 15-350 keV band
Time interval of the image:
187.900600 963.070000

# RAcent  DECcent POSerr Theta    Phi  PeakCts   SNR AngSep     Name
#  [deg]    [deg]    ['] [deg]  [deg]                   [']
 83.6321  22.0161    0.2  26.6   38.3  33.5181  63.0    0.1	Crab
358.9662  65.2517    2.8  52.1  157.5   7.7562   4.1 ------	UNKNOWN
 59.4493  42.8450    2.6  26.9  105.7   2.6914   4.4 ------	UNKNOWN
 94.2213   5.0466    2.8  41.3   13.7   2.9228   4.1 ------	UNKNOWN
108.6389  -4.2187    3.7  51.5   -5.4   3.6476   3.2 ------	UNKNOWN