Analysis Summary
Notes:
- 1) No attempt has been made to eliminate the non-significant decimal places.
- 2) This batgrbproduct analysis is done using the HEASARC data.
- 3) This batgrbproduct analysis is using the flight position for the mask-weighting calculation.
======================================================================
BAT GRB EVENT DATA PROCESSING REPORT
Process Script Ver: batgrbproduct v2.46
Process Start Time: Wed Jan 22 12:03:11 EST 2014
Host Name: batevent1
Current Working Dir: /local/data/batevent/batevent_reproc/trigger238108
======================================================================
Trigger: 00238108 Segment: 000
BAT Trigger Time: 184852042.88 [s; MET]
Trigger Stop: 184852044.928 [s; MET]
UTC: 2006-11-10T11:47:21.318140 [includes UTCF correction]
Where From?: TDRSS position message
BAT
RA: 336.30368447156 Dec: -2.26672228601831 [deg; J2000]
Catalogged Source?: NO
Point Source?: YES
GRB Indicated?: YES [ by BAT flight software ]
Image S/N Ratio: 7.33
Image Trigger?: NO
Rate S/N Ratio: 8 [ if not an image trigger ]
Image S/N Ratio: 7.33
Analysis Position: [ source = BAT ]
RA: 336.30368447156 Dec: -2.26672228601831 [deg; J2000]
Refined Position: [ source = BAT pre-slew burst ]
RA: 336.285915402244 Dec: -2.25967051729736 [deg; J2000]
{ 22h 25m 08.6s , -02d 15' 34.8" }
+/- 1.14669362771445 [arcmin] (estimated 90% radius based on SNR)
+/- 0.43026213724939 [arcmin] (formal 1-sigma fit error)
SNR: 25.0145977831664
Angular difference between the analysis and refined position is 1.146259 arcmin
Partial Coding Fraction: 1.015625 [ including projection effects ]
Duration
T90: 44.5080000162125 +/- 5.90336208604624
Measured from: -6.2039999961853
to: 38.3040000200272 [s; relative to TRIGTIME]
T50: 22.1440000236034 +/- 3.23418241155829
Measured from: 1.04399999976158
to: 23.188000023365 [s; relative to TRIGTIME]
Fluence
Peak Flux (peak 1 second)
Measured from: 2.11599999666214
to: 3.11599999666214 [s; relative to TRIGTIME]
Total Fluence
Measured from: -8.7960000038147
to: 44.8840000033379 [s; relative to TRIGTIME]
Band 1 Band 2 Band 3 Band 4
15-25 25-50 50-100 100-350 keV
Total 0.656172 0.736010 0.510980 0.088161
0.036070 0.038080 0.035543 0.036373 [error]
Peak 0.031733 0.016642 0.009808 0.015331
0.005055 0.005286 0.005076 0.005195 [error]
[ fluence units of on-axis counts / fully illuminated detector ]
======================================================================
====== Table of the duration information =============================
Value tstart tstop
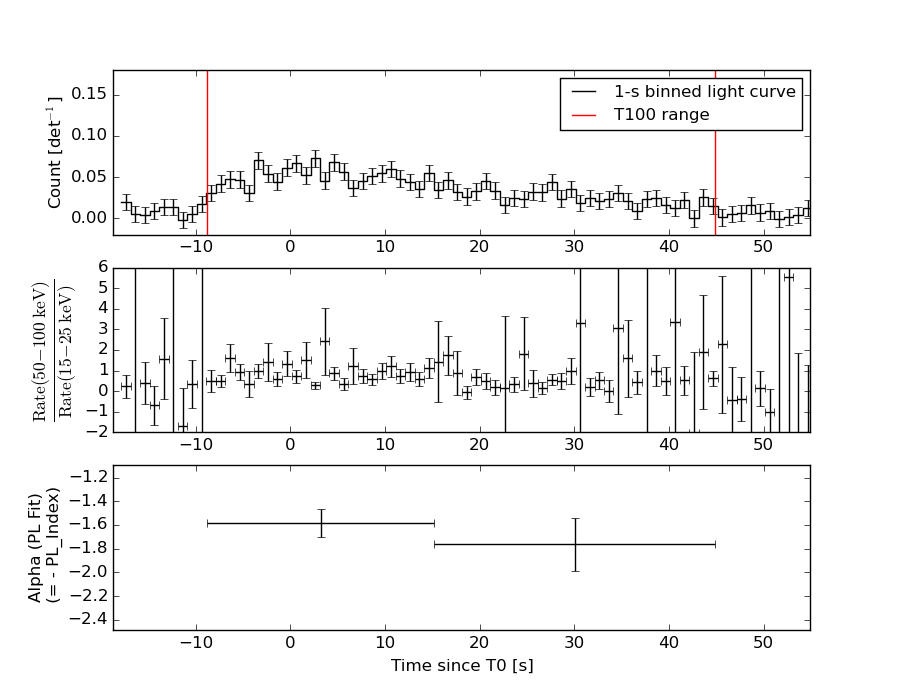
T100 53.680 -8.796 44.884
T90 44.508 -6.204 38.304
T50 22.144 1.044 23.188
Peak 1.000 2.116 3.116
====== Spectral Analysis Summary =====================================
Model : spectral model: simple power-law (PL) and cutoff power-law (CPL)
Ph_index : photon index: E^{Ph_index}
Ph_90err : 90% error of the photon index
Epeak : Epeak in keV
Epeak_90err: 90% error of Epeak
Norm : normalization at 50 keV in both the PL model and CPL model
Nomr_90err : 90% error of the normalization
chi2 : Chi-Squared
dof : degree of freedo
=== Time-averaged spectral analysis ===
(Best model with acceptable fit: PL)
Model Ph_index Ph_90err_low Ph_90err_hi Epeak Epeak_90err_low Epeak_90err_hi Norm Nomr_90err_low Norm_90err_hi chi2 dof
PL -1.643 -0.118 0.116 - - - 2.26e-03 -1.48e-04 1.47e-04 59.030 57
CPL -1.556 -0.196 0.448 240.328 -240.328 -240.328 2.51e-03 -6.45e-04 1.74e-03 58.900 56
=== 1-s peak spectral analysis ===
(Best model with acceptable fit: PL)
Model Ph_index Ph_90err_low Ph_90err_hi Epeak Epeak_90err_low Epeak_90err_hi Norm Nomr_90err_low Norm_90err_hi chi2 dof
PL -2.040 -0.599 0.517 - - - 3.08e-03 -1.22e-03 1.17e-03 59.970 57
CPL -2.101 -0.487 2.431 44.496 N/A N/A 2.65e-03 N/A N/A 59.770 56
=== Fluence/Peak Flux Summary ===
Model Band1 Band2 Band3 Band4 Band5 Total
15-25 25-50 50-100 100-350 15-150 15-350 keV
Fluence PL 1.77e-07 2.98e-07 3.81e-07 9.81e-07 1.13e-06 1.84e-06 erg/cm2
90%_error_low -1.75e-08 -1.78e-08 -3.50e-08 -1.80e-07 -7.99e-08 -2.11e-07 erg/cm2
90%_error_hi 1.81e-08 1.78e-08 3.51e-08 2.08e-07 8.11e-08 2.34e-07 erg/cm2
Peak flux PL 2.14e-01 1.57e-01 7.61e-02 5.25e-02 4.71e-01 4.99e-01 ph/cm2/s
90%_error_low -6.95e-02 -4.25e-02 -3.69e-02 -3.60e-02 -1.18e-01 -1.31e-01 ph/cm2/s
90%_error_hi 7.01e-02 4.07e-02 4.20e-02 7.14e-02 1.18e-01 1.36e-01 ph/cm2/s
Fluence CPL 1.75e-07 3.00e-07 3.82e-07 8.39e-07 1.12e-06 1.70e-06 erg/cm2
90%_error_low -2.07e-08 -1.98e-08 -3.54e-08 -4.26e-07 -9.55e-08 -4.40e-07 erg/cm2
90%_error_hi 1.82e-08 2.17e-08 3.57e-08 1.81e-07 8.96e-08 2.08e-07 erg/cm2
Peak flux CPL 2.02e-01 1.43e-01 7.02e-02 5.48e-02 4.40e-01 4.74e-01 ph/cm2/s
90%_error_low N/A N/A N/A -5.48e-02 -2.36e-01 N/A ph/cm2/s
90%_error_hi N/A N/A N/A 2.74e-02 1.47e-01 N/A ph/cm2/s
======================================================================
Image
Pre-slew 15.0-350.0 keV image (Event data)
#   RAcent    DECcent   POSerr    Theta     Phi              Peak Cts       SNR   Name
  336.2859    -2.2597   0.0077     6.2687    43.7789         1.7067683     25.015 TRIG_00238108

Foreground time interval of the image:
 -8.796  30.021 (delta_t =  38.817 [sec])
Background time interval of the image:
-239.880  -8.796 (delta_t = 231.084 [sec])
Light Curves
Note: The mask-weighted lightcurves have units of either count/det or counts/sec/det, where a det is 0.4 x 0.4 = 0.16 sq cm.
Full-time range; 1 s binning
Other quick-look light curves:
- 64 ms binning (zoomed)
- 16 ms binning (zoomed)
- 8 ms binning (zoomed)
- 2 ms binning (zoomed)
- SN=5 or 10 s binning (full-time range)
- Raw light curve
Spectra
- 64 ms binning (zoomed)
- 16 ms binning (zoomed)
- 8 ms binning (zoomed)
- 2 ms binning (zoomed)
- SN=5 or 10 s binning (full-time range)
- Raw light curve
Spectra
Notes:
- 1) The fitting includes the systematic errors.
- 2) When the burst includes telescope slew time periods, the fitting uses an average response file made from multiple 5-s response files through out the slew time plus single time preiod for the non-slew times, and weighted by the total counts in the corresponding time period using addrmf. An average response file is needed becuase a spectral fit using the pre-slew DRM will introduce some errors in both a spectral shape and a normalization if the PHA file contains a lot of the slew/post-slew time interval.
- 3) For fits to more complicated models (e.g. a power-law over a cutoff power-law), the BAT team has decided to require a chi-square improvement of more than 6 for each extra dof.
Time averaged spectrum fit using the average DRM
Power-law model

Time interval is from   -8.796 sec. to   44.884 sec.

Spectral model in power-law:
------------------------------------------------------------
Parameters  : value       lower 90%   higher 90%
Photon index: -1.64326     ( -0.118208   0.116363 )
Norm@50keV  : 2.25567E-03    ( -0.000148295   0.000146779 )
------------------------------------------------------------
#Fit statistic : Chi-Squared =          59.03 using 59 PHA bins.
# Reduced chi-squared =          1.036 for     57 degrees of freedom
# Null hypothesis probability =   4.012400e-01

Photon flux (15-150 keV)    in 53.68 sec: 0.293896 ( -0.017531  0.017551 ) ph/cm2/s
Energy fluence (15-150 keV)             : 1.12708e-06 ( -7.99413e-08  8.10509e-08 ) ergs/cm2
Cutoff power-law model
Time interval is from   -8.796 sec. to   44.884 sec.
Spectral model in the cutoff power-law:
------------------------------------------------------------
Parameters  : value       lower 90%   higher 90%
Photon index: -1.55621     ( -0.195893   0.448175 )
Epeak [keV] : 240.328      ( -240.328 -240.328 )
Norm@50keV  : 2.50570E-03    ( -0.000645409   0.00173959 )
------------------------------------------------------------
#Fit statistic : Chi-Squared =          58.90 using 59 PHA bins.
# Reduced chi-squared =          1.052 for     56 degrees of freedom
# Null hypothesis probability =   3.697646e-01

Photon flux (15-150 keV)    in 53.68 sec: 0.292250 ( -0.019149  0.018676 ) ph/cm2/s
Energy fluence (15-150 keV)             : 1.11587e-06 ( -9.55096e-08  8.96472e-08 ) ergs/cm2
1-s peak spectrum fit
Power-law model
Time interval is from    2.116 sec. to    3.116 sec.

Spectral model in power-law:
------------------------------------------------------------
Parameters  : value       lower 90%   higher 90%
Photon index: -2.03985     ( -0.59858   0.516577 )
Norm@50keV  : 3.08211E-03    ( -0.00121727   0.00117054 )
------------------------------------------------------------
#Fit statistic : Chi-Squared =          59.97 using 59 PHA bins.
# Reduced chi-squared =          1.052 for     57 degrees of freedom
# Null hypothesis probability =   3.686809e-01

Photon flux (15-150 keV)    in 1 sec: 0.471028 ( -0.117809  0.118061 ) ph/cm2/s
Energy fluence (15-150 keV)             : 2.84971e-08 ( -9.65323e-09  1.08706e-08 ) ergs/cm2
Cutoff power-law model
Time interval is from    2.116 sec. to    3.116 sec.
Spectral model in the cutoff power-law:
------------------------------------------------------------
Parameters  : value       lower 90%   higher 90%
Photon index: -2.10143     ( -0.48699   2.43125 )
Epeak [keV] : 44.4961      (   )
Norm@50keV  : 2.64856E-03    (     )
------------------------------------------------------------
#Fit statistic : Chi-Squared =          59.77 using 59 PHA bins.
# Reduced chi-squared =          1.067 for     56 degrees of freedom
# Null hypothesis probability =   3.405615e-01

Photon flux (15-150 keV)    in 1 sec: 0.439900 ( -0.235787  0.147199 ) ph/cm2/s
Energy fluence (15-150 keV)             : 2.81916e-08 ( -2.44174e-08  4.82482e-09 ) ergs/cm2
Time-resolved spectra
Distribution
T90 vs. Hardness ratio plot
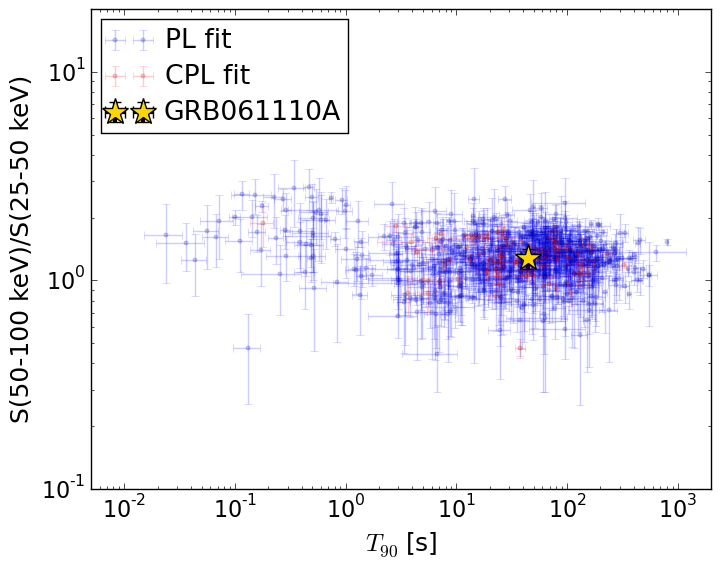
T90                                   = 44.508 sec.
Hardness ratio (energy fluence ratio) = 1.28055997908
S(15-50 keV) vs. S(50-150 keV) plot
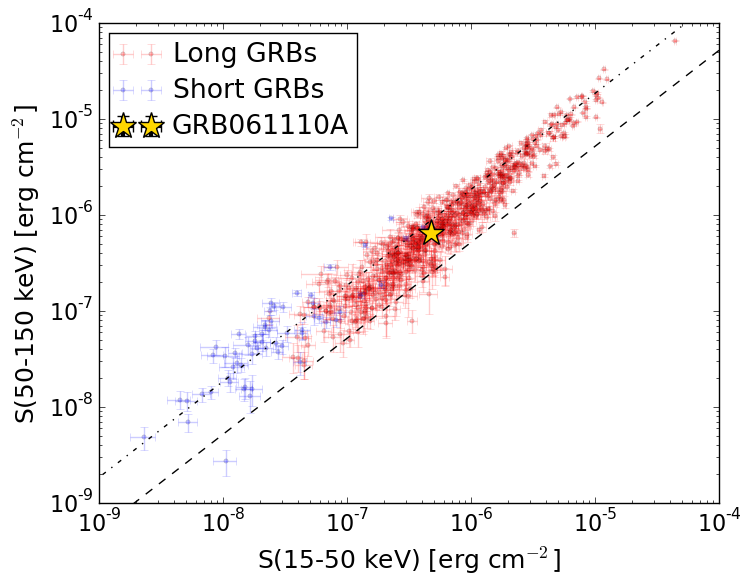
S(15-50 keV)  = 4.747253e-07
S(50-150 keV) = 6.523412e-07
The dash-dotted line and the dashed line traces the fluences calculated from the Band function with Epeak = 15 and 150 keV, respectively. Both lines assume a canonical values of alpha = -1 and beta = -2.5.
Mask shadow pattern
IMX = 7.931218979124242E-02, IMY = -7.600160850657510E-02
Spacecraft aspect plot
Bright source in the pre-burst/pre-slew/post-slew images
Pre-burst image of 15-350 keV band
Time interval of the image:
-239.880000 -8.796000

# RAcent  DECcent POSerr Theta    Phi  PeakCts   SNR AngSep     Name
#  [deg]    [deg]    ['] [deg]  [deg]                   [']
288.7924  10.9630    2.6  49.2  -41.9   3.1010   4.4    1.1	GRS 1915+105
299.5895  35.2113    0.9  54.4   -9.1   8.1955  13.2    0.6	Cyg X-1
308.1119  40.9785   39.7  54.8    1.7  -0.2217  -0.3    1.6	Cyg X-3
326.1511  38.1592    8.2  47.0   17.0   0.6723   1.4    9.8	Cyg X-2
348.4092  32.6354    3.1  43.0   43.3   2.2411   3.7 ------	UNKNOWN
331.5519  32.8448    2.2  41.2   22.2   1.8471   5.3 ------	UNKNOWN
Pre-slew background subtracted image of 15-350 keV band
Time interval of the image:
-8.796000 30.020610

# RAcent  DECcent POSerr Theta    Phi  PeakCts   SNR AngSep     Name
#  [deg]    [deg]    ['] [deg]  [deg]                   [']
288.9064  10.9148    4.6  49.1  -41.9   0.6534   2.5    6.6	GRS 1915+105
299.5875  35.2290    6.3  54.4   -9.1  -0.4077  -1.8    1.6	Cyg X-1
308.1993  40.8891    7.5  54.7    1.7   0.4604   1.5    5.5	Cyg X-3
326.1049  38.2106   87.6  47.1   17.0  -0.0230  -0.1    7.4	Cyg X-2
 23.2762 -25.4947    2.1  49.6  142.5   1.7504   5.4 ------	UNKNOWN
346.6464  38.5804    2.1  48.2   38.7   1.7002   5.6 ------	UNKNOWN
346.2906  19.8722    2.2  30.5   48.4   0.5496   5.4 ------	UNKNOWN
355.6217 -20.2886    2.1  23.8  148.5   0.4257   5.5 ------	UNKNOWN
336.2859  -2.2597    0.5   6.3   43.8   1.7067  25.0 ------	UNKNOWN
309.5150  17.1473    2.2  35.3  -18.2   0.4745   5.1 ------	UNKNOWN
288.3166   1.7399    2.2  47.0  -54.0   1.5226   5.2 ------	UNKNOWN
Post-slew image of 15-350 keV band
Time interval of the image:
57.620600 962.225600

# RAcent  DECcent POSerr Theta    Phi  PeakCts   SNR AngSep     Name
#  [deg]    [deg]    ['] [deg]  [deg]                   [']
299.5808  35.2021    0.5  50.8  -20.0  33.2653  25.7    0.5	Cyg X-1
308.1358  40.8499   30.1  50.2   -8.6   0.4581   0.4    6.3	Cyg X-3
326.2656  38.3990    6.3  41.7    7.2   1.4486   1.8    6.4	Cyg X-2
  9.2223  21.5859    3.2  40.1   70.8   7.3686   3.5 ------	UNKNOWN
  4.3493  32.6750    3.0  43.9   53.9   7.7660   3.9 ------	UNKNOWN
  0.1028   5.1857    3.0  24.9   91.7   2.3791   3.9  311.2	UNKNOWN
341.4074  41.6467    2.9  44.1   24.6   3.9731   4.0 ------	UNKNOWN
356.4099 -57.1507    4.2  57.2 -173.7   7.4126   2.8 ------	UNKNOWN
313.9136 -54.4170    5.1  55.3 -145.3   8.1456   2.3 ------	UNKNOWN