Analysis Summary
Notes:
- 1) No attempt has been made to eliminate the non-significant decimal places.
- 2) This batgrbproduct analysis is done using the HEASARC data.
- 3) This batgrbproduct analysis is using the flight position for the mask-weighting calculation.
======================================================================
                  BAT GRB EVENT DATA PROCESSING REPORT
    Process Script Ver: batgrbproduct v2.46
    Process Start Time: Wed Jan 22 11:52:32 EST 2014
             Host Name: batevent1
   Current Working Dir: /local/data/batevent/batevent_reproc/trigger238174
======================================================================

  Trigger: 00238174      Segment: 000

  BAT Trigger Time: 184888727.104   [s; MET]
      Trigger Stop: 184888731.2   [s; MET]
               UTC: 2006-11-10T21:58:45.541260    [includes UTCF correction]
       Where From?: TDRSS position message

  BAT
    RA: 323.901585252738   Dec: 6.87708414719814  [deg; J2000]

     Catalogged Source?: NO
     Point Source?:      YES
     GRB Indicated?:     YES    [ by BAT flight software ]
     Image S/N Ratio:    8.14
     Image Trigger?:     NO
     Rate S/N Ratio:     16.3095064303001  [ if not an image trigger ]
     Image S/N Ratio:    8.14

  Analysis Position:   [ source = BAT ]
    RA: 323.901585252738   Dec: 6.87708414719814  [deg; J2000]

  Refined Position:   [ source = BAT pre-slew burst ]
    RA: 323.911463636539   Dec: 6.87268728510657  [deg; J2000]
        { 21h 35m 38.8s , +06d 52' 21.7" }
         +/- 1.6414889172484 [arcmin] (estimated 90% radius based on SNR)
         +/- 0.56189964534397 [arcmin] (formal 1-sigma fit error)
    SNR: 14.984269909139

  Angular difference between the analysis and refined position is 0.644872 arcmin

  Partial Coding Fraction: 1    [ including projection effects ]

  Duration
     T90: 135.247999995947 +/- 17.5919828326071
        Measured from: -14.6719999909401
                   to: 120.576000005007     [s; relative to TRIGTIME]
     T50: 59.8920000195503 +/- 10.8958487411014
        Measured from: 0.175999999046326
                   to: 60.0680000185966     [s; relative to TRIGTIME]


  Fluence
     Peak Flux  (peak 1 second)
        Measured from: -7.85600000619888
                   to: -6.85600000619888     [s; relative to TRIGTIME]
     Total Fluence
        Measured from: -16.5040000081062
                   to: 132.675999999046     [s; relative to TRIGTIME]

             Band 1     Band 2     Band 3     Band 4
              15-25      25-50     50-100    100-350     keV
 Total     0.376205   0.655248   0.639648   0.173502
           0.053648   0.056006   0.049559   0.042655 [error]
 Peak      0.015325   0.018038   0.025505   0.005339
           0.004550   0.004743   0.004455   0.003746 [error]

     [ fluence units of on-axis counts / fully illuminated detector ]

======================================================================


====== Table of the duration information =============================

        Value   tstart    tstop
T100  149.180  -16.504  132.676
T90   135.248  -14.672  120.576
T50    59.892    0.176   60.068
Peak    1.000   -7.856   -6.856


====== Spectral Analysis Summary =====================================

Model      : spectral model: simple power-law (PL) and cutoff power-law (CPL)
Ph_index   : photon index: E^{Ph_index}
Ph_90err   : 90% error of the photon index
Epeak      : Epeak in keV
Epeak_90err: 90% error of Epeak
Norm       : normalization at 50 keV in both the PL model and CPL model
Nomr_90err : 90% error of the normalization
chi2       : Chi-Squared
dof        : degree of freedo

=== Time-averaged spectral analysis ===
(Best model with acceptable fit: PL)

Model Ph_index Ph_90err_low Ph_90err_hi  Epeak  Epeak_90err_low  Epeak_90err_hi  Norm       Nomr_90err_low    Norm_90err_hi    chi2    dof
PL      -1.016    -0.151      0.155       -           -               -         8.43e-04     -7.16e-05          7.14e-05      57.600   57
CPL     -0.839    -0.309      0.624      378.049    -378.049      -378.049      1.01e-03     -2.27e-04          8.40e-04      57.310   56


=== 1-s peak spectral analysis ===
(Best model with acceptable fit: PL)

Model Ph_index Ph_90err_low Ph_90err_hi  Epeak  Epeak_90err_low  Epeak_90err_hi  Norm       Nomr_90err_low    Norm_90err_hi    chi2    dof
PL      -1.017     -0.373     0.394       -           -               -         4.02e-03     -9.06e-04          9.03e-04      50.130   57
CPL      0.070     -1.260     2.666      105.184      N/A           N/A         1.26e-02        N/A               N/A         48.800   56


=== Fluence/Peak Flux Summary ===

              Model    Band1     Band2     Band3     Band4     Band5     Total
                       15-25     25-50    50-100    100-350    15-150    15-350    keV
Fluence         PL   1.02e-07  2.53e-07  5.01e-07  2.46e-06  1.35e-06  3.32e-06   erg/cm2
      90%_error_low -1.77e-08 -2.67e-08 -4.69e-08 -4.98e-07 -1.22e-07 -5.25e-07   erg/cm2
      90%_error_hi   1.88e-08  2.63e-08  4.65e-08  5.88e-07  1.23e-07  6.03e-07   erg/cm2
Peak flux       PL   1.04e-01  1.40e-01  1.38e-01  2.46e-01  4.63e-01  6.29e-01   ph/cm2/s
      90%_error_low -4.25e-02 -3.88e-02 -3.43e-02 -1.07e-01 -1.06e-01 -1.51e-01   ph/cm2/s
      90%_error_hi   4.93e-02  3.79e-02  3.38e-02  1.52e-01  1.06e-01  1.62e-01   ph/cm2/s

Fluence        CPL   9.78e-08  2.56e-07  5.10e-07  1.93e-06  1.34e-06  2.80e-06   erg/cm2
      90%_error_low -2.24e-08 -2.80e-08 -5.37e-08 -9.86e-07 -1.30e-07 -9.83e-07   erg/cm2
      90%_error_hi   1.64e-08  2.86e-08  5.59e-08  6.57e-07  1.29e-07  1.19e-06   erg/cm2
Peak flux      CPL   8.00e-02  1.49e-01  1.54e-01  9.59e-02  4.43e-01  4.79e-01   ph/cm2/s
      90%_error_low -5.26e-02 -4.48e-02 -4.14e-02 -9.59e-02 -1.12e-01 -1.41e-01   ph/cm2/s
      90%_error_hi   5.97e-02  4.56e-02  4.44e-02  2.02e-01  1.11e-01  2.36e-01   ph/cm2/s

======================================================================
Image
Pre-slew 15.0-350.0 keV image (Event data)

#   RAcent    DECcent   POSerr    Theta     Phi              Peak Cts       SNR   Name
  323.9115     6.8727   0.0128    15.3614   -25.2467         1.7814770     14.984 TRIG_00238174

Foreground time interval of the image:
-16.504 105.197 (delta_t = 121.701 [sec])
Background time interval of the image:
-239.104 -16.504 (delta_t = 222.600 [sec])
Light Curves
Note: The mask-weighted lightcurves have units of either count/det or counts/sec/det, where a det is 0.4 x 0.4 = 0.16 sq cm.
Full-time range; 1 s binning
Other quick-look light curves:
- 64 ms binning (zoomed)
- 16 ms binning (zoomed)
- 8 ms binning (zoomed)
- 2 ms binning (zoomed)
- SN=5 or 10 s binning (full-time range)
- Raw light curve
Spectra
- 64 ms binning (zoomed)
- 16 ms binning (zoomed)
- 8 ms binning (zoomed)
- 2 ms binning (zoomed)
- SN=5 or 10 s binning (full-time range)
- Raw light curve
Spectra
Notes:
- 1) The fitting includes the systematic errors.
- 2) When the burst includes telescope slew time periods, the fitting uses an average response file made from multiple 5-s response files through out the slew time plus single time preiod for the non-slew times, and weighted by the total counts in the corresponding time period using addrmf. An average response file is needed becuase a spectral fit using the pre-slew DRM will introduce some errors in both a spectral shape and a normalization if the PHA file contains a lot of the slew/post-slew time interval.
- 3) For fits to more complicated models (e.g. a power-law over a cutoff power-law), the BAT team has decided to require a chi-square improvement of more than 6 for each extra dof.
Time averaged spectrum fit using the average DRM
Power-law model

Time interval is from  -16.504 sec. to  132.676 sec.

Spectral model in power-law:
------------------------------------------------------------
Parameters  : value       lower 90%   higher 90%
Photon index: -1.0164     ( -0.150811   0.154898 )
Norm@50keV  : 8.42845E-04    ( -7.16296e-05   7.13715e-05 )
------------------------------------------------------------
#Fit statistic : Chi-Squared =          57.60 using 59 PHA bins.
# Reduced chi-squared =          1.011 for     57 degrees of freedom
# Null hypothesis probability =   4.526863e-01

Photon flux (15-150 keV)    in 149.2 sec: 9.71255E-02 ( -0.0084438  0.0084755 ) ph/cm2/s
Energy fluence (15-150 keV)             : 1.35216e-06 ( -1.22322e-07  1.23065e-07 ) ergs/cm2
Cutoff power-law model
Time interval is from  -16.504 sec. to  132.676 sec.
Spectral model in the cutoff power-law:
------------------------------------------------------------
Parameters  : value       lower 90%   higher 90%
Photon index: -0.839032     ( -0.309425   0.624286 )
Epeak [keV] : 378.049      ( -378.049 -378.049 )
Norm@50keV  : 1.00959E-03    ( -0.000227436   0.000839901 )
------------------------------------------------------------
#Fit statistic : Chi-Squared =          57.31 using 59 PHA bins.
# Reduced chi-squared =          1.023 for     56 degrees of freedom
# Null hypothesis probability =   4.261556e-01

Photon flux (15-150 keV)    in 149.2 sec: 9.63079E-02 ( -0.0088368  0.0088131 ) ph/cm2/s
Energy fluence (15-150 keV)             : 1.33958e-06 ( -1.301e-07  1.28936e-07 ) ergs/cm2
1-s peak spectrum fit
Power-law model

Time interval is from   -7.856 sec. to   -6.856 sec.

Spectral model in power-law:
------------------------------------------------------------
Parameters  : value       lower 90%   higher 90%
Photon index: -1.01741     ( -0.372741   0.394405 )
Norm@50keV  : 4.01973E-03    ( -0.000906038   0.000903127 )
------------------------------------------------------------
#Fit statistic : Chi-Squared =          50.13 using 59 PHA bins.
# Reduced chi-squared =         0.8795 for     57 degrees of freedom
# Null hypothesis probability =   7.284068e-01

Photon flux (15-150 keV)    in 1 sec: 0.463246 ( -0.105704  0.106177 ) ph/cm2/s
Energy fluence (15-150 keV)             : 4.32056e-08 ( -1.05212e-08  1.06921e-08 ) ergs/cm2
Cutoff power-law model

Time interval is from   -7.856 sec. to   -6.856 sec.
Spectral model in the cutoff power-law:
------------------------------------------------------------
Parameters  : value       lower 90%   higher 90%
Photon index: 0.0703312     ( -1.25964   2.66645 )
Epeak [keV] : 105.184      (   )
Norm@50keV  : 1.26381E-02    (     )
------------------------------------------------------------
#Fit statistic : Chi-Squared =          48.80 using 59 PHA bins.
# Reduced chi-squared =         0.8715 for     56 degrees of freedom
# Null hypothesis probability =   7.414508e-01

Photon flux (15-150 keV)    in 1 sec: 0.442542 ( -0.111988  0.110911 ) ph/cm2/s
Energy fluence (15-150 keV)             : 4.04045e-08 ( -1.14117e-08  1.16274e-08 ) ergs/cm2
Time-resolved spectra

Distribution
T90 vs. Hardness ratio plot
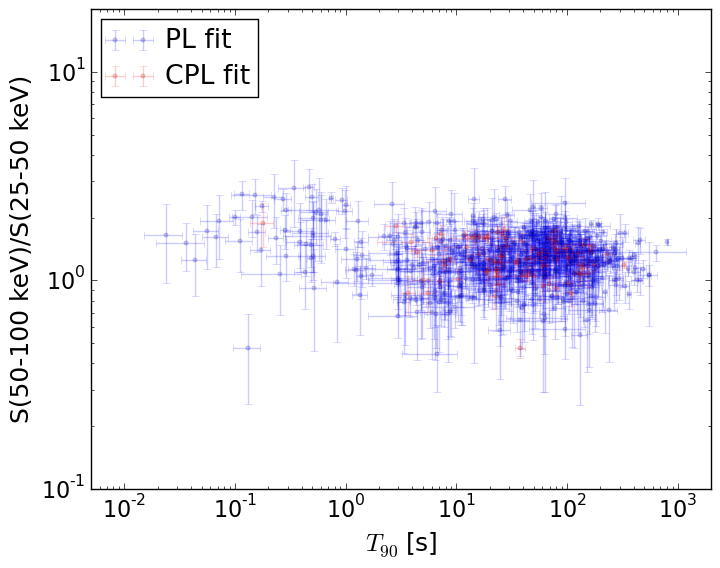
T90                                   = N/A sec.
Hardness ratio (energy fluence ratio) = N/A
S(15-50 keV) vs. S(50-150 keV) plot

S(15-50 keV)  = N/A
S(50-150 keV) = N/A
The dash-dotted line and the dashed line traces the fluences calculated from the Band function with Epeak = 15 and 150 keV, respectively. Both lines assume a canonical values of alpha = -1 and beta = -2.5.
Mask shadow pattern

IMX = 2.484801929546569E-01, IMY = 1.171732314646718E-01
Spacecraft aspect plot

Bright source in the pre-burst/pre-slew/post-slew images
Pre-burst image of 15-350 keV band
Time interval of the image:
-239.104000 -16.504000

# RAcent  DECcent POSerr Theta    Phi  PeakCts   SNR AngSep     Name
#  [deg]    [deg]    ['] [deg]  [deg]                   [']
288.7255  10.7719   24.0  49.1  -45.5   0.3586   0.5   11.3	GRS 1915+105
299.5718  35.2126    0.5  50.8  -10.9   8.2379  22.6    1.1	Cyg X-1
308.2236  40.9992   21.7  50.2    0.7   0.2015   0.5    5.8	Cyg X-3
326.0558  38.2722    2.9  41.6   16.1   1.0354   3.9    6.2	Cyg X-2
342.4915  13.8394    2.9  17.2   48.9   0.6007   4.0 ------	UNKNOWN
357.7319 -57.2298    3.5  57.5 -165.4   2.6515   3.3 ------	UNKNOWN
296.5605  -4.4317    4.7  39.7  -66.0   1.1499   2.5 ------	UNKNOWN
300.6208 -24.7240    4.3  41.1  -98.1   2.2764   2.7 ------	UNKNOWN
Pre-slew background subtracted image of 15-350 keV band
Time interval of the image:
-16.504000 105.196600

# RAcent  DECcent POSerr Theta    Phi  PeakCts   SNR AngSep     Name
#  [deg]    [deg]    ['] [deg]  [deg]                   [']
288.7232  10.7781    5.4  49.1  -45.5   1.0855   2.2   11.0	GRS 1915+105
299.5666  35.2261    1.2  50.8  -10.9  -2.7248  -9.7    1.9	Cyg X-1
308.1556  41.0238    3.9  50.3    0.6   0.8435   3.0    4.7	Cyg X-3
326.0372  38.2702    6.0  41.6   16.0  -0.3863  -1.9    7.0	Cyg X-2
  3.5978  29.4250    2.2  41.1   65.6   2.5420   5.3 ------	UNKNOWN
  0.9952   0.0213    2.0  24.8  113.2   0.9188   5.8   59.7	UNKNOWN
323.9115   6.8727    0.8  15.4  -25.2   1.7817  15.0 ------	UNKNOWN
290.3735  14.8060    2.3  48.5  -39.7   1.7162   4.9 ------	UNKNOWN
Post-slew image of 15-350 keV band
Time interval of the image:
250.396600 963.006000

# RAcent  DECcent POSerr Theta    Phi  PeakCts   SNR AngSep     Name
#  [deg]    [deg]    ['] [deg]  [deg]                   [']
135.4706 -40.5681    4.9  32.3 -161.9   0.9062   2.4    2.8	Vela X-1
170.2856 -60.7002    2.7  33.7 -106.7   2.5454   4.3    4.7	Cen X-3
186.6906 -62.7661    3.0  38.5  -95.7   5.3173   3.9    1.0	GX 301-2
 67.4579 -36.3564    3.0  31.2   85.0   2.3136   3.8 ------	UNKNOWN
  5.9248 -73.6540    3.1  31.6  -15.9   1.3724   3.7 ------	UNKNOWN
174.2359 -47.0567    3.0  44.8 -119.9   6.1673   3.9 ------	UNKNOWN