Analysis Summary
Notes:
- 1) No attempt has been made to eliminate the non-significant decimal places.
- 2) This batgrbproduct analysis is done using the HEASARC data.
- 3) This batgrbproduct analysis is using the flight position for the mask-weighting calculation.
======================================================================
                  BAT GRB EVENT DATA PROCESSING REPORT
    Process Script Ver: batgrbproduct v2.46
    Process Start Time: Wed Jan 22 11:35:04 EST 2014
             Host Name: batevent1
   Current Working Dir: /local/data/batevent/batevent_reproc/trigger241840
======================================================================

  Trigger: 00241840      Segment: 000

  BAT Trigger Time: 186681518.428   [s; MET]
      Trigger Stop: 186681518.492   [s; MET]
               UTC: 2006-12-01T15:58:36.821720    [includes UTCF correction]
       Where From?: (*SHORT BURST*) TDRSS scaled map message

  BAT
    RA: 331.971646734012   Dec: -74.6005732902225  [deg; J2000]

     Catalogged Source?: NO
     Point Source?:      YES
     GRB Indicated?:     YES    [ by BAT flight software ]
     Image S/N Ratio:    7.37
     Image Trigger?:     NO
     Rate S/N Ratio:     42.9301758673314  [ if not an image trigger ]
     Image S/N Ratio:    7.37

  Analysis Position:   [ source = BAT ]
    RA: 331.971646734012   Dec: -74.6005732902225  [deg; J2000]

  Refined Position:   [ source = BAT pre-slew burst ]
    RA: 332.088228865842   Dec: -74.5733570118188  [deg; J2000]
        { 22h 08m 21.2s , -74d 34' 24.1" }
         +/- 1.20335150626368 [arcmin] (estimated 90% radius based on SNR)
         +/- 0.499899316950663 [arcmin] (formal 1-sigma fit error)
    SNR: 23.349196654757

  Angular difference between the analysis and refined position is 2.474427 arcmin

  Partial Coding Fraction: 0.4804688    [ including projection effects ]

  Duration
     T90: 0.776000022888184 +/- 0.0950789192059972
        Measured from: 0.0119999945163727
                   to: 0.788000017404556     [s; relative to TRIGTIME]
     T50: 0.431999981403351 +/- 0.0505964225831327
        Measured from: 0.15200001001358
                   to: 0.583999991416931     [s; relative to TRIGTIME]


  Fluence
     Peak Flux  (peak 1 second)
        Measured from: -0.0740000009536743
                   to: 0.925999999046326     [s; relative to TRIGTIME]
     Total Fluence
        Measured from: 0
                   to: 0.851999998092651     [s; relative to TRIGTIME]

             Band 1     Band 2     Band 3     Band 4
              15-25      25-50     50-100    100-350     keV
 Total     0.066411   0.120513   0.165092   0.081191
           0.008532   0.010047   0.010875   0.010361 [error]
 Peak      0.069983   0.129060   0.172554   0.079709
           0.009118   0.010519   0.011191   0.010631 [error]

     [ fluence units of on-axis counts / fully illuminated detector ]

======================================================================


====== Table of the duration information =============================

        Value   tstart    tstop
T100    0.852    0.000    0.852
T90     0.776    0.012    0.788
T50     0.432    0.152    0.584
Peak    1.000   -0.074    0.926


====== Spectral Analysis Summary =====================================

Model      : spectral model: simple power-law (PL) and cutoff power-law (CPL)
Ph_index   : photon index: E^{Ph_index}
Ph_90err   : 90% error of the photon index
Epeak      : Epeak in keV
Epeak_90err: 90% error of Epeak
Norm       : normalization at 50 keV in both the PL model and CPL model
Nomr_90err : 90% error of the normalization
chi2       : Chi-Squared
dof        : degree of freedo

=== Time-averaged spectral analysis ===
(Best model with acceptable fit: N/A)

Model Ph_index Ph_90err_low Ph_90err_hi  Epeak  Epeak_90err_low  Epeak_90err_hi  Norm       Nomr_90err_low    Norm_90err_hi    chi2    dof
PL      -0.796    -0.141      0.145       -           -               -         3.42e-02     -2.72e-03          2.69e-03      50.990   57
CPL     -0.715    -0.216      0.333      982.028    -982.028      -982.028      3.69e-02     -5.18e-03          1.08e-02      51.430   56


=== 1-s peak spectral analysis ===
(Best model with acceptable fit: PL)

Model Ph_index Ph_90err_low Ph_90err_hi  Epeak  Epeak_90err_low  Epeak_90err_hi  Norm       Nomr_90err_low    Norm_90err_hi    chi2    dof
PL      -0.832     -0.140     0.143       -           -               -         3.08e-02     -2.41e-03          2.38e-03      53.930   57
CPL     -0.756     -0.211     0.301     1082.170    -1082.170      -1082.170      3.30e-02     -4.39e-03          8.57e-03      54.390   56


=== Fluence/Peak Flux Summary ===

              Model    Band1     Band2     Band3     Band4     Band5     Total
                       15-25     25-50    50-100    100-350    15-150    15-350    keV
Fluence         PL   1.93e-08  5.48e-08  1.26e-07  7.86e-07  3.41e-07  9.86e-07   erg/cm2
      90%_error_low -3.26e-09 -5.61e-09 -1.01e-08 -1.44e-07 -2.77e-08 -1.48e-07   erg/cm2
      90%_error_hi   3.48e-09  5.53e-09  1.01e-08  1.67e-07  2.78e-08  1.69e-07   erg/cm2
Peak flux       PL   6.71e-01  1.01e+00  1.13e+00  2.41e+00  3.53e+00  5.22e+00   ph/cm2/s
      90%_error_low -1.13e-01 -1.05e-01 -8.79e-02 -4.07e-01 -2.71e-01 -4.45e-01   ph/cm2/s
      90%_error_hi   1.21e-01  1.04e-01  8.74e-02  4.61e-01  2.72e-01  4.64e-01   ph/cm2/s

Fluence        CPL   1.93e-08  5.47e-08  1.25e-07  8.27e-07  3.42e-07  9.78e-07   erg/cm2
      90%_error_low    N/A    -5.51e-09    N/A    -3.36e-07 -3.48e-08 -2.77e-07   erg/cm2
      90%_error_hi     N/A     5.64e-09    N/A     3.32e-08  3.37e-08  7.48e-08   erg/cm2
Peak flux      CPL   6.70e-01  1.01e+00  1.13e+00  2.39e+00  3.55e+00  5.32e+00   ph/cm2/s
      90%_error_low     N/A   -1.05e-01     N/A       N/A   -3.90e-01 -1.00e+00   ph/cm2/s
      90%_error_hi      N/A    1.04e-01     N/A       N/A    3.53e-01  4.46e-01   ph/cm2/s

======================================================================
Image
Pre-slew 15.0-350.0 keV image (Event data)
#   RAcent    DECcent   POSerr    Theta     Phi              Peak Cts       SNR   Name
  332.0882   -74.5734   0.0082    38.1198   -34.5089         0.4478653     23.349 TRIG_00241840

Foreground time interval of the image:
  0.000   0.852 (delta_t =   0.852 [sec])
Background time interval of the image:
-239.428   0.000 (delta_t = 239.428 [sec])
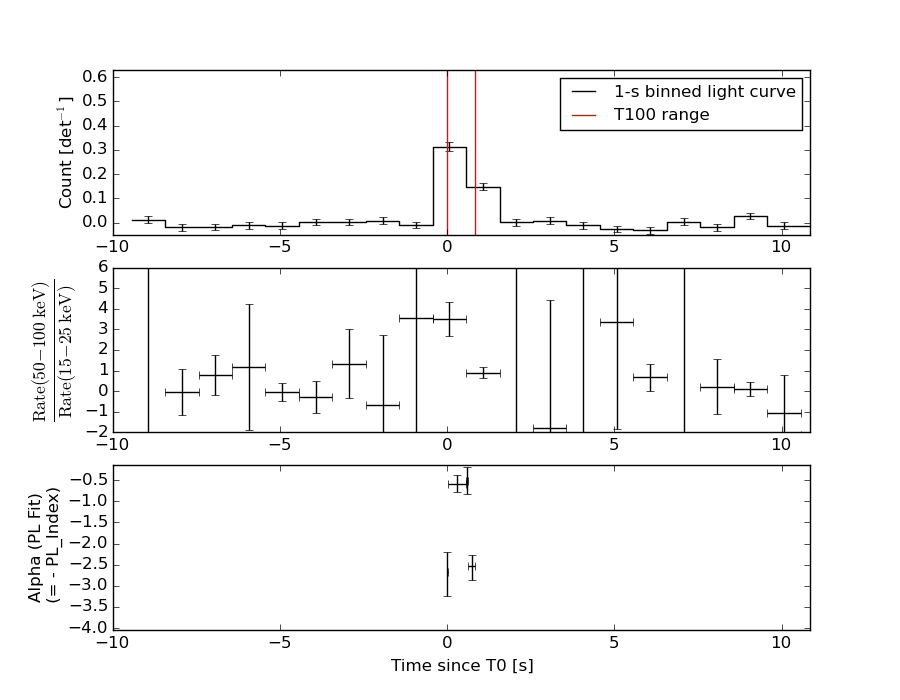
Light Curves
Note: The mask-weighted lightcurves have units of either count/det or counts/sec/det, where a det is 0.4 x 0.4 = 0.16 sq cm.
Full-time range; 1 s binning
Other quick-look light curves:
- 64 ms binning (zoomed)
- 16 ms binning (zoomed)
- 8 ms binning (zoomed)
- 2 ms binning (zoomed)
- SN=5 or 10 s binning (full-time range)
- Raw light curve
Spectra
- 64 ms binning (zoomed)
- 16 ms binning (zoomed)
- 8 ms binning (zoomed)
- 2 ms binning (zoomed)
- SN=5 or 10 s binning (full-time range)
- Raw light curve
Spectra
Notes:
- 1) The fitting includes the systematic errors.
- 2) When the burst includes telescope slew time periods, the fitting uses an average response file made from multiple 5-s response files through out the slew time plus single time preiod for the non-slew times, and weighted by the total counts in the corresponding time period using addrmf. An average response file is needed becuase a spectral fit using the pre-slew DRM will introduce some errors in both a spectral shape and a normalization if the PHA file contains a lot of the slew/post-slew time interval.
- 3) For fits to more complicated models (e.g. a power-law over a cutoff power-law), the BAT team has decided to require a chi-square improvement of more than 6 for each extra dof.
Time averaged spectrum fit using the average DRM
Power-law model
Time interval is from    0.000 sec. to    0.852 sec.

Spectral model in power-law:
------------------------------------------------------------
Parameters  : value       lower 90%   higher 90%
Photon index: -0.795758     ( -0.140615   0.144523 )
Norm@50keV  : 3.41811E-02    ( -0.0027168   0.00268913 )
------------------------------------------------------------
#Fit statistic : Chi-Squared =          50.99 using 59 PHA bins.
# Reduced chi-squared =         0.8946 for     57 degrees of freedom
# Null hypothesis probability =   6.986248e-01

Photon flux (15-150 keV)    in 0.852 sec: 8.17480E-02 (    ) ph/cm2/s
Energy fluence (15-150 keV)             : 3.40964e-07 ( -2.76867e-08  2.78005e-08 ) ergs/cm2
Cutoff power-law model
Time interval is from    0.000 sec. to    0.852 sec.
Spectral model in the cutoff power-law:
------------------------------------------------------------
Parameters  : value       lower 90%   higher 90%
Photon index: -0.788235     ( -0.215459   0.332688 )
Epeak [keV] : 9999.12      ( -9999.21 -9999.21 )
Norm@50keV  : 3.44242E-02    ( -0.00268666   0.0132685 )
------------------------------------------------------------
#Fit statistic : Chi-Squared =          51.03 using 59 PHA bins.
# Reduced chi-squared =         0.9112 for     56 degrees of freedom
# Null hypothesis probability =   6.630449e-01

Photon flux (15-150 keV)    in 0.852 sec: 3.92798 ( -0.30386  0.30414 ) ph/cm2/s
Energy fluence (15-150 keV)             : 3.4153e-07 ( -3.48331e-08  3.37016e-08 ) ergs/cm2
1-s peak spectrum fit
Power-law model
Time interval is from   -0.074 sec. to    0.926 sec.

Spectral model in power-law:
------------------------------------------------------------
Parameters  : value       lower 90%   higher 90%
Photon index: -0.832446     ( -0.139562   0.14335 )
Norm@50keV  : 3.07791E-02    ( -0.00240658   0.00238361 )
------------------------------------------------------------
#Fit statistic : Chi-Squared =          53.93 using 59 PHA bins.
# Reduced chi-squared =         0.9461 for     57 degrees of freedom
# Null hypothesis probability =   5.911627e-01

Photon flux (15-150 keV)    in 1 sec: 3.53422 ( -0.27098  0.27205 ) ph/cm2/s
Energy fluence (15-150 keV)             : 3.54903e-07 ( -2.84355e-08  2.85481e-08 ) ergs/cm2
Cutoff power-law model

Time interval is from   -0.074 sec. to    0.926 sec.
Spectral model in the cutoff power-law:
------------------------------------------------------------
Parameters  : value       lower 90%   higher 90%
Photon index: -0.825204     ( -0.211122   0.30074 )
Epeak [keV] : 9999.28      ( -9999.35 -9999.35 )
Norm@50keV  : 3.09909E-02    ( -0.00237706   0.0105885 )
------------------------------------------------------------
#Fit statistic : Chi-Squared =          53.97 using 59 PHA bins.
# Reduced chi-squared =         0.9637 for     56 degrees of freedom
# Null hypothesis probability =   5.521926e-01

Photon flux (15-150 keV)    in 1 sec: 3.55181 ( -0.3899  0.35318 ) ph/cm2/s
Energy fluence (15-150 keV)             : 3.55656e-07 ( -3.8991e-08  3.74322e-08 ) ergs/cm2
Time-resolved spectra
Distribution
T90 vs. Hardness ratio plot
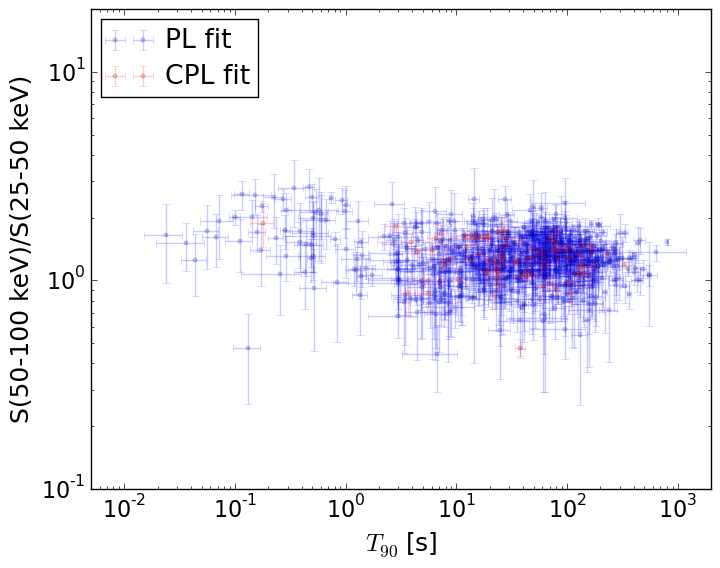
T90                                   = N/A sec.
Hardness ratio (energy fluence ratio) = N/A
S(15-50 keV) vs. S(50-150 keV) plot
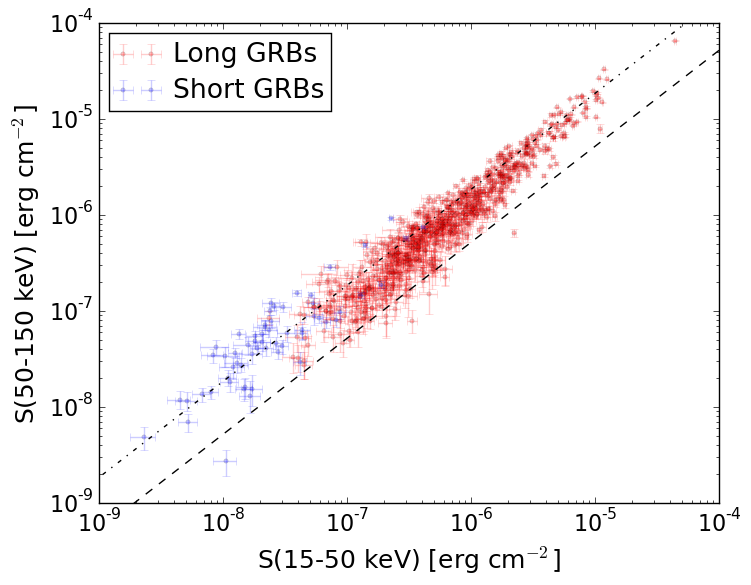
S(15-50 keV)  = N/A
S(50-150 keV) = N/A
The dash-dotted line and the dashed line traces the fluences calculated from the Band function with Epeak = 15 and 150 keV, respectively. Both lines assume a canonical values of alpha = -1 and beta = -2.5.
Mask shadow pattern
IMX = 6.465881737374078E-01, IMY = 4.445348528654993E-01
Spacecraft aspect plot
Bright source in the pre-burst/pre-slew/post-slew images
Pre-burst image of 15-350 keV band
Time interval of the image:
-239.428000 0.000000

# RAcent  DECcent POSerr Theta    Phi  PeakCts   SNR AngSep     Name
#  [deg]    [deg]    ['] [deg]  [deg]                   [']
135.5316 -40.5570    1.1  32.3 -169.2   1.8874  10.4    0.2	Vela X-1
170.2901 -60.6358    2.2  33.7 -114.1   1.6266   5.3    1.1	Cen X-3
186.6361 -62.7757    0.8  38.4 -103.0   9.0139  14.4    0.7	GX 301-2
 63.9656 -39.0122    3.5  30.1   70.5   0.8590   3.3 ------	UNKNOWN
124.0228 -15.5841    2.7  51.0  160.8   2.5039   4.3 ------	UNKNOWN
128.7407 -15.2960    2.9  52.6  166.2   2.7706   4.0 ------	UNKNOWN
145.2088 -15.5872    3.0  58.3 -175.7   4.3765   3.9 ------	UNKNOWN
153.3743 -18.4823    3.7  59.1 -166.0   3.8609   3.1 ------	UNKNOWN
Pre-slew background subtracted image of 15-350 keV band
Time interval of the image:
0.000000 0.852000

# RAcent  DECcent POSerr Theta    Phi  PeakCts   SNR AngSep     Name
#  [deg]    [deg]    ['] [deg]  [deg]                   [']
135.5795 -40.5808    3.6  32.3 -169.1   0.0459   3.2    2.8	Vela X-1
170.3100 -60.5191    6.7  33.8 -114.2  -0.0406  -1.7    6.2	Cen X-3
186.6645 -62.6365    5.2  38.5 -103.2  -0.0886  -2.2    8.0	GX 301-2
332.0882 -74.5734    0.5  38.1  -34.5   0.4478  23.4 ------	UNKNOWN
Post-slew image of 15-350 keV band
Time interval of the image:
65.272610 731.772590

# RAcent  DECcent POSerr Theta    Phi  PeakCts   SNR AngSep     Name
#  [deg]    [deg]    ['] [deg]  [deg]                   [']
170.2266 -60.6007    2.2  44.3 -166.6   3.0927   5.2    2.9	Cen X-3
186.6535 -62.7718    0.4  40.8 -155.8  17.7574  25.5    0.1	GX 301-2
 59.0871 -56.5690    3.1  35.7  110.2   3.1384   3.7 ------	UNKNOWN
 14.3065 -41.8278    4.4  37.9   55.5   2.3048   2.6 ------	UNKNOWN
351.3826 -31.5232    2.9  44.1   24.6   3.2574   4.0 ------	UNKNOWN
341.9726 -35.0396    2.8  39.8   13.5   2.2235   4.2 ------	UNKNOWN
338.4603 -35.4507    2.8  39.3    9.0   2.1655   4.2 ------	UNKNOWN
153.4392 -58.4657    2.5  46.9 -178.3   2.9112   4.6 ------	UNKNOWN
277.1551 -58.1842    2.6  25.9  -80.5   2.0880   4.4 ------	UNKNOWN
194.4511 -46.9262    5.2  55.2 -145.2   4.9440   2.2 ------	UNKNOWN