Analysis Summary
Notes:
- 1) No attempt has been made to eliminate the non-significant decimal places.
- 2) This batgrbproduct analysis is done using the HEASARC data.
- 3) This batgrbproduct analysis is using the flight position for the mask-weighting calculation.
======================================================================
BAT GRB EVENT DATA PROCESSING REPORT
Process Script Ver: batgrbproduct v2.46
Process Start Time: Wed Jan 22 11:31:19 EST 2014
Host Name: batevent1
Current Working Dir: /local/data/batevent/batevent_reproc/trigger241963
======================================================================
Trigger: 00241963 Segment: 000
BAT Trigger Time: 186739906.304 [s; MET]
Trigger Stop: 186739910.4 [s; MET]
UTC: 2006-12-02T08:11:44.696300 [includes UTCF correction]
Where From?: TDRSS position message
BAT
RA: 105.641791830877 Dec: -74.6649388439387 [deg; J2000]
Catalogged Source?: NO
Point Source?: YES
GRB Indicated?: YES [ by BAT flight software ]
Image S/N Ratio: 6.94
Image Trigger?: NO
Rate S/N Ratio: 9.74679434480896 [ if not an image trigger ]
Image S/N Ratio: 6.94
Analysis Position: [ source = BAT ]
RA: 105.641791830877 Dec: -74.6649388439387 [deg; J2000]
Refined Position: [ source = BAT pre-slew image ]
RA: 105.642 Dec: -74.6649 [deg; J2000]
{ 07h 02m 34.1s , -74d -39' -53.6" }
+/- 2.48670977171 [arcmin] (estimated 90% radius based on SNR)
SNR: 8.27935457044
Angular difference between the analysis and refined position is 0.004043 arcmin
Partial Coding Fraction: 0.765625 [ including projection effects ]
Duration
T90: 94.1879999935627 +/- 35.3442464923337
Measured from: 37.2120000123978
to: 131.40000000596 [s; relative to TRIGTIME]
T50: 17.4399999976158 +/- 1.71047128399638
Measured from: 76.6440000236034
to: 94.0840000212193 [s; relative to TRIGTIME]
Fluence
Peak Flux (peak 1 second)
Measured from: 75.0400000214577
to: 76.0400000214577 [s; relative to TRIGTIME]
Total Fluence
Measured from: -0.831999987363815
to: 147.444000005722 [s; relative to TRIGTIME]
Band 1 Band 2 Band 3 Band 4
15-25 25-50 50-100 100-350 keV
Total 1.698731 2.173458 1.564226 0.368091
0.061643 0.063364 0.055184 0.047288 [error]
Peak 0.076367 0.114029 0.091669 0.027152
0.006068 0.006617 0.005956 0.004440 [error]
[ fluence units of on-axis counts / fully illuminated detector ]
======================================================================
====== Table of the duration information =============================
Value tstart tstop
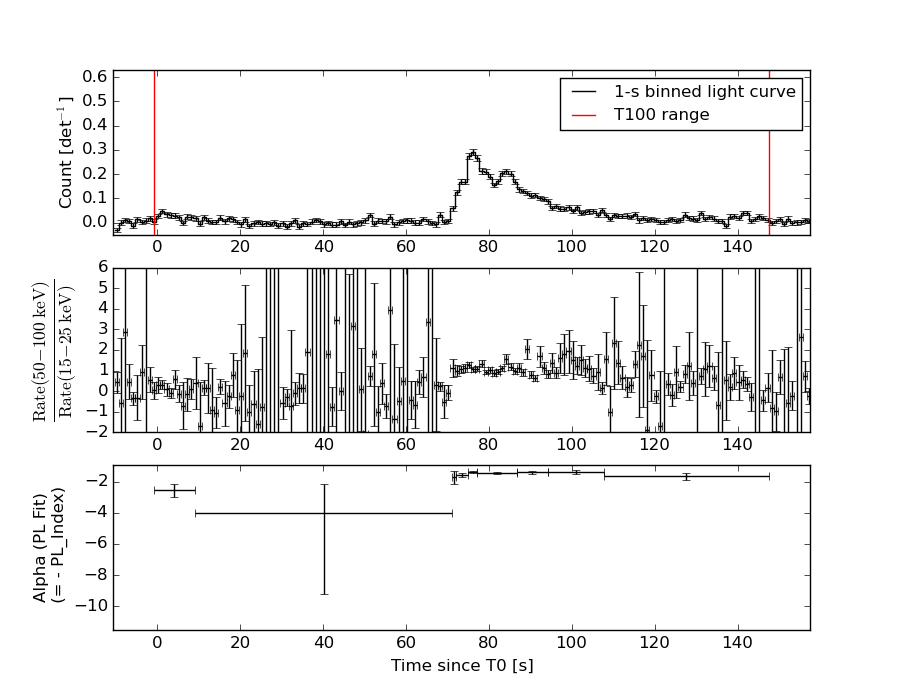
T100 148.276 -0.832 147.444
T90 94.188 37.212 131.400
T50 17.440 76.644 94.084
Peak 1.000 75.040 76.040
====== Spectral Analysis Summary =====================================
Model : spectral model: simple power-law (PL) and cutoff power-law (CPL)
Ph_index : photon index: E^{Ph_index}
Ph_90err : 90% error of the photon index
Epeak : Epeak in keV
Epeak_90err: 90% error of Epeak
Norm : normalization at 50 keV in both the PL model and CPL model
Nomr_90err : 90% error of the normalization
chi2 : Chi-Squared
dof : degree of freedo
=== Time-averaged spectral analysis ===
(Best model with acceptable fit: N/A)
Model Ph_index Ph_90err_low Ph_90err_hi Epeak Epeak_90err_low Epeak_90err_hi Norm Nomr_90err_low Norm_90err_hi chi2 dof
PL -1.548 -0.069 0.068 - - - 2.47e-03 -8.82e-05 8.81e-05 71.200 57
CPL -1.443 -0.145 0.265 276.708 -276.708 -276.708 2.78e-03 -3.77e-04 9.14e-04 70.700 56
=== 1-s peak spectral analysis ===
(Best model with acceptable fit: PL)
Model Ph_index Ph_90err_low Ph_90err_hi Epeak Epeak_90err_low Epeak_90err_hi Norm Nomr_90err_low Norm_90err_hi chi2 dof
PL -1.329 -0.112 0.112 - - - 2.06e-02 -1.29e-03 1.29e-03 47.900 57
CPL -1.225 -0.161 0.443 397.643 -397.643 -397.643 2.31e-02 -3.66e-03 1.41e-02 47.710 56
=== Fluence/Peak Flux Summary ===
Model Band1 Band2 Band3 Band4 Band5 Total
15-25 25-50 50-100 100-350 15-150 15-350 keV
Fluence PL 4.90e-07 8.74e-07 1.19e-06 3.38e-06 3.45e-06 5.94e-06 erg/cm2
90%_error_low -3.28e-08 -3.39e-08 -5.60e-08 -3.46e-07 -1.33e-07 -3.83e-07 erg/cm2
90%_error_hi 3.37e-08 3.38e-08 5.59e-08 3.73e-07 1.33e-07 4.05e-07 erg/cm2
Peak flux PL 7.20e-01 8.02e-01 6.39e-01 8.43e-01 2.47e+00 3.00e+00 ph/cm2/s
90%_error_low -8.37e-02 -5.73e-02 -4.86e-02 -1.29e-01 -1.59e-01 -1.94e-01 ph/cm2/s
90%_error_hi 8.70e-02 5.68e-02 4.83e-02 1.43e-01 1.59e-01 1.95e-01 ph/cm2/s
Fluence CPL 4.79e-07 8.80e-07 1.20e-06 2.89e-06 3.42e-06 5.45e-06 erg/cm2
90%_error_low -4.13e-08 -3.73e-08 -5.91e-08 -8.90e-07 -1.51e-07 -9.01e-07 erg/cm2
90%_error_hi 3.55e-08 3.77e-08 5.97e-08 5.83e-07 1.50e-07 6.27e-07 erg/cm2
Peak flux CPL 7.04e-01 8.09e-01 6.46e-01 7.47e-01 2.46e+00 2.91e+00 ph/cm2/s
90%_error_low -1.03e-01 -6.07e-02 -5.38e-02 -2.81e-01 -1.66e-01 -3.36e-01 ph/cm2/s
90%_error_hi 9.07e-02 6.34e-02 5.60e-02 1.14e-01 1.65e-01 2.75e-01 ph/cm2/s
======================================================================
Image
Pre-slew 15.0-50.0 keV image (Event data)
#RAcent DECcent POSerr Theta  Phi  Peak_Cts  SNR Name
105.642 -74.665 0.000 28.226 166.458 0.135 8.279 TRIG_00241963

Image time interval: 0.000 to 4.096 [sec]
Light Curves
Note: The mask-weighted lightcurves have units of either count/det or counts/sec/det, where a det is 0.4 x 0.4 = 0.16 sq cm.
Full-time range; 1 s binning
Other quick-look light curves:
- 64 ms binning (zoomed)
- 16 ms binning (zoomed)
- 8 ms binning (zoomed)
- 2 ms binning (zoomed)
- SN=5 or 10 s binning (full-time range)
- Raw light curve
Spectra
- 64 ms binning (zoomed)
- 16 ms binning (zoomed)
- 8 ms binning (zoomed)
- 2 ms binning (zoomed)
- SN=5 or 10 s binning (full-time range)
- Raw light curve
Spectra
Notes:
- 1) The fitting includes the systematic errors.
- 2) When the burst includes telescope slew time periods, the fitting uses an average response file made from multiple 5-s response files through out the slew time plus single time preiod for the non-slew times, and weighted by the total counts in the corresponding time period using addrmf. An average response file is needed becuase a spectral fit using the pre-slew DRM will introduce some errors in both a spectral shape and a normalization if the PHA file contains a lot of the slew/post-slew time interval.
- 3) For fits to more complicated models (e.g. a power-law over a cutoff power-law), the BAT team has decided to require a chi-square improvement of more than 6 for each extra dof.
Time averaged spectrum fit using the average DRM
Power-law model

Time interval is from   -0.832 sec. to  147.444 sec.

Spectral model in power-law:
------------------------------------------------------------
Parameters  : value       lower 90%   higher 90%
Photon index: -1.54818     ( -0.0685422   0.0683094 )
Norm@50keV  : 2.47113E-03    ( -8.82115e-05   8.80533e-05 )
------------------------------------------------------------
#Fit statistic : Chi-Squared =          71.20 using 59 PHA bins.
# Reduced chi-squared =          1.249 for     57 degrees of freedom
# Null hypothesis probability =   9.769402e-02

Photon flux (15-150 keV)    in 148.3 sec: 0.312675 ( -0.011775  0.011824 ) ph/cm2/s
Energy fluence (15-150 keV)             : 3.45137e-06 ( -1.328e-07  1.33233e-07 ) ergs/cm2
Cutoff power-law model
Time interval is from   -0.832 sec. to  147.444 sec.
Spectral model in the cutoff power-law:
------------------------------------------------------------
Parameters  : value       lower 90%   higher 90%
Photon index: -1.44299     ( -0.144825   0.265303 )
Epeak [keV] : 276.708      ( -276.703 -276.703 )
Norm@50keV  : 2.77529E-03    ( -0.000377183   0.00091383 )
------------------------------------------------------------
#Fit statistic : Chi-Squared =          70.70 using 59 PHA bins.
# Reduced chi-squared =          1.263 for     56 degrees of freedom
# Null hypothesis probability =   8.926002e-02

Photon flux (15-150 keV)    in 148.3 sec: 0.310284 ( -0.013022  0.013047 ) ph/cm2/s
Energy fluence (15-150 keV)             : 3.42106e-06 ( -1.51334e-07  1.50363e-07 ) ergs/cm2
1-s peak spectrum fit
Power-law model
Time interval is from   75.040 sec. to   76.040 sec.

Spectral model in power-law:
------------------------------------------------------------
Parameters  : value       lower 90%   higher 90%
Photon index: -1.32887     ( -0.112059   0.11204 )
Norm@50keV  : 2.06147E-02    ( -0.00129127   0.00128987 )
------------------------------------------------------------
#Fit statistic : Chi-Squared =          47.90 using 59 PHA bins.
# Reduced chi-squared =         0.8403 for     57 degrees of freedom
# Null hypothesis probability =   7.993613e-01

Photon flux (15-150 keV)    in 1 sec: 2.47297 ( -0.15898  0.1593 ) ph/cm2/s
Energy fluence (15-150 keV)             : 2.02339e-07 ( -1.41215e-08  1.42019e-08 ) ergs/cm2
Cutoff power-law model

Time interval is from   75.040 sec. to   76.040 sec.
Spectral model in the cutoff power-law:
------------------------------------------------------------
Parameters  : value       lower 90%   higher 90%
Photon index: -1.22503     ( -0.160489   0.443054 )
Epeak [keV] : 397.643      ( -397.875 -397.875 )
Norm@50keV  : 2.31243E-02    ( -0.003662   0.0141079 )
------------------------------------------------------------
#Fit statistic : Chi-Squared =          47.71 using 59 PHA bins.
# Reduced chi-squared =         0.8520 for     56 degrees of freedom
# Null hypothesis probability =   7.768184e-01

Photon flux (15-150 keV)    in 1 sec: 2.46086 ( -0.16597  0.16511 ) ph/cm2/s
Energy fluence (15-150 keV)             : 2.00969e-07 ( -1.5257e-08  1.45423e-08 ) ergs/cm2
Time-resolved spectra
Distribution
T90 vs. Hardness ratio plot
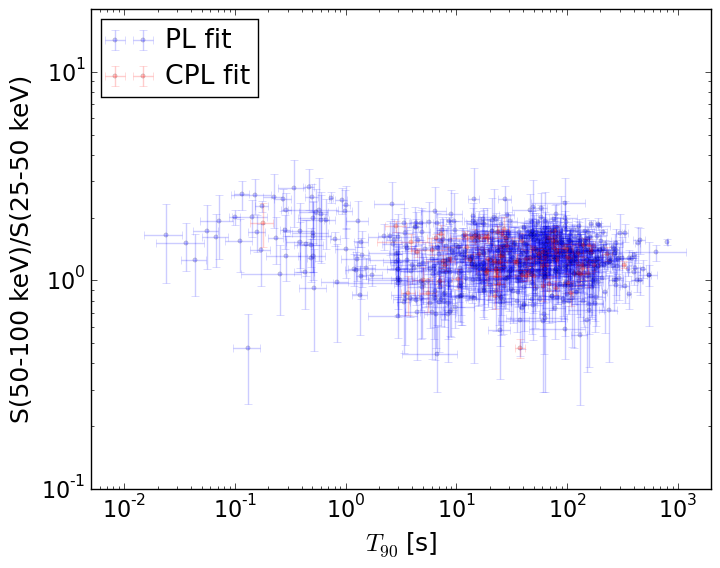
T90                                   = N/A sec.
Hardness ratio (energy fluence ratio) = N/A
S(15-50 keV) vs. S(50-150 keV) plot
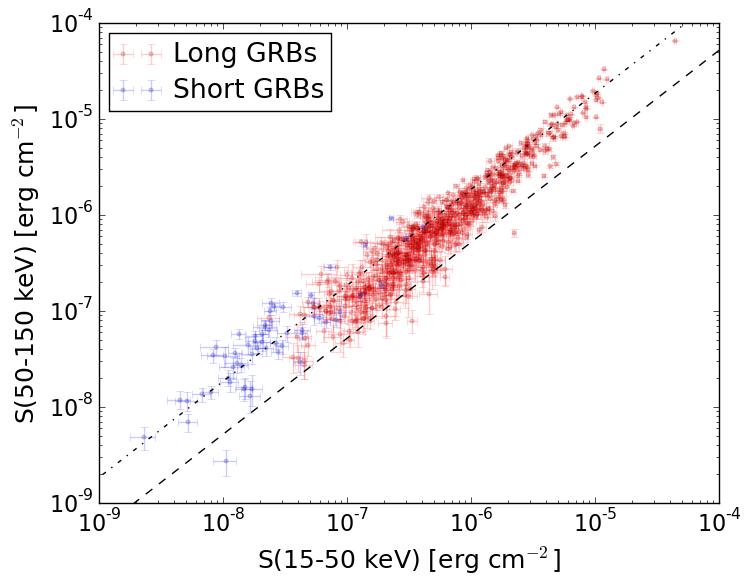
S(15-50 keV)  = N/A
S(50-150 keV) = N/A
The dash-dotted line and the dashed line traces the fluences calculated from the Band function with Epeak = 15 and 150 keV, respectively. Both lines assume a canonical values of alpha = -1 and beta = -2.5.
Mask shadow pattern
IMX = -0.521859731562, IMY = -0.125693945614
Spacecraft aspect plot
Bright source in the pre-burst/pre-slew/post-slew images
Pre-burst image of 15-350 keV band
Time interval of the image:
-239.304000 -0.832000

# RAcent  DECcent POSerr Theta    Phi  PeakCts   SNR AngSep     Name
#  [deg]    [deg]    ['] [deg]  [deg]                   [']
170.2902 -60.5736   23.7  44.3 -156.9   0.1543   0.5    3.1	Cen X-3
186.6238 -62.7587    1.3  40.8 -146.2   2.3748   8.7    1.1	GX 301-2
264.8292 -44.3470   22.9  41.6  -72.7  -0.3080  -0.5    7.2	4U 1735-44
340.0754 -25.7268    2.6  49.0   19.9   1.9822   4.4 ------	UNKNOWN
 15.0627 -63.7776    2.7  18.1   86.8   0.6812   4.2 ------	UNKNOWN
Pre-slew background subtracted image of 15-350 keV band
Time interval of the image:
-0.832000 54.596600

# RAcent  DECcent POSerr Theta    Phi  PeakCts   SNR AngSep     Name
#  [deg]    [deg]    ['] [deg]  [deg]                   [']
170.2968 -60.7284    9.2  44.2 -157.0   0.1636   1.3    6.3	Cen X-3
186.6025 -62.6106    6.3  41.0 -146.2  -0.2182  -1.8    9.7	GX 301-2
264.8368 -44.3526   16.1  41.6  -72.7   0.1967   0.7    7.1	4U 1735-44
332.9432 -18.8651    1.8  55.7   11.4   2.4648   6.3 ------	UNKNOWN
126.8379 -51.0143    2.2  53.3  170.8   1.3104   5.2 ------	UNKNOWN
313.1006 -24.6030    2.7  50.9  -12.0   0.6791   4.3 ------	UNKNOWN
Post-slew image of 15-350 keV band
Time interval of the image:
107.796590 962.747400

# RAcent  DECcent POSerr Theta    Phi  PeakCts   SNR AngSep     Name
#  [deg]    [deg]    ['] [deg]  [deg]                   [']
135.5541 -40.5610    0.6  36.8  164.0  14.2155  20.4    1.2	Vela X-1
170.6219 -60.6706   27.7  26.4 -141.3   0.1942   0.4    9.4	Cen X-3
186.6645 -62.7726    0.4  28.8 -125.1  14.4566  28.7    0.3	GX 301-2
 67.3500 -44.4523    3.4  34.6   73.6   2.7400   3.4 ------	UNKNOWN
 63.0654 -72.5720    3.3  11.9   23.8   1.3543   3.5 ------	UNKNOWN
135.8986 -68.9220    2.7  10.9 -161.6   1.5770   4.2 ------	UNKNOWN
164.1251 -27.7202    2.6  55.2 -168.4   5.8235   4.4 ------	UNKNOWN
335.5179 -44.7198    3.2  56.1  -14.4   6.4500   3.7 ------	UNKNOWN
201.5975 -61.2802    3.1  33.6 -114.9   2.5083   3.7 ------	UNKNOWN
323.2027 -43.7999    4.5  58.9  -24.3   8.4957   2.6 ------	UNKNOWN
260.9526 -65.7671    3.9  38.7  -71.2   3.5468   3.0 ------	UNKNOWN
204.7661 -49.7861    2.9  44.8 -120.0   8.2177   4.0 ------	UNKNOWN