Analysis Summary
Notes:
- 1) No attempt has been made to eliminate the non-significant decimal places.
- 2) This batgrbproduct analysis is done using the HEASARC data.
- 3) This batgrbproduct analysis is using the flight position for the mask-weighting calculation.
======================================================================
                  BAT GRB EVENT DATA PROCESSING REPORT
    Process Script Ver: batgrbproduct v2.46
    Process Start Time: Wed Jan 22 11:19:01 EST 2014
             Host Name: batevent1
   Current Working Dir: /local/data/batevent/batevent_reproc/trigger251863
======================================================================

  Trigger: 00251863      Segment: 000

  BAT Trigger Time: 188107507.456   [s; MET]
      Trigger Stop: 188107511.552   [s; MET]
               UTC: 2006-12-18T04:05:05.815160    [includes UTCF correction]
       Where From?: TDRSS position message

  BAT
    RA: 149.222968728283   Dec: -35.146298988644  [deg; J2000]

     Catalogged Source?: NO
     Point Source?:      YES
     GRB Indicated?:     YES    [ by BAT flight software ]
     Image S/N Ratio:    6.71
     Image Trigger?:     NO
     Rate S/N Ratio:     9  [ if not an image trigger ]
     Image S/N Ratio:    6.71

  Analysis Position:   [ source = BAT ]
    RA: 149.222968728283   Dec: -35.146298988644  [deg; J2000]

  Refined Position:   [ source = BAT pre-slew burst ]
    RA: 149.246845484682   Dec: -35.2219068502434  [deg; J2000]
        { 09h 56m 59.2s , -35d 13' 18.9" }
         +/- 3.9382942658473 [arcmin] (estimated 90% radius based on SNR)
         +/- 2.72801583102233 [arcmin] (formal 1-sigma fit error)
    SNR: 4.29218217826145

  Angular difference between the analysis and refined position is 4.685139 arcmin

  Partial Coding Fraction: 0.9921875    [ including projection effects ]

  Duration
     T90: N/A +/- N/A
        Measured from: N/A
                   to: N/A     [s; relative to TRIGTIME]
     T50: N/A +/- N/A
        Measured from: N/A
                   to: N/A     [s; relative to TRIGTIME]

    WARNING: battblocks failed.  Used TDRSS fore/background intervals

======================================================================


====== Table of the duration information =============================

        Value   tstart    tstop
T100     N/A      N/A      N/A
T90      N/A      N/A      N/A
T50      N/A      N/A      N/A
Peak     N/A      N/A      N/A


====== Spectral Analysis Summary =====================================

Model      : spectral model: simple power-law (PL) and cutoff power-law (CPL)
Ph_index   : photon index: E^{Ph_index}
Ph_90err   : 90% error of the photon index
Epeak      : Epeak in keV
Epeak_90err: 90% error of Epeak
Norm       : normalization at 50 keV in both the PL model and CPL model
Nomr_90err : 90% error of the normalization
chi2       : Chi-Squared
dof        : degree of freedo

=== Time-averaged spectral analysis ===
(Best model with acceptable fit: N/A)

Model Ph_index Ph_90err_low Ph_90err_hi  Epeak  Epeak_90err_low  Epeak_90err_hi  Norm       Nomr_90err_low    Norm_90err_hi    chi2    dof
PL      -2.607    -0.656      0.514       -           -               -         1.02e-03     -4.82e-04          5.06e-04      73.730   57
CPL      0.865    -2.848      7.891       24.595      N/A           N/A         2.75e-01        N/A               N/A         70.610   56


=== 1-s peak spectral analysis ===
(Best model with acceptable fit: N/A)

Model Ph_index Ph_90err_low Ph_90err_hi  Epeak  Epeak_90err_low  Epeak_90err_hi  Norm       Nomr_90err_low    Norm_90err_hi    chi2    dof
PL      N/A         N/A       N/A          -           -               -           N/A           N/A               N/A         N/A        N/A
CPL     N/A         N/A       N/A          N/A         N/A           N/A           N/A           N/A               N/A         N/A        N/A


=== Fluence/Peak Flux Summary ===

              Model    Band1     Band2     Band3     Band4     Band5     Total
                       15-25     25-50    50-100    100-350    15-150    15-350    keV
Fluence         PL   1.53e-08  1.44e-08  9.46e-09  9.63e-09  4.31e-08  4.88e-08   erg/cm2
      90%_error_low -4.53e-09 -5.00e-09 -5.34e-09 -7.25e-09 -1.46e-08 -1.88e-08   erg/cm2
      90%_error_hi   4.56e-09  4.80e-09  6.75e-09  1.61e-08  1.62e-08  2.55e-08   erg/cm2
Peak flux       PL     N/A      N/A      N/A      N/A      N/A      N/A     ph/cm2/s
Image
Pre-slew 15.0-350.0 keV image (Event data)
#   RAcent    DECcent   POSerr    Theta     Phi              Peak Cts       SNR   Name
  149.2468   -35.2219   0.0445    17.1608     5.5683         0.0817638      4.292 TRIG_00251863

Foreground time interval of the image:
  0.000   4.096 (delta_t =   4.096 [sec])
Background time interval of the image:
-239.456 -19.456 (delta_t = 220.000 [sec])
Light Curves
Note: The mask-weighted lightcurves have units of either count/det or counts/sec/det, where a det is 0.4 x 0.4 = 0.16 sq cm.
Full-time range; 1 s binning
Other quick-look light curves:
- 64 ms binning (zoomed)
- 16 ms binning (zoomed)
- 8 ms binning (zoomed)
- 2 ms binning (zoomed)
- SN=5 or 10 s binning (full-time range)
- Raw light curve
Spectra
- 64 ms binning (zoomed)
- 16 ms binning (zoomed)
- 8 ms binning (zoomed)
- 2 ms binning (zoomed)
- SN=5 or 10 s binning (full-time range)
- Raw light curve
Spectra
Notes:
- 1) The fitting includes the systematic errors.
- 2) When the burst includes telescope slew time periods, the fitting uses an average response file made from multiple 5-s response files through out the slew time plus single time preiod for the non-slew times, and weighted by the total counts in the corresponding time period using addrmf. An average response file is needed becuase a spectral fit using the pre-slew DRM will introduce some errors in both a spectral shape and a normalization if the PHA file contains a lot of the slew/post-slew time interval.
- 3) For fits to more complicated models (e.g. a power-law over a cutoff power-law), the BAT team has decided to require a chi-square improvement of more than 6 for each extra dof.
Time averaged spectrum fit using the average DRM
Power-law model

Time interval is from    0.000 sec. to    4.096 sec.

Spectral model in power-law:
------------------------------------------------------------
Parameters  : value       lower 90%   higher 90%
Photon index: -2.60735     ( -0.655933   0.51394 )
Norm@50keV  : 1.01917E-03    ( -0.000481522   0.000506339 )
------------------------------------------------------------
#Fit statistic : Chi-Squared =          73.73 using 59 PHA bins.
# Reduced chi-squared =          1.294 for     57 degrees of freedom
# Null hypothesis probability =   6.723593e-02

Photon flux (15-150 keV)    in 4.096 sec: 0.214168 ( -0.058873  0.059091 ) ph/cm2/s
Energy fluence (15-150 keV)             : 4.30756e-08 ( -1.46441e-08  1.61869e-08 ) ergs/cm2
Cutoff power-law model

Time interval is from    0.000 sec. to    4.096 sec.
Spectral model in the cutoff power-law:
------------------------------------------------------------
Parameters  : value       lower 90%   higher 90%
Photon index: 0.865357     ( -2.89185   7.84709 )
Epeak [keV] : 24.5945      (   )
Norm@50keV  : 0.274919    (     )
------------------------------------------------------------
#Fit statistic : Chi-Squared =          70.60 using 59 PHA bins.
# Reduced chi-squared =          1.261 for     56 degrees of freedom
# Null hypothesis probability =   9.062536e-02

Photon flux (15-150 keV)    in 4.096 sec: 0.212015 ( -0.055956  0.056357 ) ph/cm2/s
Energy fluence (15-150 keV)             : 3.60413e-08 ( -1.0443e-08  1.31253e-08 ) ergs/cm2
1-s peak spectrum fit
1-s peak spectrum unavailable, likely because there are no event data in the 1-s peak range.
Time-resolved spectra

Distribution
T90 vs. Hardness ratio plot
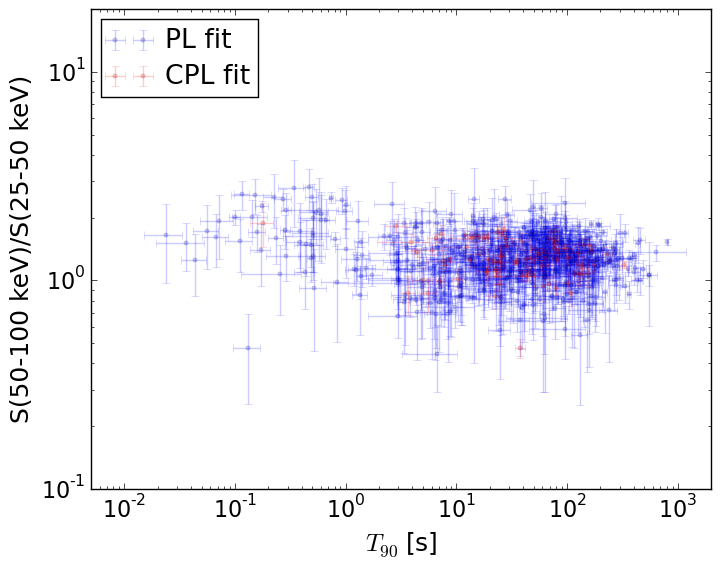
T90                                   = N/A sec.
Hardness ratio (energy fluence ratio) = N/A
S(15-50 keV) vs. S(50-150 keV) plot
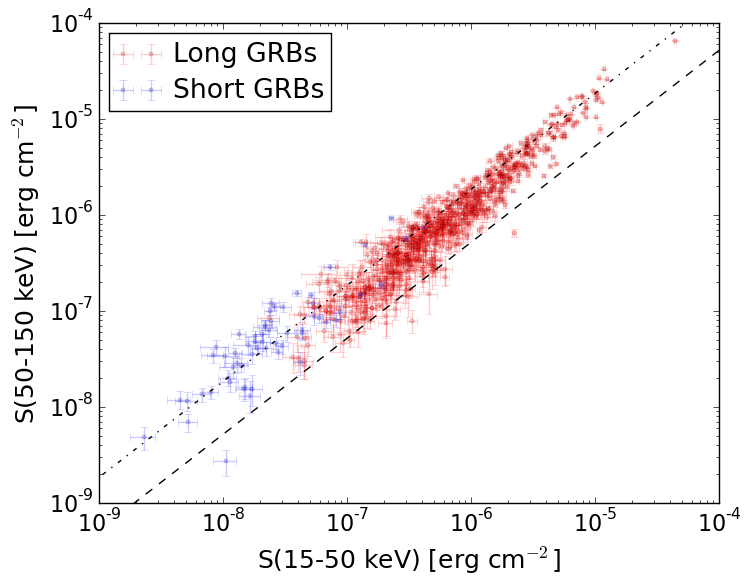
S(15-50 keV)  = N/A
S(50-150 keV) = N/A
The dash-dotted line and the dashed line traces the fluences calculated from the Band function with Epeak = 15 and 150 keV, respectively. Both lines assume a canonical values of alpha = -1 and beta = -2.5.
Mask shadow pattern
IMX = 3.073445483436223E-01, IMY = -2.996374789010648E-02
Spacecraft aspect plot
Bright source in the pre-burst/pre-slew/post-slew images
Pre-burst image of 15-350 keV band
Time interval of the image:
-239.456000 -19.456000

# RAcent  DECcent POSerr Theta    Phi  PeakCts   SNR AngSep     Name
#  [deg]    [deg]    ['] [deg]  [deg]                   [']
135.5333 -40.5594    0.1  28.7   14.9  15.8857  77.9    0.4	Vela X-1
170.3762 -60.6573    3.7  40.1  -34.4   1.0217   3.1    2.7	Cen X-3
186.8986 -62.8459    4.5  45.4  -43.4   1.4660   2.6    8.0	GX 301-2
139.2688  16.3255    2.5  42.8  122.5   3.5098   4.6 ------	UNKNOWN
190.6828  29.3098    3.0  58.3 -175.7   5.4174   3.8 ------	UNKNOWN
186.4443  17.5001    2.7  46.3 -171.5   1.4474   4.3 ------	UNKNOWN
118.3406 -69.0469    2.6  54.3   -9.7   2.6911   4.4 ------	UNKNOWN
Pre-slew background subtracted image of 15-350 keV band
Time interval of the image:
0.000000 4.096000

# RAcent  DECcent POSerr Theta    Phi  PeakCts   SNR AngSep     Name
#  [deg]    [deg]    ['] [deg]  [deg]                   [']
135.5372 -40.5749    1.2  28.7   14.9   0.2034   9.6    1.3	Vela X-1
169.9196 -60.7206    0.0  40.2  -34.0  -0.0668  -2.1   13.0	Cen X-3
186.8583 -62.6577   16.9  45.3  -43.6  -0.0329  -0.7    8.7	GX 301-2
135.2467  11.9269    2.2  41.3  114.1   0.4343   5.1 ------	UNKNOWN
120.9480 -54.0761    2.3  44.4    5.4   0.1689   4.9 ------	UNKNOWN
189.7887  23.0725    2.2  52.7 -172.2   0.2461   5.3 ------	UNKNOWN
166.8876 -45.1399    2.5  24.6  -37.9   0.0966   4.6 ------	UNKNOWN
193.0907 -49.1084    2.0  38.1  -61.7   0.2302   5.7 ------	UNKNOWN
Post-slew image of 15-350 keV band
Time interval of the image:
90.044600 542.244600

# RAcent  DECcent POSerr Theta    Phi  PeakCts   SNR AngSep     Name
#  [deg]    [deg]    ['] [deg]  [deg]                   [']
135.5300 -40.5516    0.1  12.1   25.0  24.7312  83.0    0.2	Vela X-1
170.3380 -60.6027    3.4  28.8  -55.8   1.5734   3.4    1.4	Cen X-3
186.6714 -62.7618   69.9  36.0  -62.6   0.1094   0.2    0.6	GX 301-2
177.8005  14.8309    3.2  56.9  179.2   6.5762   3.6 ------	UNKNOWN
 53.3959 -81.1324    3.4  56.2  -23.7   5.0524   3.4 ------	UNKNOWN