Analysis Summary
Notes:
- 1) No attempt has been made to eliminate the non-significant decimal places.
- 2) This batgrbproduct analysis is done using the HEASARC data.
- 3) This batgrbproduct analysis is using the flight position for the mask-weighting calculation.
======================================================================
BAT GRB EVENT DATA PROCESSING REPORT
Process Script Ver: batgrbproduct v2.46
Process Start Time: Wed Jun 24 00:37:32 EDT 2015
Host Name: bat1
Current Working Dir: /local/data/bat1/alien/Swift_3rdBATcatalog/event/batevent_reproc/trigger252588
======================================================================
Trigger: 00252588 Segment: 000
BAT Trigger Time: 188450933.76 [s; MET]
Trigger Stop: 188450937.856 [s; MET]
UTC: 2006-12-22T03:28:52.110840 [includes UTCF correction]
Where From?: TDRSS position message
BAT
RA: 358.243358155449 Dec: 46.5262619462849 [deg; J2000]
Catalogged Source?: NO
Point Source?: YES
GRB Indicated?: YES [ by BAT flight software ]
Image S/N Ratio: 7.21
Image Trigger?: NO
Rate S/N Ratio: 13.3790881602597 [ if not an image trigger ]
Image S/N Ratio: 7.21
Analysis Position: [ source = BAT ]
RA: 358.243358155449 Dec: 46.5262619462849 [deg; J2000]
Refined Position: [ source = BAT pre-slew burst ]
RA: 358.237373942495 Dec: 46.5158302015211 [deg; J2000]
{ 23h 52m 57.0s , +46d 30' 57.0" }
+/- 1.56229441093894 [arcmin] (estimated 90% radius based on SNR)
+/- 0.556574715650855 [arcmin] (formal 1-sigma fit error)
SNR: 16.0810449912385
Angular difference between the analysis and refined position is 0.672901 arcmin
Partial Coding Fraction: 0.703125 [ including projection effects ]
Duration
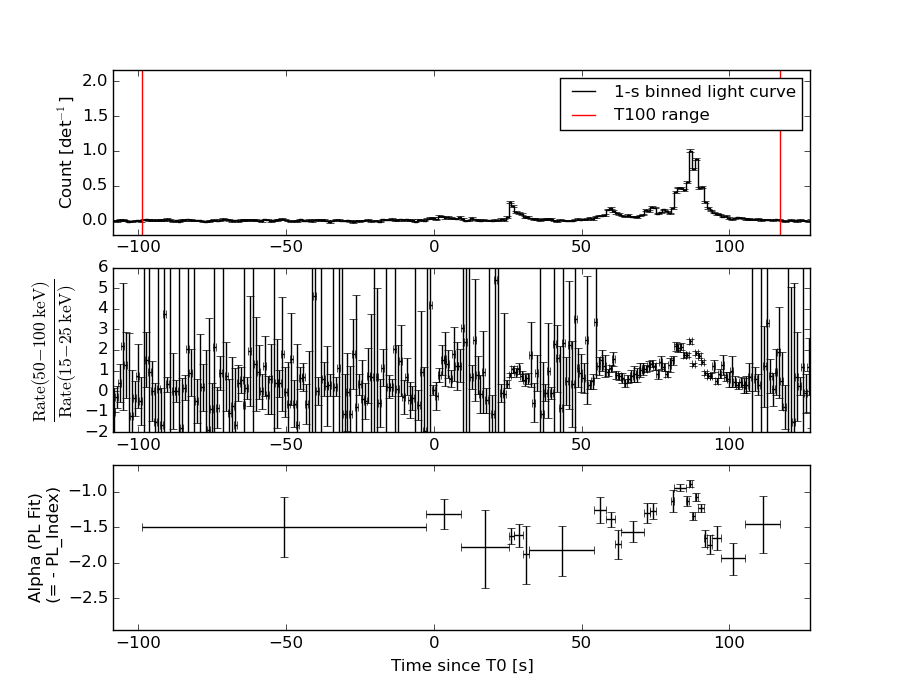
T90: 100 +/- 12.1655250605964
Measured from: -4.75999999046326
to: 95.2400000095367 [s; relative to TRIGTIME]
T50: 29 +/- 1
Measured from: 59.2400000095367
to: 88.2400000095367 [s; relative to TRIGTIME]
Fluence
Peak Flux (peak 1 second)
Measured from: 86.2400000095367
to: 87.2400000095367 [s; relative to TRIGTIME]
Total Fluence
Measured from: -98.7599999904633
to: 117.240000009537 [s; relative to TRIGTIME]
Band 1 Band 2 Band 3 Band 4
15-25 25-50 50-100 100-350 keV
Total 3.268251 4.724640 4.007228 1.124115
0.079271 0.083356 0.074353 0.062220 [error]
Peak 0.160070 0.332253 0.388398 0.125317
0.007018 0.008908 0.009644 0.006824 [error]
[ fluence units of on-axis counts / fully illuminated detector ]
======================================================================
====== Table of the duration information =============================
Value tstart tstop
T100 216.000 -98.760 117.240
T90 100.000 -4.760 95.240
T50 29.000 59.240 88.240
Peak 1.000 86.240 87.240
====== Spectral Analysis Summary =====================================
Model : spectral model: simple power-law (PL) and cutoff power-law (CPL)
Ph_index : photon index: E^{Ph_index}
Ph_90err : 90% error of the photon index
Epeak : Epeak in keV
Epeak_90err: 90% error of Epeak
Norm : normalization at 50 keV in both the PL model and CPL model
Nomr_90err : 90% error of the normalization
chi2 : Chi-Squared
dof : degree of freedo
=== Time-averaged spectral analysis ===
(Best model with acceptable fit: PL)
Model Ph_index Ph_90err_low Ph_90err_hi Epeak Epeak_90err_low Epeak_90err_hi Norm Nomr_90err_low Norm_90err_hi chi2 dof
PL -1.331 -0.043 0.043 - - - 4.02e-03 -8.89e-05 8.89e-05 50.380 57
CPL -1.275 -0.074 0.149 691.353 -434.505 -691.353 4.25e-03 -2.96e-04 6.29e-04 50.510 56
=== 1-s peak spectral analysis ===
(Best model with acceptable fit: CPL)
Model Ph_index Ph_90err_low Ph_90err_hi Epeak Epeak_90err_low Epeak_90err_hi Norm Nomr_90err_low Norm_90err_hi chi2 dof
PL -0.886 -0.051 0.051 - - - 6.59e-02 -1.97e-03 1.96e-03 66.980 57
CPL -0.487 -0.207 0.217 225.828 -58.494 169.316 9.78e-02 -1.77e-02 2.26e-02 55.710 56
=== Fluence/Peak Flux Summary ===
Model Band1 Band2 Band3 Band4 Band5 Total
15-25 25-50 50-100 100-350 15-150 15-350 keV
Fluence PL 9.46e-07 1.93e-06 3.06e-06 1.08e-05 8.51e-06 1.68e-05 erg/cm2
90%_error_low -4.51e-08 -5.31e-08 -7.85e-08 -6.51e-07 -1.96e-07 -6.83e-07 erg/cm2
90%_error_hi 4.61e-08 5.29e-08 7.83e-08 6.81e-07 1.96e-07 7.08e-07 erg/cm2
Peak flux PL 6.83e-04 1.03e-02 8.96e-02 1.03e+01 3.97e-01 1.01e+01 ph/cm2/s
90%_error_low N/A N/A N/A N/A N/A N/A ph/cm2/s
90%_error_hi N/A N/A N/A N/A N/A N/A ph/cm2/s
Fluence CPL 8.35e-07 1.93e-06 3.07e-06 1.08e-05 8.49e-06 1.62e-05 erg/cm2
90%_error_low -5.69e-08 -5.62e-08 -8.49e-08 -2.44e-06 -2.12e-07 -1.87e-06 erg/cm2
90%_error_hi 3.62e-08 5.20e-08 9.40e-08 4.02e-07 2.06e-07 7.66e-07 erg/cm2
Peak flux CPL 1.35e+00 2.23e+00 2.50e+00 3.30e+00 7.45e+00 9.38e+00 ph/cm2/s
90%_error_low -1.18e-01 -8.79e-02 -9.65e-02 -5.54e-01 -2.31e-01 -5.98e-01 ph/cm2/s
90%_error_hi 1.21e-01 8.82e-02 9.73e-02 6.97e-01 2.32e-01 7.21e-01 ph/cm2/s
======================================================================
Image
Pre-slew 15.0-350.0 keV image (Event data)
#   RAcent    DECcent   POSerr    Theta     Phi              Peak Cts       SNR   Name
  358.2374    46.5158   0.0119    28.0611  -136.1159         2.4645439     16.081 TRIG_00252588

Foreground time interval of the image:
-98.760  37.141 (delta_t = 135.901 [sec])
Background time interval of the image:
-239.760 -98.760 (delta_t = 141.000 [sec])
Light Curves
Note: The mask-weighted lightcurves have units of either count/det or counts/sec/det, where a det is 0.4 x 0.4 = 0.16 sq cm.
Full-time range; 1 s binning
Other quick-look light curves:
- 64 ms binning (zoomed)
- 16 ms binning (zoomed)
- 8 ms binning (zoomed)
- 2 ms binning (zoomed)
- SN=5 or 10 s binning (full-time range)
- Raw light curve
Spectra
- 64 ms binning (zoomed)
- 16 ms binning (zoomed)
- 8 ms binning (zoomed)
- 2 ms binning (zoomed)
- SN=5 or 10 s binning (full-time range)
- Raw light curve
Spectra
Notes:
- 1) The fitting includes the systematic errors.
- 2) When the burst includes telescope slew time periods, the fitting uses an average response file made from multiple 5-s response files through out the slew time plus single time preiod for the non-slew times, and weighted by the total counts in the corresponding time period using addrmf. An average response file is needed becuase a spectral fit using the pre-slew DRM will introduce some errors in both a spectral shape and a normalization if the PHA file contains a lot of the slew/post-slew time interval.
- 3) For fits to more complicated models (e.g. a power-law over a cutoff power-law), the BAT team has decided to require a chi-square improvement of more than 6 for each extra dof.
Time averaged spectrum fit using the average DRM
Power-law model
Time interval is from  -98.760 sec. to  117.240 sec.

Spectral model in power-law:
------------------------------------------------------------
Parameters  : value       lower 90%   higher 90%
Photon index: -1.33102     ( -0.0428468   0.0429588 )
Norm@50keV  : 4.01615E-03    ( -8.8938e-05   8.8881e-05 )
------------------------------------------------------------
#Fit statistic : Chi-Squared =          50.38 using 59 PHA bins.
# Reduced chi-squared =         0.8838 for     57 degrees of freedom
# Null hypothesis probability =   7.199914e-01

Photon flux (15-150 keV)    in 216 sec: 0.481989 ( -0.011889  0.011943 ) ph/cm2/s
Energy fluence (15-150 keV)             : 8.51027e-06 ( -1.96007e-07  1.96433e-07 ) ergs/cm2
Cutoff power-law model
Time interval is from  -98.760 sec. to  117.240 sec.
Spectral model in the cutoff power-law:
------------------------------------------------------------
Parameters  : value       lower 90%   higher 90%
Photon index: -1.27485     ( -0.0588818   0.164032 )
Epeak [keV] : 691.353      ( -741.179 -998.027 )
Norm@50keV  : 4.24954E-03    ( -0.000231249   0.000693485 )
------------------------------------------------------------
#Fit statistic : Chi-Squared =          50.51 using 59 PHA bins.
# Reduced chi-squared =         0.9020 for     56 degrees of freedom
# Null hypothesis probability =   6.818482e-01

Photon flux (15-150 keV)    in 216 sec: 0.480996 ( -0.013916  0.013003 ) ph/cm2/s
Energy fluence (15-150 keV)             : 8.48856e-06 ( -2.11738e-07  2.0572e-07 ) ergs/cm2
1-s peak spectrum fit
Power-law model
Time interval is from   86.240 sec. to   87.240 sec.

Spectral model in power-law:
------------------------------------------------------------
Parameters  : value       lower 90%   higher 90%
Photon index: -0.885543     ( -0.050904   0.0512418 )
Norm@50keV  : 6.58759E-02    ( -0.00196551   0.0019629 )
------------------------------------------------------------
#Fit statistic : Chi-Squared =          66.98 using 59 PHA bins.
# Reduced chi-squared =          1.175 for     57 degrees of freedom
# Null hypothesis probability =   1.718401e-01

Photon flux (15-150 keV)    in 1 sec: 0.397252 (    ) ph/cm2/s
Energy fluence (15-150 keV)             : 7.43567e-07 ( -2.39026e-08  2.39359e-08 ) ergs/cm2
Cutoff power-law model
Time interval is from   86.240 sec. to   87.240 sec.
Spectral model in the cutoff power-law:
------------------------------------------------------------
Parameters  : value       lower 90%   higher 90%
Photon index: -0.486808     ( -0.206963   0.217109 )
Epeak [keV] : 225.828      ( -58.4936 169.316 )
Norm@50keV  : 9.78266E-02    ( -0.0177129   0.0226399 )
------------------------------------------------------------
#Fit statistic : Chi-Squared =          55.71 using 59 PHA bins.
# Reduced chi-squared =         0.9948 for     56 degrees of freedom
# Null hypothesis probability =   4.858729e-01

Photon flux (15-150 keV)    in 1 sec: 7.45438 ( -0.2315  0.2316 ) ph/cm2/s
Energy fluence (15-150 keV)             : 7.32656e-07 ( -2.50036e-08  2.49441e-08 ) ergs/cm2
Time-resolved spectra
Distribution
T90 vs. Hardness ratio plot
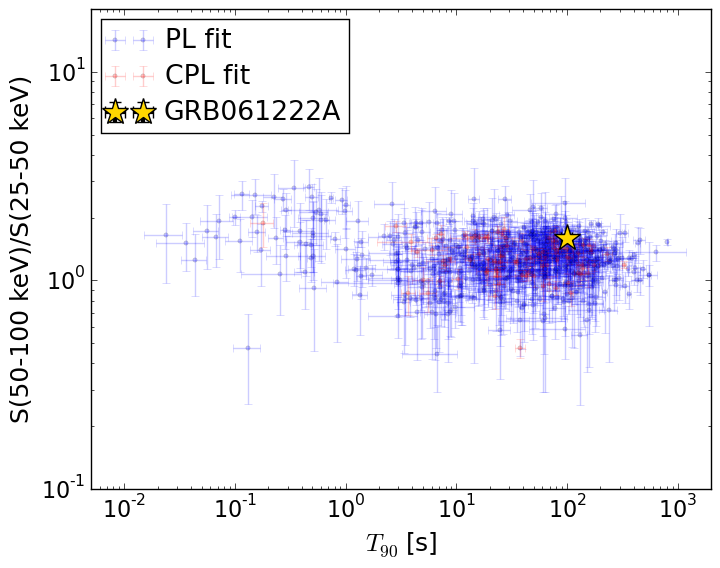
T90                                   = 100.0 sec.
Hardness ratio (energy fluence ratio) = 1.58997390557
S(15-50 keV) vs. S(50-150 keV) plot
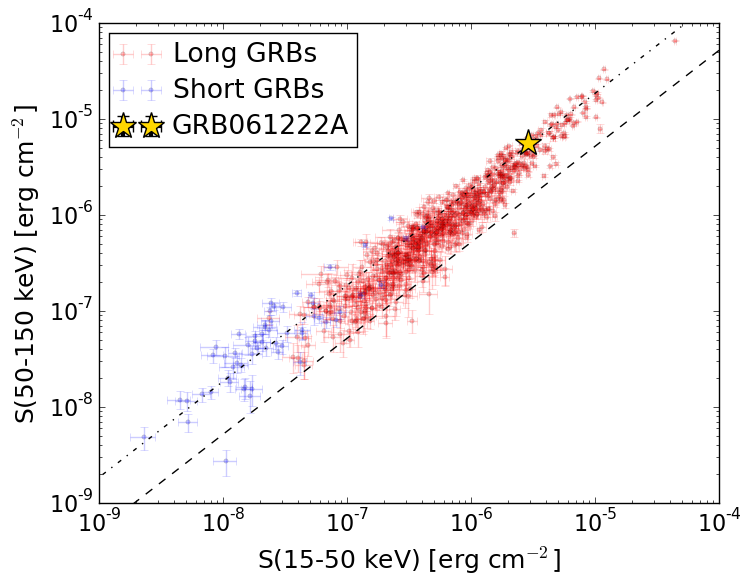
S(15-50 keV)  = 2.8728883e-06
S(50-150 keV) = 5.637449e-06
The dash-dotted line and the dashed line traces the fluences calculated from the Band function with Epeak = 15 and 150 keV, respectively. Both lines assume a canonical values of alpha = -1 and beta = -2.5.
Mask shadow pattern
IMX = -3.842128353345811E-01, IMY = 3.695306085312690E-01
Spacecraft aspect plot
Bright source in the pre-burst/pre-slew/post-slew images
Pre-burst image of 15-350 keV band
Time interval of the image:
-239.760000 -98.760000

# RAcent  DECcent POSerr Theta    Phi  PeakCts   SNR AngSep     Name
#  [deg]    [deg]    ['] [deg]  [deg]                   [']
  1.8210  11.5445    2.2  57.0 -167.4   2.0990   5.2 ------	UNKNOWN
355.4036  26.3389    3.3  46.0 -152.5   0.6926   3.5 ------	UNKNOWN
253.9772  68.0956    3.0  48.4  -50.0   1.7795   3.9 ------	UNKNOWN
Pre-slew background subtracted image of 15-350 keV band
Time interval of the image:
-98.760000 37.140590

# RAcent  DECcent POSerr Theta    Phi  PeakCts   SNR AngSep     Name
#  [deg]    [deg]    ['] [deg]  [deg]                   [']
 13.6422  15.2657    2.2  49.8 -179.5   1.5380   5.2 ------	UNKNOWN
358.2374  46.5158    0.7  28.1 -136.1   2.4644  16.1 ------	UNKNOWN
351.0864  33.1836    2.3  42.0 -142.8   1.2329   5.0 ------	UNKNOWN
350.5586  20.1603    2.9  53.5 -151.1   1.9174   3.9 ------	UNKNOWN
Post-slew image of 15-350 keV band
Time interval of the image:
89.940590 482.303700
540.240000 962.293000

# RAcent  DECcent POSerr Theta    Phi  PeakCts   SNR AngSep     Name
#  [deg]    [deg]    ['] [deg]  [deg]                   [']
308.0810  41.1625   27.9  35.9  -62.0  -0.3053  -0.4   12.7	Cyg X-3
326.1993  38.2788    4.7  24.8  -79.9   1.3884   2.5    2.9	Cyg X-2
248.8050  75.8802    3.5  49.6    0.3   2.6925   3.3 ------	UNKNOWN
358.2439  46.4906    1.7   0.0 -177.1   2.5645   6.8 ------	UNKNOWN
343.0783  -5.7543    3.8  54.0 -143.3   7.8668   3.1 ------	UNKNOWN