Analysis Summary
Notes:
- 1) No attempt has been made to eliminate the non-significant decimal places.
- 2) This batgrbproduct analysis is done using the HEASARC data.
- 3) This batgrbproduct analysis is using the flight position for the mask-weighting calculation.
======================================================================
BAT GRB EVENT DATA PROCESSING REPORT
Process Script Ver: batgrbproduct v2.46
Process Start Time: Mon Jan 20 12:15:18 EST 2014
Host Name: batevent1
Current Working Dir: /local/data/batevent/batevent_reproc/trigger252593
======================================================================
Trigger: 00252593 Segment: 000
BAT Trigger Time: 188453464 [s; MET]
Trigger Stop: 188453528 [s; MET]
UTC: 2006-12-22T04:11:02.350780 [includes UTCF correction]
Where From?: TDRSS position message
BAT
RA: 105.357290328966 Dec: -25.8555478617164 [deg; J2000]
Catalogged Source?: NO
Point Source?: YES
GRB Indicated?: YES [ by BAT flight software ]
Image S/N Ratio: 10.83
Image Trigger?: YES
Rate S/N Ratio: 0 [ if not an image trigger ]
Image S/N Ratio: 10.83
Analysis Position: [ source = BAT ]
RA: 105.357290328966 Dec: -25.8555478617164 [deg; J2000]
Refined Position: [ source = BAT pre-slew burst ]
RA: 105.353903329546 Dec: -25.8678309517905 [deg; J2000]
{ 07h 01m 24.9s , -25d 52' 04.2" }
+/- 1.29600812761518 [arcmin] (estimated 90% radius based on SNR)
+/- 0.447740856112547 [arcmin] (formal 1-sigma fit error)
SNR: 21.001494515391
Angular difference between the analysis and refined position is 0.759334 arcmin
Partial Coding Fraction: 0.15625 [ including projection effects ]
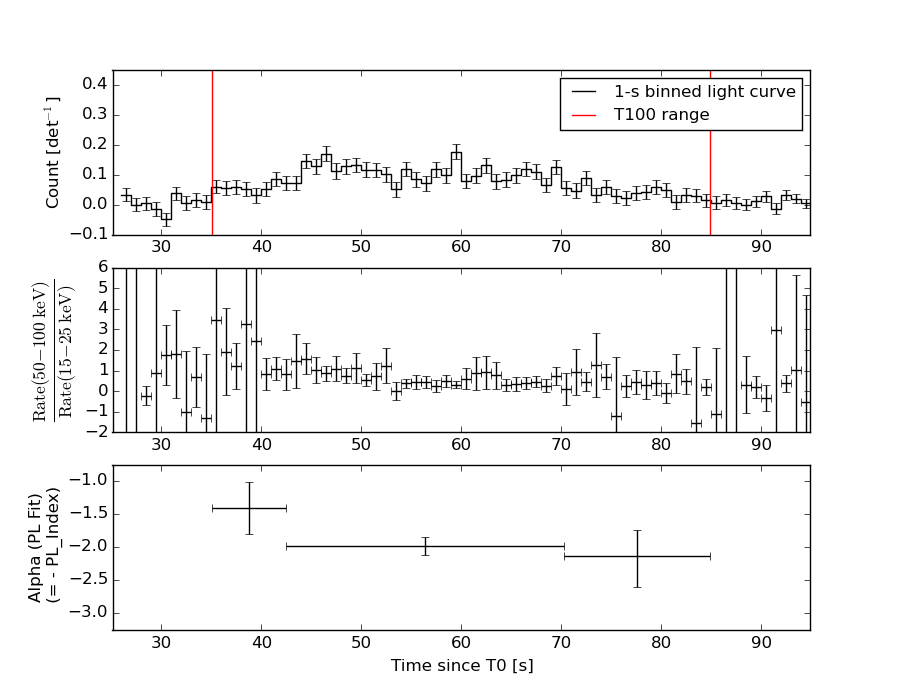
Duration
T90: 37.2479999661446 +/- 6.05790721767193
Measured from: 41.7039999961853
to: 78.9519999623299 [s; relative to TRIGTIME]
T50: 19.311999976635 +/- 2.58750228941296
Measured from: 47.0480000078678
to: 66.3599999845028 [s; relative to TRIGTIME]
Fluence
Peak Flux (peak 1 second)
Measured from: 59.2759999930859
to: 60.2759999930859 [s; relative to TRIGTIME]
Total Fluence
Measured from: 35.1119999885559
to: 84.8880000114441 [s; relative to TRIGTIME]
Band 1 Band 2 Band 3 Band 4
15-25 25-50 50-100 100-350 keV
Total 1.333452 1.667826 0.892326 0.147357
0.092104 0.096250 0.081763 0.068577 [error]
Peak 0.067076 0.066503 0.034062 0.022550
0.013766 0.014334 0.011911 0.010016 [error]
[ fluence units of on-axis counts / fully illuminated detector ]
======================================================================
====== Table of the duration information =============================
Value tstart tstop
T100 49.776 35.112 84.888
T90 37.248 41.704 78.952
T50 19.312 47.048 66.360
Peak 1.000 59.276 60.276
====== Spectral Analysis Summary =====================================
Model : spectral model: simple power-law (PL) and cutoff power-law (CPL)
Ph_index : photon index: E^{Ph_index}
Ph_90err : 90% error of the photon index
Epeak : Epeak in keV
Epeak_90err: 90% error of Epeak
Norm : normalization at 50 keV in both the PL model and CPL model
Nomr_90err : 90% error of the normalization
chi2 : Chi-Squared
dof : degree of freedo
=== Time-averaged spectral analysis ===
(Best model with acceptable fit: PL)
Model Ph_index Ph_90err_low Ph_90err_hi Epeak Epeak_90err_low Epeak_90err_hi Norm Nomr_90err_low Norm_90err_hi chi2 dof
PL -1.956 -0.131 0.127 - - - 4.96e-03 -4.14e-04 4.08e-04 51.930 57
CPL -1.306 -0.503 0.569 47.294 -11.359 20.588 1.14e-02 -5.27e-03 1.19e-02 46.870 56
=== 1-s peak spectral analysis ===
(Best model with acceptable fit: PL)
Model Ph_index Ph_90err_low Ph_90err_hi Epeak Epeak_90err_low Epeak_90err_hi Norm Nomr_90err_low Norm_90err_hi chi2 dof
PL -2.162 -0.417 0.367 - - - 9.23e-03 -2.81e-03 2.75e-03 63.320 57
CPL 0.064 -1.904 3.127 33.402 -19.429 12.647 2.36e-01 -2.36e-01 3.96e+01 59.200 56
=== Fluence/Peak Flux Summary ===
Model Band1 Band2 Band3 Band4 Band5 Total
15-25 25-50 50-100 100-350 15-150 15-350 keV
Fluence PL 4.85e-07 6.75e-07 6.96e-07 1.31e-06 2.27e-06 3.17e-06 erg/cm2
90%_error_low -5.05e-08 -4.76e-08 -7.83e-08 -2.75e-07 -1.82e-07 -3.62e-07 erg/cm2
90%_error_hi 5.17e-08 4.76e-08 7.89e-08 3.19e-07 1.84e-07 3.94e-07 erg/cm2
Peak flux PL 7.21e-01 4.92e-01 2.20e-01 1.36e-01 1.50e+00 1.57e+00 ph/cm2/s
90%_error_low -2.04e-01 -1.15e-01 -8.15e-02 -7.46e-02 -3.43e-01 -3.62e-01 ph/cm2/s
90%_error_hi 2.11e-01 1.14e-01 8.67e-02 1.14e-01 3.43e-01 3.63e-01 ph/cm2/s
Fluence CPL 4.50e-07 7.27e-07 6.94e-07 4.94e-07 2.15e-06 2.37e-06 erg/cm2
90%_error_low -5.79e-08 -6.16e-08 -8.83e-08 -2.49e-07 -2.00e-07 -3.26e-07 erg/cm2
90%_error_hi 5.83e-08 6.31e-08 8.69e-08 5.33e-07 2.04e-07 5.57e-07 erg/cm2
Peak flux CPL 6.65e-01 6.34e-01 1.69e-01 8.15e-03 1.48e+00 1.48e+00 ph/cm2/s
90%_error_low -2.25e-01 -1.66e-01 -1.69e-01 -8.15e-03 -3.33e-01 -3.32e-01 ph/cm2/s
90%_error_hi 2.29e-01 1.72e-01 1.18e-01 7.97e-02 3.36e-01 3.37e-01 ph/cm2/s
======================================================================
Image
Pre-slew 15.0-350.0 keV image (Event data)
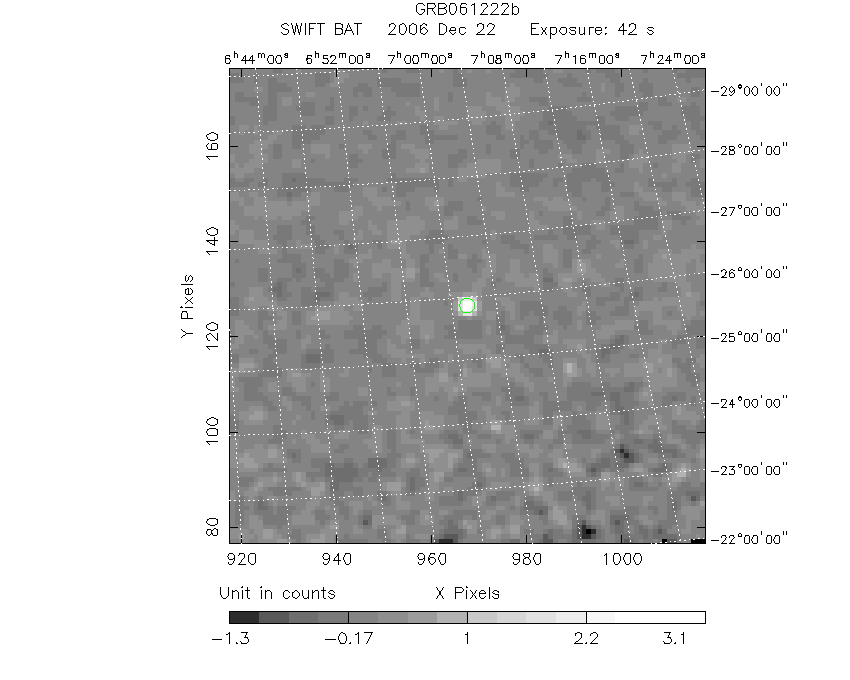
#   RAcent    DECcent   POSerr    Theta     Phi              Peak Cts       SNR   Name
  105.3539   -25.8678   0.0092    37.1700   104.0873         3.9702804     21.001 TRIG_00252593

Foreground time interval of the image:
 35.112  76.701 (delta_t =  41.589 [sec])
Background time interval of the image:
-239.000  35.112 (delta_t = 274.112 [sec])
Light Curves
Note: The mask-weighted lightcurves have units of either count/det or counts/sec/det, where a det is 0.4 x 0.4 = 0.16 sq cm.
Full-time range; 1 s binning
Other quick-look light curves:
- 64 ms binning (zoomed)
- 16 ms binning (zoomed)
- 8 ms binning (zoomed)
- 2 ms binning (zoomed)
- SN=5 or 10 s binning (full-time range)
- Raw light curve
Spectra
- 64 ms binning (zoomed)
- 16 ms binning (zoomed)
- 8 ms binning (zoomed)
- 2 ms binning (zoomed)
- SN=5 or 10 s binning (full-time range)
- Raw light curve
Spectra
Notes:
- 1) The fitting includes the systematic errors.
- 2) When the burst includes telescope slew time periods, the fitting uses an average response file made from multiple 5-s response files through out the slew time plus single time preiod for the non-slew times, and weighted by the total counts in the corresponding time period using addrmf. An average response file is needed becuase a spectral fit using the pre-slew DRM will introduce some errors in both a spectral shape and a normalization if the PHA file contains a lot of the slew/post-slew time interval.
- 3) For fits to more complicated models (e.g. a power-law over a cutoff power-law), the BAT team has decided to require a chi-square improvement of more than 6 for each extra dof.
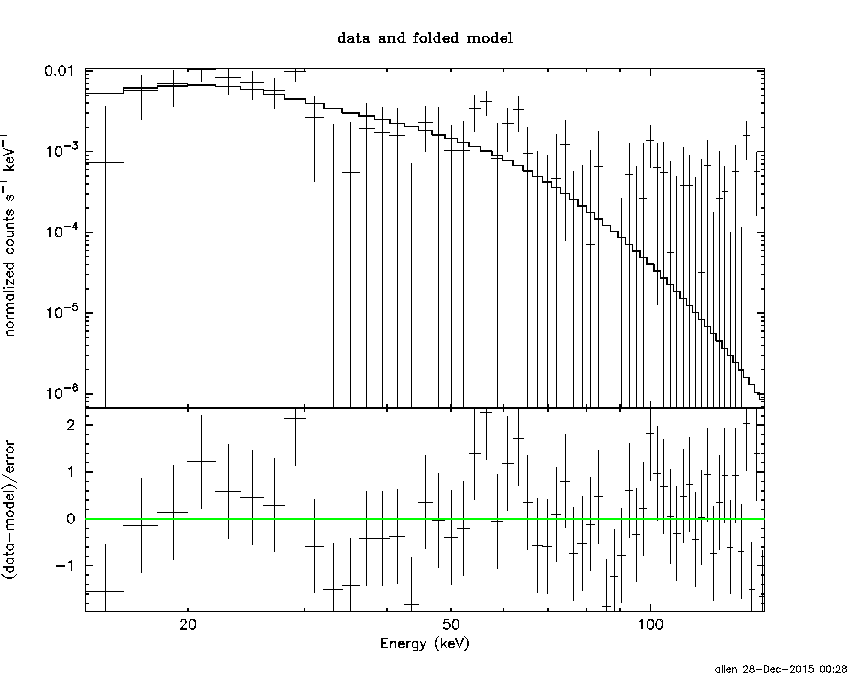
Time averaged spectrum fit using the average DRM
Power-law model
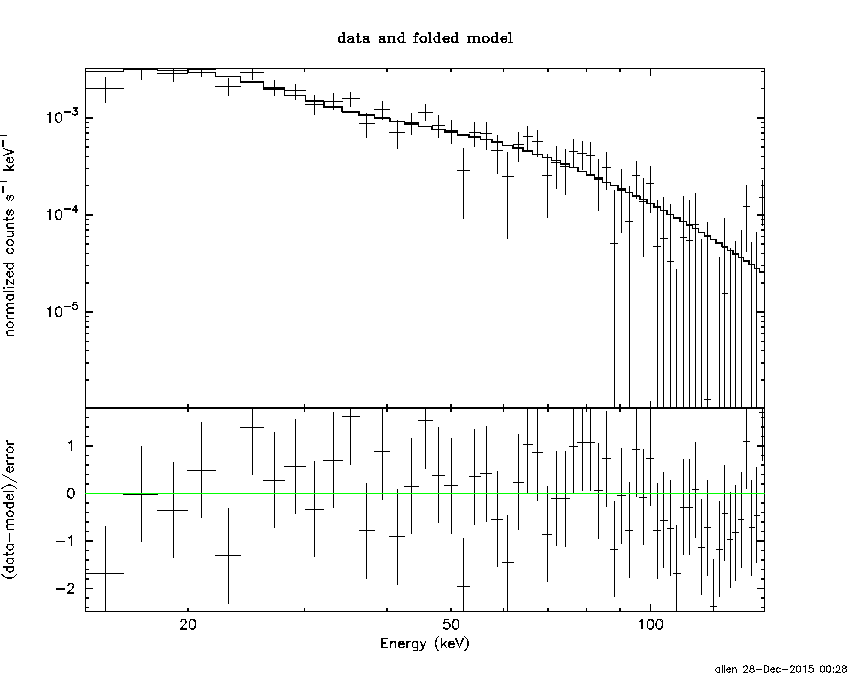
Time interval is from   35.112 sec. to   84.888 sec.

Spectral model in power-law:
------------------------------------------------------------
Parameters  : value       lower 90%   higher 90%
Photon index: -1.95614     ( -0.131039   0.127104 )
Norm@50keV  : 4.96139E-03    ( -0.000413831   0.000408409 )
------------------------------------------------------------
#Fit statistic : Chi-Squared =          51.93 using 59 PHA bins.
# Reduced chi-squared =         0.9111 for     57 degrees of freedom
# Null hypothesis probability =   6.650816e-01

Photon flux (15-150 keV)    in 49.78 sec: 0.729643 ( -0.052374  0.052427 ) ph/cm2/s
Energy fluence (15-150 keV)             : 2.27371e-06 ( -1.82274e-07  1.84192e-07 ) ergs/cm2
Cutoff power-law model
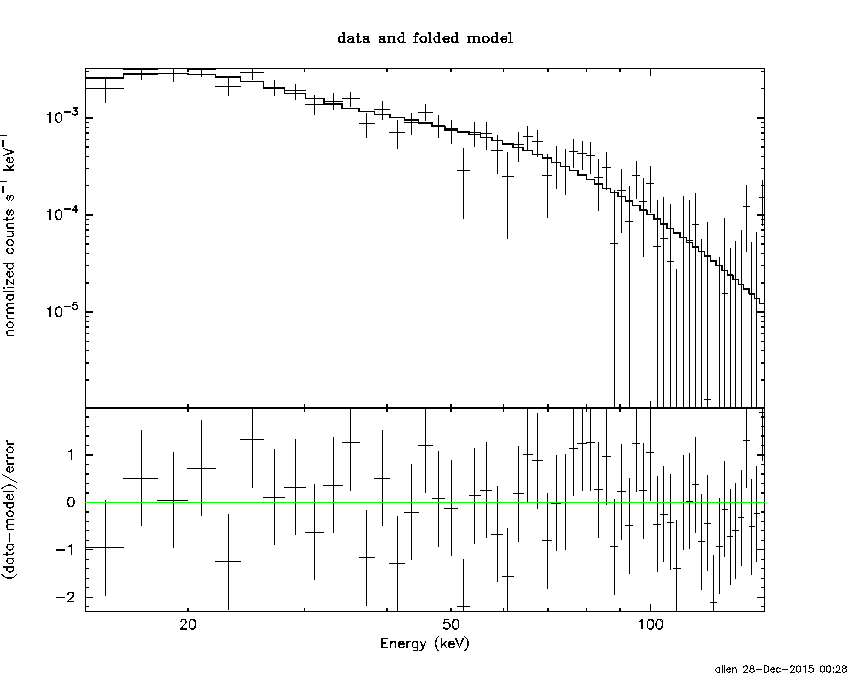
Time interval is from   35.112 sec. to   84.888 sec.
Spectral model in the cutoff power-law:
------------------------------------------------------------
Parameters  : value       lower 90%   higher 90%
Photon index: -1.30598     ( -0.503173   0.56903 )
Epeak [keV] : 47.2940      ( -11.3593 20.5878 )
Norm@50keV  : 1.13536E-02    ( -0.00527163   0.0119136 )
------------------------------------------------------------
#Fit statistic : Chi-Squared =          46.87 using 59 PHA bins.
# Reduced chi-squared =         0.8370 for     56 degrees of freedom
# Null hypothesis probability =   8.024168e-01

Photon flux (15-150 keV)    in 49.78 sec: 0.710028 ( -0.054387  0.054427 ) ph/cm2/s
Energy fluence (15-150 keV)             : 2.1536e-06 ( -1.99596e-07  2.03648e-07 ) ergs/cm2
1-s peak spectrum fit
Power-law model
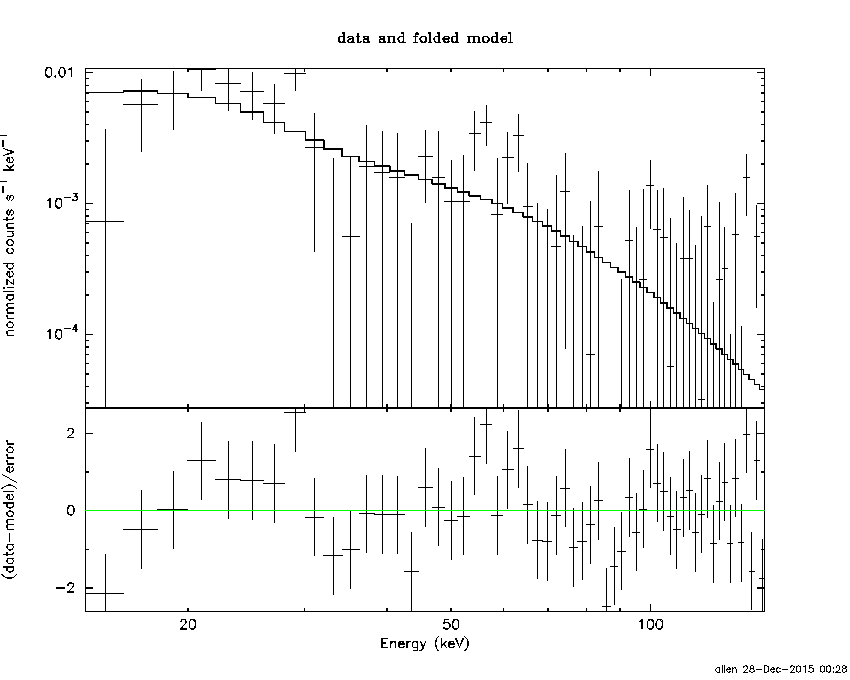
Time interval is from   59.276 sec. to   60.276 sec.

Spectral model in power-law:
------------------------------------------------------------
Parameters  : value       lower 90%   higher 90%
Photon index: -2.16155     ( -0.416047   0.367687 )
Norm@50keV  : 9.23484E-03    ( -0.00280727   0.00274968 )
------------------------------------------------------------
#Fit statistic : Chi-Squared =          63.32 using 59 PHA bins.
# Reduced chi-squared =          1.111 for     57 degrees of freedom
# Null hypothesis probability =   2.631481e-01

Photon flux (15-150 keV)    in 1 sec: 1.49876 ( -0.34256  0.34256 ) ph/cm2/s
Energy fluence (15-150 keV)             : 8.63853e-08 ( -2.30115e-08  2.40048e-08 ) ergs/cm2
Cutoff power-law model
Time interval is from   59.276 sec. to   60.276 sec.
Spectral model in the cutoff power-law:
------------------------------------------------------------
Parameters  : value       lower 90%   higher 90%
Photon index: 0.0643306     ( -1.91924   3.1118 )
Epeak [keV] : 33.4019      ( -19.3496 12.7265 )
Norm@50keV  : 0.235953    ( -0.248137   39.5686 )
------------------------------------------------------------
#Fit statistic : Chi-Squared =          59.20 using 59 PHA bins.
# Reduced chi-squared =          1.057 for     56 degrees of freedom
# Null hypothesis probability =   3.595655e-01

Photon flux (15-150 keV)    in 1 sec: 1.47626 ( -0.33265  0.33575 ) ph/cm2/s
Energy fluence (15-150 keV)             : 0 ( 0  0 ) ergs/cm2
Time-resolved spectra
Distribution
T90 vs. Hardness ratio plot
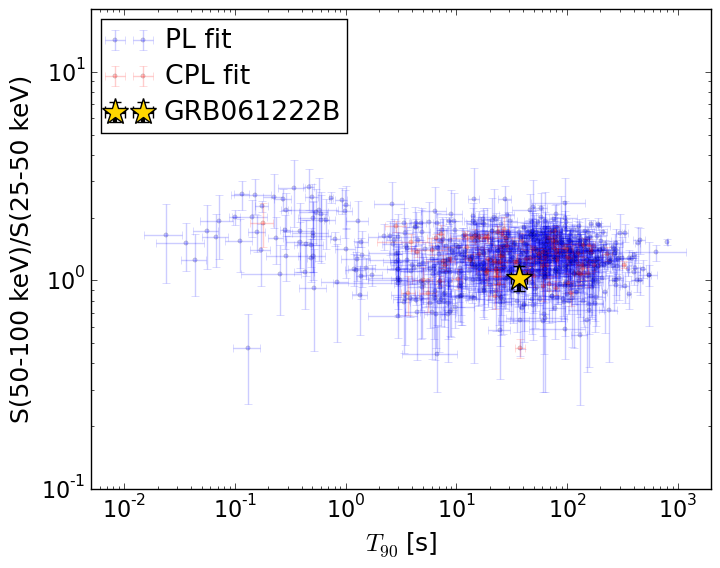
T90                                   = 37.248 sec.
Hardness ratio (energy fluence ratio) = 1.03090762728
S(15-50 keV) vs. S(50-150 keV) plot
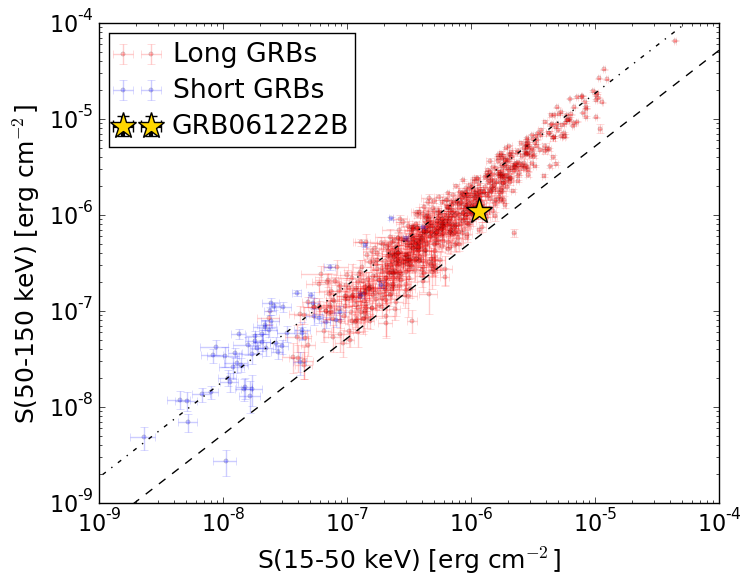
S(15-50 keV)  = 1.1602198e-06
S(50-150 keV) = 1.1134915e-06
The dash-dotted line and the dashed line traces the fluences calculated from the Band function with Epeak = 15 and 150 keV, respectively. Both lines assume a canonical values of alpha = -1 and beta = -2.5.
Mask shadow pattern
IMX = -1.845495917877787E-01, IMY = -7.354137459376950E-01
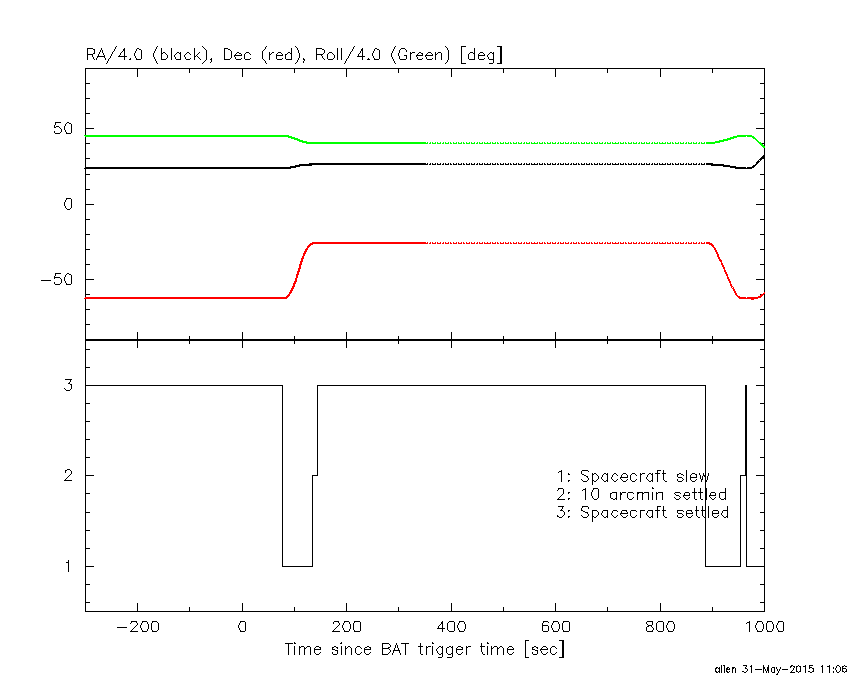
Spacecraft aspect plot
Bright source in the pre-burst/pre-slew/post-slew images
Pre-burst image of 15-350 keV band
Time interval of the image:
-239.000000 35.112000

# RAcent  DECcent POSerr Theta    Phi  PeakCts   SNR AngSep     Name
#  [deg]    [deg]    ['] [deg]  [deg]                   [']
135.5216 -40.5193    1.7  32.4  155.5   1.8294   6.9    2.1	Vela X-1
170.3025 -60.6752    3.8  33.8 -149.4   0.7206   3.1    3.2	Cen X-3
186.7515 -62.6763    4.7  38.5 -138.4   0.9454   2.4    6.2	GX 301-2
 90.9357 -59.5056    2.0   3.6   51.2   1.1220   5.9 ------	UNKNOWN
 74.4079 -64.3738    2.8   9.5  -22.0   0.7575   4.1 ------	UNKNOWN
162.2172 -85.8515    3.1  26.2  -99.7   1.0431   3.8 ------	UNKNOWN
205.2858 -54.5121    2.3  51.0 -135.6   5.1594   5.0 ------	UNKNOWN
Pre-slew background subtracted image of 15-350 keV band
Time interval of the image:
35.112000 76.700600

# RAcent  DECcent POSerr Theta    Phi  PeakCts   SNR AngSep     Name
#  [deg]    [deg]    ['] [deg]  [deg]                   [']
135.5125 -40.7092    3.7  32.2  155.7   0.2478   3.1    9.3	Vela X-1
170.3158 -60.6185   27.3  33.8 -149.4   0.0310   0.4    0.3	Cen X-3
186.5464 -62.6817    8.5  38.5 -138.5  -0.1360  -1.4    6.1	GX 301-2
105.3539 -25.8678    0.6  37.2  104.1   3.9706  21.0 ------	UNKNOWN
 38.0890 -45.4418    2.4  36.1   -0.3   0.4239   4.9 ------	UNKNOWN
 93.4180 -68.3165    2.6   5.9  -84.3   0.2717   4.5 ------	UNKNOWN
335.9878 -65.8560    2.5  44.3  -60.3   1.1685   4.7 ------	UNKNOWN
Post-slew image of 15-350 keV band
Time interval of the image:
134.300620 483.070600
661.000000 723.068900
841.000000 887.100590

# RAcent  DECcent POSerr Theta    Phi  PeakCts   SNR AngSep     Name
#  [deg]    [deg]    ['] [deg]  [deg]                   [']
135.5318 -40.5858    1.4  29.0 -124.0   3.0748   8.4    1.9	Vela X-1
 86.1990   5.5592    3.8  36.5   74.7   2.1427   3.1 ------	UNKNOWN
 52.5797 -11.7003    2.5  51.6   23.5   6.5050   4.5 ------	UNKNOWN
 71.1410  -8.9346    2.3  36.6   39.3   2.2685   4.9 ------	UNKNOWN
101.9274 -30.5979    2.7   5.6  -40.2   1.1167   4.3 ------	UNKNOWN
105.9975 -64.2773    3.6  38.4  -72.5   2.5844   3.2 ------	UNKNOWN
123.1769 -65.2857    3.4  41.0  -83.3   4.6800   3.4 ------	UNKNOWN