Analysis Summary
Notes:
- 1) No attempt has been made to eliminate the non-significant decimal places.
- 2) This batgrbproduct analysis is done using the HEASARC data.
- 3) This batgrbproduct analysis is using the flight position for the mask-weighting calculation.
======================================================================
                  BAT GRB EVENT DATA PROCESSING REPORT
    Process Script Ver: batgrbproduct v2.46
    Process Start Time: Mon Jan 20 11:52:09 EST 2014
             Host Name: batevent1
   Current Working Dir: /local/data/batevent/batevent_reproc/trigger257741
======================================================================

  Trigger: 00257741      Segment: 000

  BAT Trigger Time: 191471608   [s; MET]
      Trigger Stop: 191471672   [s; MET]
               UTC: 2007-01-26T02:33:26.277220    [includes UTCF correction]
       Where From?: TDRSS position message

  BAT
    RA: 33.4603956656862   Dec: -73.5233322332982  [deg; J2000]

     Catalogged Source?: NO
     Point Source?:      YES
     GRB Indicated?:     YES    [ by BAT flight software ]
     Image S/N Ratio:    7.04
     Image Trigger?:     YES
     Rate S/N Ratio:     0  [ if not an image trigger ]
     Image S/N Ratio:    7.04

  Analysis Position:   [ source = BAT ]
    RA: 33.4603956656862   Dec: -73.5233322332982  [deg; J2000]

  Refined Position:   [ source = BAT pre-slew burst ]
    RA: 33.4935643891249   Dec: -73.5482277700538  [deg; J2000]
        { 02h 13m 58.5s , -73d 32' 53.6" }
         +/- 3.9614940219348 [arcmin] (estimated 90% radius based on SNR)
         +/- 2.39154788838823 [arcmin] (formal 1-sigma fit error)
    SNR: 4.25631819181088

  Angular difference between the analysis and refined position is 1.596675 arcmin

  Partial Coding Fraction: 0.9921875    [ including projection effects ]

  Duration
     T90: N/A +/- N/A
        Measured from: N/A
                   to: N/A     [s; relative to TRIGTIME]
     T50: N/A +/- N/A
        Measured from: N/A
                   to: N/A     [s; relative to TRIGTIME]

    WARNING: battblocks failed.  Used TDRSS fore/background intervals

======================================================================


====== Table of the duration information =============================

        Value   tstart    tstop
T100     N/A      N/A      N/A
T90      N/A      N/A      N/A
T50      N/A      N/A      N/A
Peak     N/A      N/A      N/A


====== Spectral Analysis Summary =====================================

Model      : spectral model: simple power-law (PL) and cutoff power-law (CPL)
Ph_index   : photon index: E^{Ph_index}
Ph_90err   : 90% error of the photon index
Epeak      : Epeak in keV
Epeak_90err: 90% error of Epeak
Norm       : normalization at 50 keV in both the PL model and CPL model
Nomr_90err : 90% error of the normalization
chi2       : Chi-Squared
dof        : degree of freedo

=== Time-averaged spectral analysis ===
(Best model with acceptable fit: N/A)

Model Ph_index Ph_90err_low Ph_90err_hi  Epeak  Epeak_90err_low  Epeak_90err_hi  Norm       Nomr_90err_low    Norm_90err_hi    chi2    dof
PL      -1.881    -0.521      0.484       -           -               -         2.74e-04     -1.06e-04          1.09e-04      57.590   57
CPL      2.390    -1.003     -2.390       36.372      -7.525         2.966      1.36e-01     -1.36e-01          2.31e+04      48.220   56


=== 1-s peak spectral analysis ===
(Best model with acceptable fit: N/A)

Model Ph_index Ph_90err_low Ph_90err_hi  Epeak  Epeak_90err_low  Epeak_90err_hi  Norm       Nomr_90err_low    Norm_90err_hi    chi2    dof
PL      N/A         N/A       N/A          -           -               -           N/A           N/A               N/A         N/A        N/A
CPL     N/A         N/A       N/A          N/A         N/A           N/A           N/A           N/A               N/A         N/A        N/A


=== Fluence/Peak Flux Summary ===

              Model    Band1     Band2     Band3     Band4     Band5     Total
                       15-25     25-50    50-100    100-350    15-150    15-350    keV
Fluence         PL   3.19e-08  4.68e-08  5.12e-08  1.05e-07  1.62e-07  2.37e-07   erg/cm2
      90%_error_low -1.24e-08 -1.54e-08 -2.42e-08 -7.02e-08 -6.08e-08 -1.11e-07   erg/cm2
      90%_error_hi   1.30e-08  1.54e-08  2.71e-08  1.32e-07  6.60e-08  1.56e-07   erg/cm2
Peak flux       PL     N/A      N/A      N/A      N/A      N/A      N/A     ph/cm2/s
Image
Pre-slew 15.0-350.0 keV image (Event data)
#   RAcent    DECcent   POSerr    Theta     Phi              Peak Cts       SNR   Name
   33.4936   -73.5482   0.0450     6.0638    91.9942         0.3034612      4.256 TRIG_00257741

Foreground time interval of the image:
  0.000  64.000 (delta_t =  64.000 [sec])
Background time interval of the image:
Light Curves
Note: The mask-weighted lightcurves have units of either count/det or counts/sec/det, where a det is 0.4 x 0.4 = 0.16 sq cm.
Full-time range; 1 s binning
Other quick-look light curves:
Spectra
Notes:
- 1) The fitting includes the systematic errors.
- 2) When the burst includes telescope slew time periods, the fitting uses an average response file made from multiple 5-s response files through out the slew time plus single time preiod for the non-slew times, and weighted by the total counts in the corresponding time period using addrmf. An average response file is needed becuase a spectral fit using the pre-slew DRM will introduce some errors in both a spectral shape and a normalization if the PHA file contains a lot of the slew/post-slew time interval.
- 3) For fits to more complicated models (e.g. a power-law over a cutoff power-law), the BAT team has decided to require a chi-square improvement of more than 6 for each extra dof.
Time averaged spectrum fit using the average DRM
Power-law model

Time interval is from    0.000 sec. to   64.000 sec.

Spectral model in power-law:
------------------------------------------------------------
Parameters  : value       lower 90%   higher 90%
Photon index: -1.88105     ( -0.537371   0.467696 )
Norm@50keV  : 2.74146E-04    ( -0.000106895   0.0001081 )
------------------------------------------------------------
#Fit statistic : Chi-Squared =          57.59 using 59 PHA bins.
# Reduced chi-squared =          1.010 for     57 degrees of freedom
# Null hypothesis probability =   4.530562e-01

Photon flux (15-150 keV)    in 64 sec: 3.90498E-02 ( -0.0126629  0.0126784 ) ph/cm2/s
Energy fluence (15-150 keV)             : 1.61998e-07 ( -6.07842e-08  6.60358e-08 ) ergs/cm2
Cutoff power-law model

Time interval is from    0.000 sec. to   64.000 sec.
Spectral model in the cutoff power-law:
------------------------------------------------------------
Parameters  : value       lower 90%   higher 90%
Photon index: 6.97896     ( -5.63269   -7.02 )
Epeak [keV] : 33.4753      ( -4.59404 5.89712 )
Norm@50keV  : 161.604    ( -189.24   22947.6 )
------------------------------------------------------------
#Fit statistic : Chi-Squared =          46.27 using 59 PHA bins.
# Reduced chi-squared =         0.8263 for     56 degrees of freedom
# Null hypothesis probability =   8.197536e-01

Photon flux (15-150 keV)    in 64 sec: 3.72855E-02 ( -0.0108827  0.0114898 ) ph/cm2/s
Energy fluence (15-150 keV)             : 1.17244e-07 ( -3.55157e-08  4.22122e-08 ) ergs/cm2
1-s peak spectrum fit
1-s peak spectrum unavailable, likely because there are no event data in the 1-s peak range.
Time-resolved spectra

Distribution
T90 vs. Hardness ratio plot
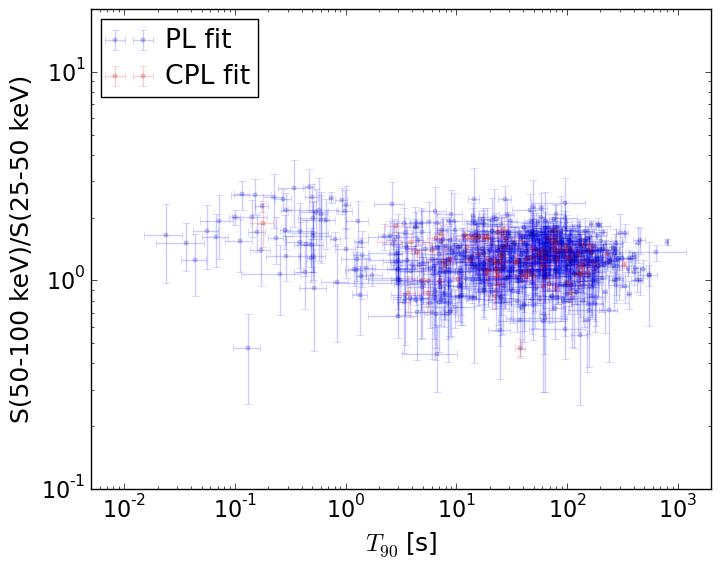
T90                                   = N/A sec.
Hardness ratio (energy fluence ratio) = N/A
S(15-50 keV) vs. S(50-150 keV) plot
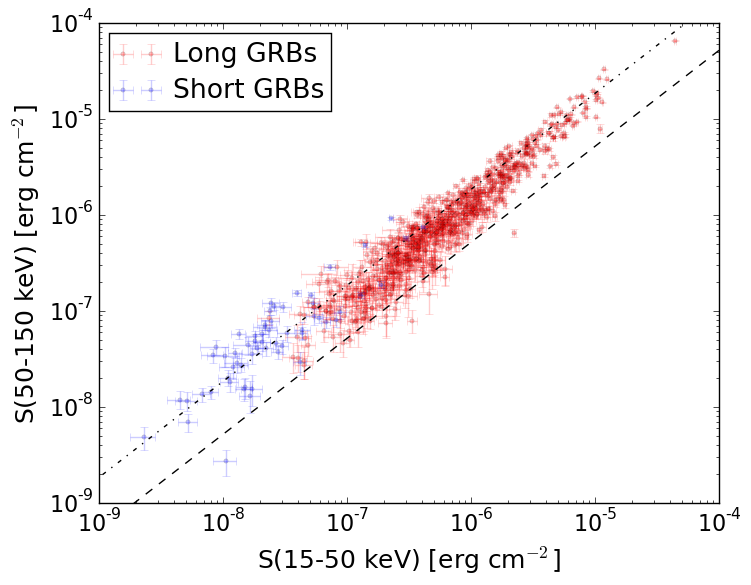
S(15-50 keV)  = N/A
S(50-150 keV) = N/A
The dash-dotted line and the dashed line traces the fluences calculated from the Band function with Epeak = 15 and 150 keV, respectively. Both lines assume a canonical values of alpha = -1 and beta = -2.5.
Mask shadow pattern
IMX = -3.696553962752156E-03, IMY = -1.061658211320078E-01
Spacecraft aspect plot
Bright source in the pre-burst/pre-slew/post-slew images
Pre-burst image of 15-350 keV band
Time interval of the image:
Pre-slew background subtracted image of 15-350 keV band
Time interval of the image:
0.000000 64.000000

# RAcent  DECcent POSerr Theta    Phi  PeakCts   SNR AngSep     Name
#  [deg]    [deg]    ['] [deg]  [deg]                   [']
170.4266 -60.6116    3.5  45.4  153.4   0.6279   3.3    3.3	Cen X-3
186.6532 -62.7872    3.3  44.0  164.6   0.5122   3.5    1.0	GX 301-2
109.3823 -60.3717    2.2  35.5  110.6   0.8255   5.2 ------	UNKNOWN
 29.6503 -24.0322    2.4  50.0    9.1   0.9718   4.7 ------	UNKNOWN
192.4051 -68.5243    2.9  38.3  168.4   0.4529   4.0 ------	UNKNOWN
303.8718 -45.1568    2.6  41.1  -97.9   1.5760   4.4 ------	UNKNOWN
299.4074 -46.0624    2.3  41.5 -102.8   1.7508   5.1 ------	UNKNOWN
Post-slew image of 15-350 keV band
Time interval of the image:
101.700600 433.400600

# RAcent  DECcent POSerr Theta    Phi  PeakCts   SNR AngSep     Name
#  [deg]    [deg]    ['] [deg]  [deg]                   [']
170.7415 -60.6154   15.6  42.9  151.8   0.3443   0.7   12.5	Cen X-3
186.4108 -62.7337    4.8  42.6  163.2   1.0049   2.4    7.1	GX 301-2
 60.5168 -31.0626    2.2  44.7   34.8   2.5561   5.2 ------	UNKNOWN
 46.5644 -66.1244    2.4   8.6   38.9   0.8651   4.9 ------	UNKNOWN
325.6008 -62.0932    3.0  26.2  -99.5   1.1032   3.9 ------	UNKNOWN