Analysis Summary
Notes:
- 1) No attempt has been made to eliminate the non-significant decimal places.
- 2) This batgrbproduct analysis is done using the HEASARC data.
- 3) This batgrbproduct analysis is using the flight position for the mask-weighting calculation.
======================================================================
BAT GRB EVENT DATA PROCESSING REPORT
Process Script Ver: batgrbproduct v2.46
Process Start Time: Mon Jan 20 11:47:43 EST 2014
Host Name: batevent1
Current Working Dir: /local/data/batevent/batevent_reproc/trigger258408
======================================================================
Trigger: 00258408 Segment: 000
BAT Trigger Time: 191806512 [s; MET]
Trigger Stop: 191806576 [s; MET]
UTC: 2007-01-29T23:35:10.269080 [includes UTCF correction]
Where From?: TDRSS position message
BAT
RA: 37.0138693588457 Dec: 11.6974043453265 [deg; J2000]
Catalogged Source?: NO
Point Source?: YES
GRB Indicated?: YES [ by BAT flight software ]
Image S/N Ratio: 7.28
Image Trigger?: YES
Rate S/N Ratio: 0 [ if not an image trigger ]
Image S/N Ratio: 7.28
Analysis Position: [ source = BAT ]
RA: 37.0138693588457 Dec: 11.6974043453265 [deg; J2000]
Refined Position: [ source = BAT pre-slew burst ]
RA: 37.0139 Dec: 11.6974 [deg; J2000]
{ 02h 28m 03.3s , +11d 41' 50.6" }
+/- 2.45655729298 [arcmin] (estimated 90% radius based on SNR)
SNR: 8.42491143666
Angular difference between the analysis and refined position is 0.001819 arcmin
Partial Coding Fraction: 0.4257812 [ including projection effects ]
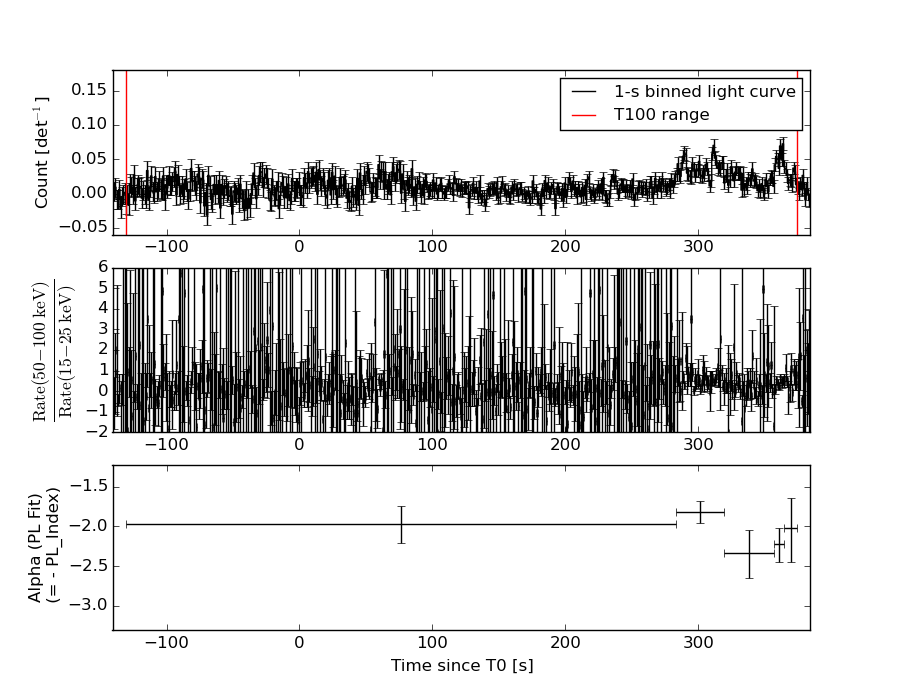
Duration
T90: 459.748000025749 +/- 25.2120545784732
Measured from: -96.7120000123978
to: 363.036000013351 [s; relative to TRIGTIME]
T50: 273.296000003815 +/- 25.2466089568738
Measured from: 39.972000002861
to: 313.268000006676 [s; relative to TRIGTIME]
Fluence
Peak Flux (peak 1 second)
Measured from: 310.567999988794
to: 311.567999988794 [s; relative to TRIGTIME]
Total Fluence
Measured from: -130.611999988556
to: 373.888000011444 [s; relative to TRIGTIME]
Band 1 Band 2 Band 3 Band 4
15-25 25-50 50-100 100-350 keV
Total 2.182987 2.276878 1.114787 0.198249
0.134575 0.141483 0.126909 0.114768 [error]
Peak 0.030356 0.024540 0.015055 0.009168
0.005085 0.005223 0.004722 0.003735 [error]
[ fluence units of on-axis counts / fully illuminated detector ]
======================================================================
====== Table of the duration information =============================
Value tstart tstop
T100 504.500 -130.612 373.888
T90 459.748 -96.712 363.036
T50 273.296 39.972 313.268
Peak 1.000 310.568 311.568
====== Spectral Analysis Summary =====================================
Model : spectral model: simple power-law (PL) and cutoff power-law (CPL)
Ph_index : photon index: E^{Ph_index}
Ph_90err : 90% error of the photon index
Epeak : Epeak in keV
Epeak_90err: 90% error of Epeak
Norm : normalization at 50 keV in both the PL model and CPL model
Nomr_90err : 90% error of the normalization
chi2 : Chi-Squared
dof : degree of freedo
=== Time-averaged spectral analysis ===
(Best model with acceptable fit: PL)
Model Ph_index Ph_90err_low Ph_90err_hi Epeak Epeak_90err_low Epeak_90err_hi Norm Nomr_90err_low Norm_90err_hi chi2 dof
PL -1.990 -0.152 0.146 - - - 6.45e-04 -6.13e-05 6.02e-05 65.570 57
CPL -1.635 -0.523 0.706 43.502 -26.455 -43.502 1.03e-03 -5.32e-04 1.55e-03 64.610 56
=== 1-s peak spectral analysis ===
(Best model with acceptable fit: PL)
Model Ph_index Ph_90err_low Ph_90err_hi Epeak Epeak_90err_low Epeak_90err_hi Norm Nomr_90err_low Norm_90err_hi chi2 dof
PL -1.913 -0.410 0.367 - - - 3.86e-03 -1.08e-03 1.04e-03 64.640 57
CPL -1.387 -0.778 1.845 46.073 N/A N/A 8.03e-03 N/A N/A 64.240 56
=== Fluence/Peak Flux Summary ===
Model Band1 Band2 Band3 Band4 Band5 Total
15-25 25-50 50-100 100-350 15-150 15-350 keV
Fluence PL 6.60e-07 9.01e-07 9.07e-07 1.66e-06 3.00e-06 4.12e-06 erg/cm2
90%_error_low -7.14e-08 -6.64e-08 -1.19e-07 -4.00e-07 -2.67e-07 -5.33e-07 erg/cm2
90%_error_hi 7.33e-08 6.64e-08 1.21e-07 4.81e-07 2.72e-07 5.96e-07 erg/cm2
Peak flux PL 2.36e-01 1.86e-01 9.91e-02 7.65e-02 5.56e-01 5.98e-01 ph/cm2/s
90%_error_low -6.52e-02 -3.97e-02 -3.49e-02 -4.11e-02 -1.17e-01 -1.30e-01 ph/cm2/s
90%_error_hi 6.74e-02 3.95e-02 3.64e-02 6.28e-02 1.17e-01 1.32e-01 ph/cm2/s
Fluence CPL 6.36e-07 9.36e-07 8.92e-07 8.70e-07 2.88e-06 3.33e-06 erg/cm2
90%_error_low -8.30e-08 -1.08e-07 -1.35e-07 -5.55e-07 -3.29e-07 -6.69e-07 erg/cm2
90%_error_hi 8.30e-08 9.18e-08 1.29e-07 1.27e-06 3.40e-07 1.36e-06 erg/cm2
Peak flux CPL 2.29e-01 2.00e-01 9.66e-02 3.42e-02 5.49e-01 5.60e-01 ph/cm2/s
90%_error_low -7.09e-02 -8.85e-02 -4.50e-02 -3.42e-02 -1.18e-01 -1.26e-01 ph/cm2/s
90%_error_hi 7.05e-02 5.49e-02 3.96e-02 5.66e-02 1.19e-01 7.78e-02 ph/cm2/s
======================================================================
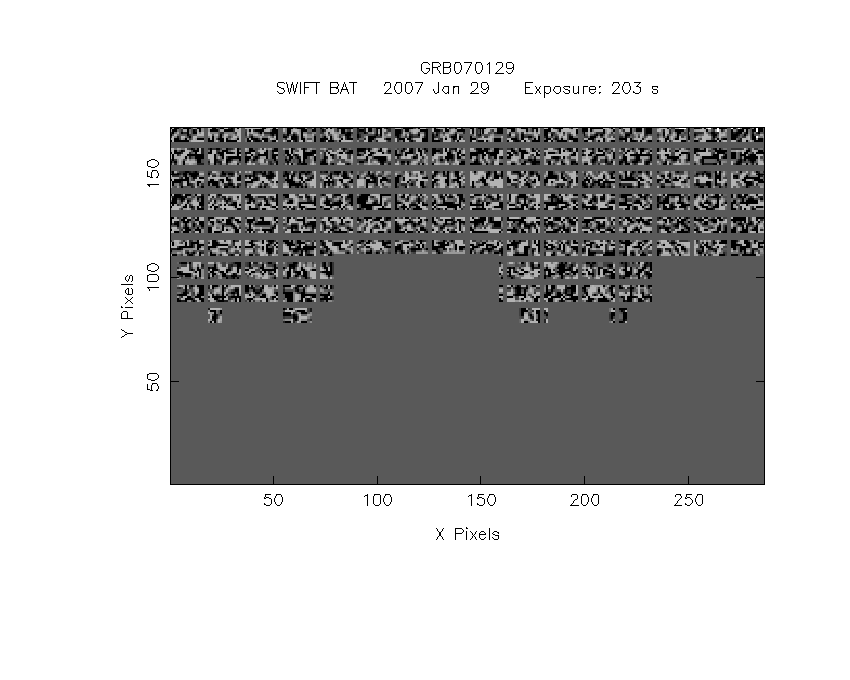
Image
Pre-slew 15.0-50.0 keV image (Event data)
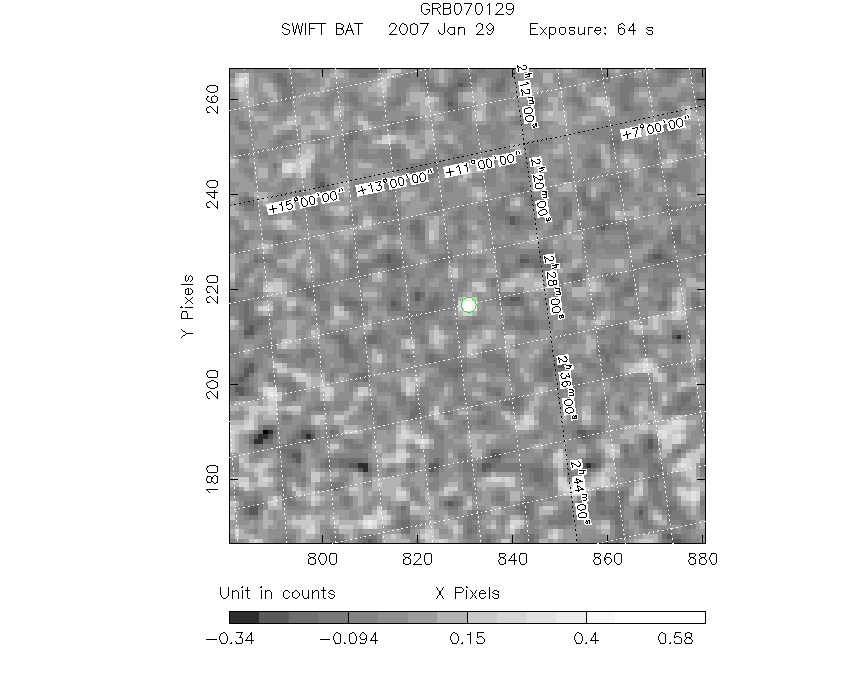
#RAcent DECcent POSerr Theta  Phi  Peak_Cts  SNR Name
37.014 11.697 0.000 29.057 79.341 0.698 8.425 TRIG_00258408

Image time interval: 0.000 to 64.000 [sec]
Light Curves
Note: The mask-weighted lightcurves have units of either count/det or counts/sec/det, where a det is 0.4 x 0.4 = 0.16 sq cm.
Full-time range; 1 s binning
Other quick-look light curves:
- 64 ms binning (zoomed)
- 16 ms binning (zoomed)
- 8 ms binning (zoomed)
- 2 ms binning (zoomed)
- SN=5 or 10 s binning (full-time range)
- Raw light curve
Spectra
- 64 ms binning (zoomed)
- 16 ms binning (zoomed)
- 8 ms binning (zoomed)
- 2 ms binning (zoomed)
- SN=5 or 10 s binning (full-time range)
- Raw light curve
Spectra
Notes:
- 1) The fitting includes the systematic errors.
- 2) When the burst includes telescope slew time periods, the fitting uses an average response file made from multiple 5-s response files through out the slew time plus single time preiod for the non-slew times, and weighted by the total counts in the corresponding time period using addrmf. An average response file is needed becuase a spectral fit using the pre-slew DRM will introduce some errors in both a spectral shape and a normalization if the PHA file contains a lot of the slew/post-slew time interval.
- 3) For fits to more complicated models (e.g. a power-law over a cutoff power-law), the BAT team has decided to require a chi-square improvement of more than 6 for each extra dof.
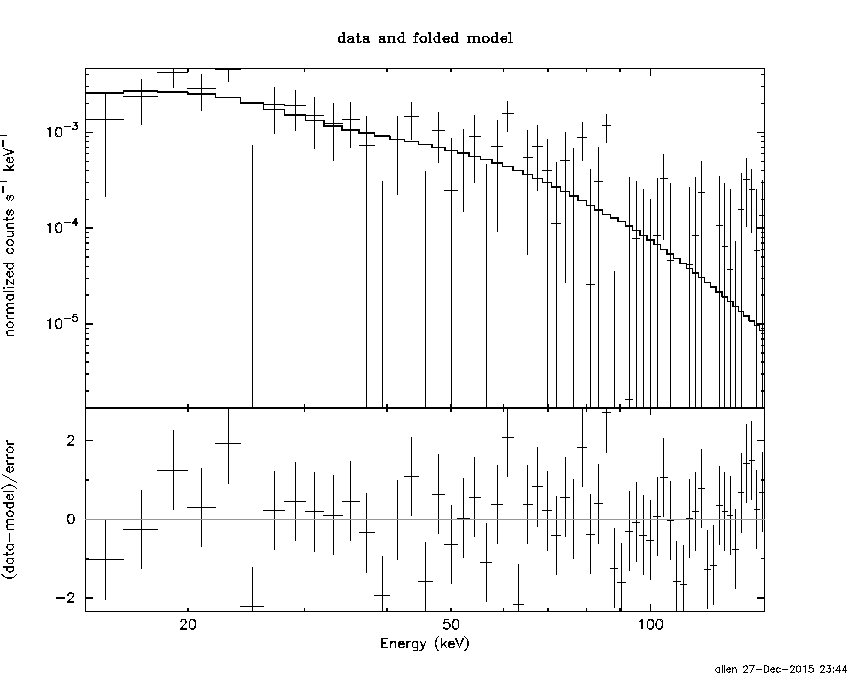
Time averaged spectrum fit using the average DRM
Power-law model
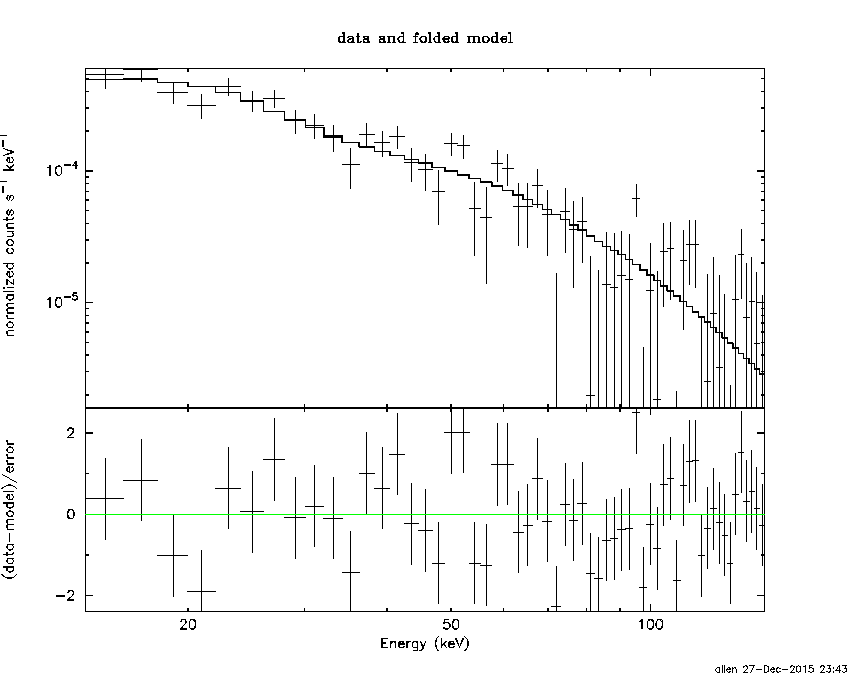
Time interval is from -130.612 sec. to  373.888 sec.

Spectral model in power-law:
------------------------------------------------------------
Parameters  : value       lower 90%   higher 90%
Photon index: -1.98959     ( -0.151615   0.145678 )
Norm@50keV  : 6.45477E-04    ( -6.13197e-05   6.02093e-05 )
------------------------------------------------------------
#Fit statistic : Chi-Squared =          65.57 using 59 PHA bins.
# Reduced chi-squared =          1.150 for     57 degrees of freedom
# Null hypothesis probability =   2.039209e-01

Photon flux (15-150 keV)    in 504.5 sec: 9.63680E-02 ( -0.0071139  0.007117 ) ph/cm2/s
Energy fluence (15-150 keV)             : 3.002e-06 ( -2.66789e-07  2.71866e-07 ) ergs/cm2
Cutoff power-law model
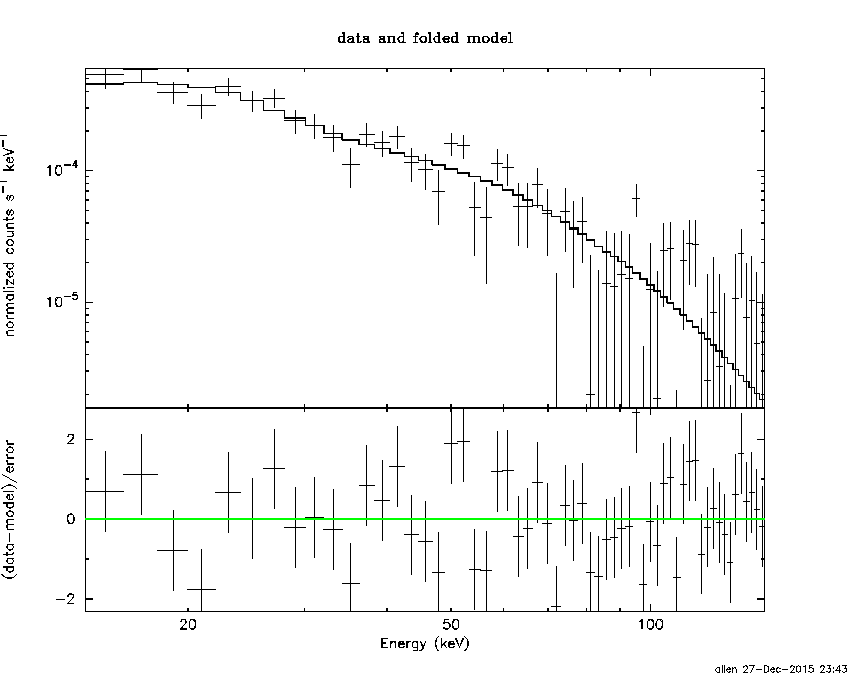
Time interval is from -130.612 sec. to  373.888 sec.
Spectral model in the cutoff power-law:
------------------------------------------------------------
Parameters  : value       lower 90%   higher 90%
Photon index: -1.63464     ( -0.523302   0.706076 )
Epeak [keV] : 43.5024      ( -26.455 -43.5022 )
Norm@50keV  : 1.02710E-03    ( -0.000531627   0.00155419 )
------------------------------------------------------------
#Fit statistic : Chi-Squared =          64.61 using 59 PHA bins.
# Reduced chi-squared =          1.154 for     56 degrees of freedom
# Null hypothesis probability =   2.010613e-01

Photon flux (15-150 keV)    in 504.5 sec: 9.45813E-02 ( -0.0077499  0.0077307 ) ph/cm2/s
Energy fluence (15-150 keV)             : 2.88019e-06 ( -3.28717e-07  3.39626e-07 ) ergs/cm2
1-s peak spectrum fit
Power-law model
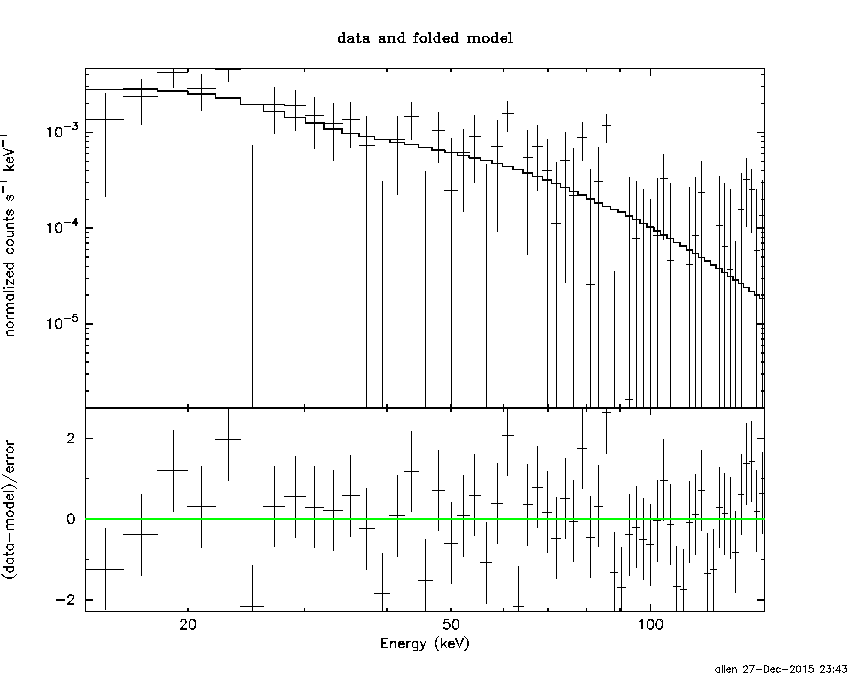
Time interval is from  310.568 sec. to  311.568 sec.

Spectral model in power-law:
------------------------------------------------------------
Parameters  : value       lower 90%   higher 90%
Photon index: -1.91253     ( -0.410395   0.366824 )
Norm@50keV  : 3.85674E-03    ( -0.00108466   0.00104108 )
------------------------------------------------------------
#Fit statistic : Chi-Squared =          64.64 using 59 PHA bins.
# Reduced chi-squared =          1.134 for     57 degrees of freedom
# Null hypothesis probability =   2.272289e-01

Photon flux (15-150 keV)    in 1 sec: 0.556485 ( -0.116811  0.116846 ) ph/cm2/s
Energy fluence (15-150 keV)             : 3.54683e-08 ( -9.35992e-09  9.85067e-09 ) ergs/cm2
Cutoff power-law model
Time interval is from  310.568 sec. to  311.568 sec.
Spectral model in the cutoff power-law:
------------------------------------------------------------
Parameters  : value       lower 90%   higher 90%
Photon index: -1.38667     ( -0.777682   1.845 )
Epeak [keV] : 46.0731      (   )
Norm@50keV  : 8.03422E-03    (     )
------------------------------------------------------------
#Fit statistic : Chi-Squared =          64.24 using 59 PHA bins.
# Reduced chi-squared =          1.147 for     56 degrees of freedom
# Null hypothesis probability =   2.102817e-01

Photon flux (15-150 keV)    in 1 sec: 0.548625 ( -0.117735  0.11857 ) ph/cm2/s
Energy fluence (15-150 keV)             : 3.3246e-08 ( -1.00774e-08  1.06495e-08 ) ergs/cm2
Time-resolved spectra
Distribution
T90 vs. Hardness ratio plot
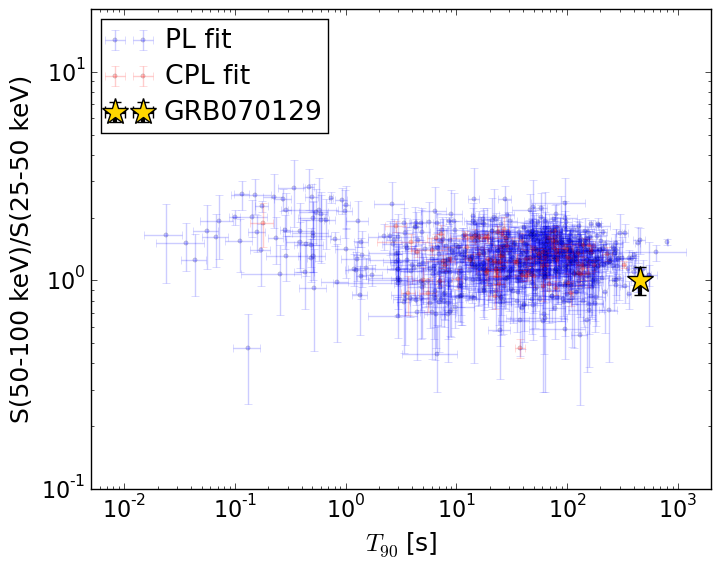
T90                                   = 459.748 sec.
Hardness ratio (energy fluence ratio) = 1.00727947859
S(15-50 keV) vs. S(50-150 keV) plot
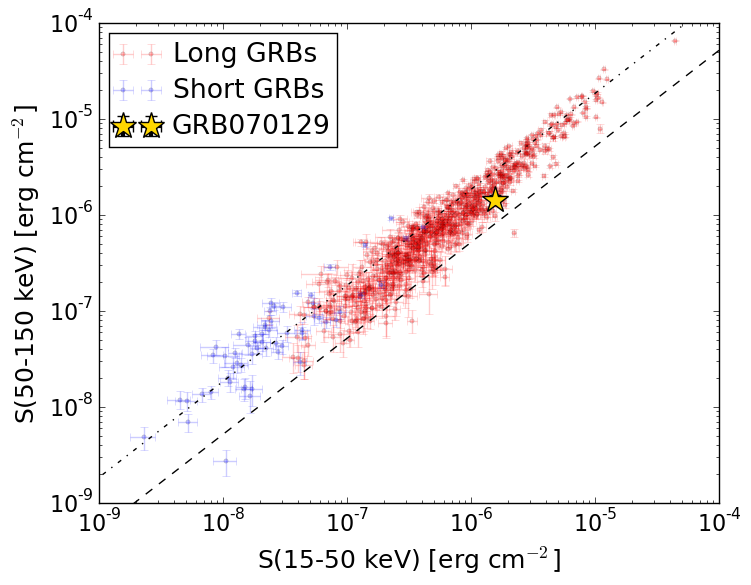
S(15-50 keV)  = 1.5607172e-06
S(50-150 keV) = 1.4412869e-06
The dash-dotted line and the dashed line traces the fluences calculated from the Band function with Epeak = 15 and 150 keV, respectively. Both lines assume a canonical values of alpha = -1 and beta = -2.5.
Mask shadow pattern
IMX = 0.102762484959, IMY = -0.546020944351
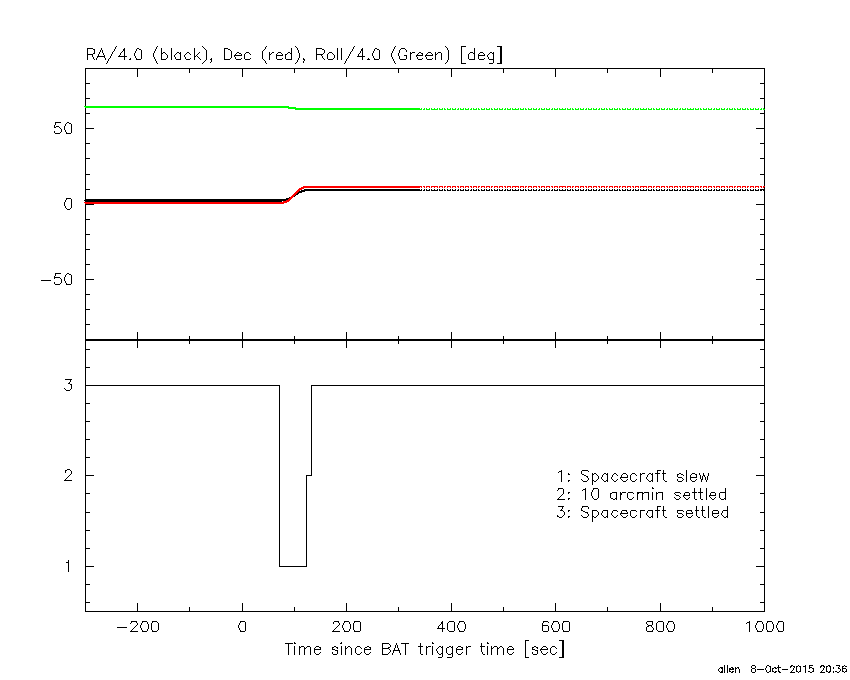
Spacecraft aspect plot
Bright source in the pre-burst/pre-slew/post-slew images
Pre-burst image of 15-350 keV band
Time interval of the image:
-239.000000 -130.612000

# RAcent  DECcent POSerr Theta    Phi  PeakCts   SNR AngSep     Name
#  [deg]    [deg]    ['] [deg]  [deg]                   [']
326.1498  38.2903   22.2  54.8  -29.3  -0.2567  -0.5    2.1	Cyg X-2
 18.2820  48.0035    2.4  47.7   19.9   1.3382   4.9 ------	UNKNOWN
330.7031 -12.6310    2.5  41.1  -98.2   2.3259   4.7 ------	UNKNOWN
Pre-slew background subtracted image of 15-350 keV band
Time interval of the image:
-130.612000 72.100600

# RAcent  DECcent POSerr Theta    Phi  PeakCts   SNR AngSep     Name
#  [deg]    [deg]    ['] [deg]  [deg]                   [']
326.0678  38.2103   12.6  54.8  -29.4   0.9201   0.9    8.3	Cyg X-2
 36.9945  11.7127    1.8  29.0   79.3   2.1965   6.3 ------	UNKNOWN
 16.1276  37.4404    2.3  37.0   20.6   1.6964   5.1 ------	UNKNOWN
Post-slew image of 15-350 keV band
Time interval of the image:
123.100600 963.101700

# RAcent  DECcent POSerr Theta    Phi  PeakCts   SNR AngSep     Name
#  [deg]    [deg]    ['] [deg]  [deg]                   [']
  8.9006  64.9987    3.1  56.7    4.7   7.7498   3.7 ------	UNKNOWN
 37.0202  11.6965    1.1   0.0  105.7   4.0367  10.5 ------	UNKNOWN
357.1600  58.3675    3.1  55.5   -5.6   4.9080   3.8 ------	UNKNOWN
  3.7494  20.2438    3.2  33.0  -52.2   2.3796   3.7 ------	UNKNOWN