Analysis Summary
Notes:
- 1) No attempt has been made to eliminate the non-significant decimal places.
- 2) This batgrbproduct analysis is done using the HEASARC data.
- 3) This batgrbproduct analysis is using the flight position for the mask-weighting calculation.
======================================================================
BAT GRB EVENT DATA PROCESSING REPORT
Process Script Ver: batgrbproduct v2.46
Process Start Time: Mon Jan 20 11:43:22 EST 2014
Host Name: batevent1
Current Working Dir: /local/data/batevent/batevent_reproc/trigger259714
======================================================================
Trigger: 00259714 Segment: 000
BAT Trigger Time: 192618636.032 [s; MET]
Trigger Stop: 192618637.44 [s; MET]
UTC: 2007-02-08T09:10:34.281260 [includes UTCF correction]
Where From?: TDRSS position message
BAT
RA: 197.920440046571 Dec: 61.9586566987151 [deg; J2000]
Catalogged Source?: NO
Point Source?: YES
GRB Indicated?: YES [ by BAT flight software ]
Image S/N Ratio: 7.29
Image Trigger?: NO
Rate S/N Ratio: 10.0498756211209 [ if not an image trigger ]
Image S/N Ratio: 7.29
Analysis Position: [ source = BAT ]
RA: 197.920440046571 Dec: 61.9586566987151 [deg; J2000]
Refined Position: [ source = BAT pre-slew burst ]
RA: 197.92 Dec: 61.9587 [deg; J2000]
{ 13h 11m 40.8s , +61d 57' 31.3" }
+/- 3.12315411088 [arcmin] (estimated 90% radius based on SNR)
SNR: 5.97878830649
Angular difference between the analysis and refined position is 0.012681 arcmin
Partial Coding Fraction: 0.5078125 [ including projection effects ]
Duration
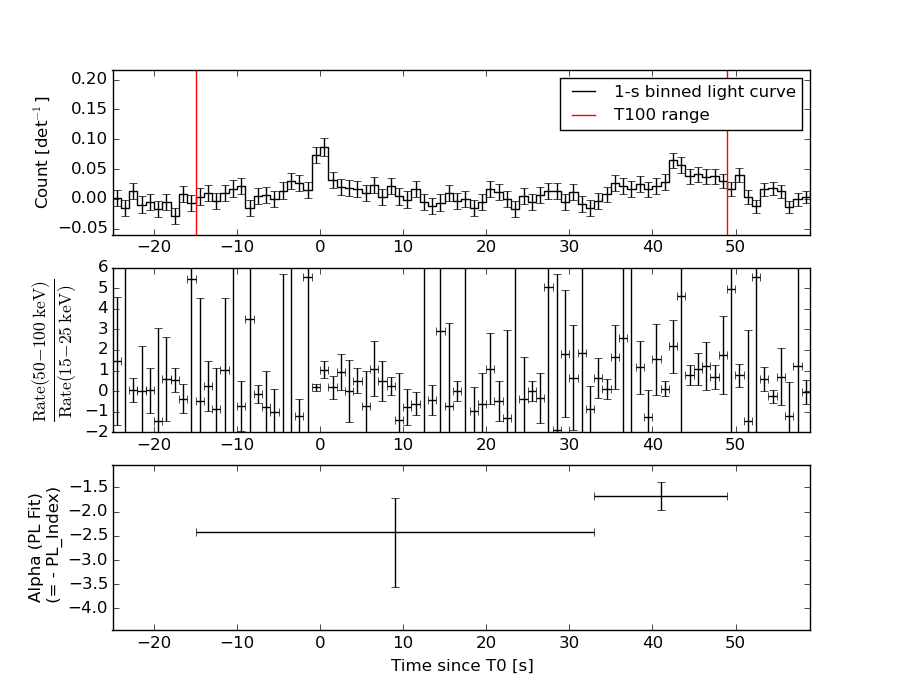
T90: 64 +/- 22.6274169979695
Measured from: -15.0320000052452
to: 48.9679999947548 [s; relative to TRIGTIME]
T50: 48 +/- 16
Measured from: -15.0320000052452
to: 32.9679999947548 [s; relative to TRIGTIME]
Fluence
Peak Flux (peak 1 second)
Measured from: 40.4679999947548
to: 41.4679999947548 [s; relative to TRIGTIME]
Total Fluence
Measured from: -15.0320000052452
to: 48.9679999947548 [s; relative to TRIGTIME]
Band 1 Band 2 Band 3 Band 4
15-25 25-50 50-100 100-350 keV
Total 0.298903 0.328131 0.256813 0.033002
0.056884 0.059151 0.051824 0.045397 [error]
Peak 0.015963 0.011216 0.017990 0.003709
0.006936 0.007123 0.006438 0.005589 [error]
[ fluence units of on-axis counts / fully illuminated detector ]
======================================================================
====== Table of the duration information =============================
Value tstart tstop
T100 64.000 -15.032 48.968
T90 64.000 -15.032 48.968
T50 48.000 -15.032 32.968
Peak 1.000 40.468 41.468
====== Spectral Analysis Summary =====================================
Model : spectral model: simple power-law (PL) and cutoff power-law (CPL)
Ph_index : photon index: E^{Ph_index}
Ph_90err : 90% error of the photon index
Epeak : Epeak in keV
Epeak_90err: 90% error of Epeak
Norm : normalization at 50 keV in both the PL model and CPL model
Nomr_90err : 90% error of the normalization
chi2 : Chi-Squared
dof : degree of freedo
=== Time-averaged spectral analysis ===
(Best model with acceptable fit: PL)
Model Ph_index Ph_90err_low Ph_90err_hi Epeak Epeak_90err_low Epeak_90err_hi Norm Nomr_90err_low Norm_90err_hi chi2 dof
PL -1.968 -0.385 0.340 - - - 8.79e-04 -2.13e-04 2.02e-04 38.440 57
CPL -1.651 -0.529 1.403 51.290 -49.977 -51.290 1.30e-03 -1.30e-03 5.90e-03 38.220 56
=== 1-s peak spectral analysis ===
(Best model with acceptable fit: N/A)
Model Ph_index Ph_90err_low Ph_90err_hi Epeak Epeak_90err_low Epeak_90err_hi Norm Nomr_90err_low Norm_90err_hi chi2 dof
PL -1.094 -0.823 1.017 - - - 3.26e-03 -1.57e-03 1.44e-03 50.280 57
CPL -1.089 -0.827 1.025 9999.340 -9999.340 -9999.340 3.28e-03 -1.57e-03 9.05e-02 50.280 56
=== Fluence/Peak Flux Summary ===
Model Band1 Band2 Band3 Band4 Band5 Total
15-25 25-50 50-100 100-350 15-150 15-350 keV
Fluence PL 1.12e-07 1.55e-07 1.58e-07 2.94e-07 5.18e-07 7.19e-07 erg/cm2
90%_error_low -2.90e-08 -2.89e-08 -5.07e-08 -1.53e-07 -1.16e-07 -2.17e-07 erg/cm2
90%_error_hi 3.04e-08 2.88e-08 5.16e-08 2.30e-07 1.19e-07 2.76e-07 erg/cm2
Peak flux PL 9.12e-02 1.17e-01 1.10e-01 1.81e-01 3.78e-01 4.98e-01 ph/cm2/s
90%_error_low -7.14e-02 -1.17e-01 -5.25e-02 -1.81e-01 -1.76e-01 -2.15e-01 ph/cm2/s
90%_error_hi 1.01e-01 6.56e-02 5.00e-02 2.96e-01 1.79e-01 2.37e-01 ph/cm2/s
Fluence CPL 1.07e-07 1.61e-07 1.60e-07 1.81e-07 5.08e-07 6.09e-07 erg/cm2
90%_error_low -3.40e-08 -6.38e-08 -5.32e-08 -1.48e-07 -1.18e-07 -2.04e-07 erg/cm2
90%_error_hi 3.16e-08 3.73e-08 5.44e-08 1.13e-07 1.29e-07 2.85e-07 erg/cm2
Peak flux CPL 1.01e-01 1.18e-01 1.08e-01 2.00e-01 3.82e-01 5.00e-01 ph/cm2/s
90%_error_low N/A -1.18e-01 -5.17e-02 N/A -3.82e-01 -2.76e-01 ph/cm2/s
90%_error_hi N/A 6.86e-02 6.05e-02 N/A 1.83e-01 2.32e-01 ph/cm2/s
======================================================================
Image
Pre-slew 25.0-100.0 keV image (Event data)
#RAcent DECcent POSerr Theta  Phi  Peak_Cts  SNR Name
197.920 61.959 0.000 39.456 -27.329 0.078 5.979 TRIG_00259714

Image time interval: 0.000 to 1.408 [sec]
Light Curves
Note: The mask-weighted lightcurves have units of either count/det or counts/sec/det, where a det is 0.4 x 0.4 = 0.16 sq cm.
Full-time range; 1 s binning
Other quick-look light curves:
- 64 ms binning (zoomed)
- 16 ms binning (zoomed)
- 8 ms binning (zoomed)
- 2 ms binning (zoomed)
- SN=5 or 10 s binning (full-time range)
- Raw light curve
Spectra
- 64 ms binning (zoomed)
- 16 ms binning (zoomed)
- 8 ms binning (zoomed)
- 2 ms binning (zoomed)
- SN=5 or 10 s binning (full-time range)
- Raw light curve
Spectra
Notes:
- 1) The fitting includes the systematic errors.
- 2) When the burst includes telescope slew time periods, the fitting uses an average response file made from multiple 5-s response files through out the slew time plus single time preiod for the non-slew times, and weighted by the total counts in the corresponding time period using addrmf. An average response file is needed becuase a spectral fit using the pre-slew DRM will introduce some errors in both a spectral shape and a normalization if the PHA file contains a lot of the slew/post-slew time interval.
- 3) For fits to more complicated models (e.g. a power-law over a cutoff power-law), the BAT team has decided to require a chi-square improvement of more than 6 for each extra dof.
Time averaged spectrum fit using the average DRM
Power-law model
Time interval is from  -15.032 sec. to   48.968 sec.

Spectral model in power-law:
------------------------------------------------------------
Parameters  : value       lower 90%   higher 90%
Photon index: -1.96834     ( -0.384601   0.340247 )
Norm@50keV  : 8.79065E-04    ( -0.000212885   0.000201839 )
------------------------------------------------------------
#Fit statistic : Chi-Squared =          38.44 using 59 PHA bins.
# Reduced chi-squared =         0.6744 for     57 degrees of freedom
# Null hypothesis probability =   9.718691e-01

Photon flux (15-150 keV)    in 64 sec: 0.129986 ( -0.024153  0.024162 ) ph/cm2/s
Energy fluence (15-150 keV)             : 5.18167e-07 ( -1.15506e-07  1.18834e-07 ) ergs/cm2
Cutoff power-law model
Time interval is from  -15.032 sec. to   48.968 sec.
Spectral model in the cutoff power-law:
------------------------------------------------------------
Parameters  : value       lower 90%   higher 90%
Photon index: -1.65099     ( -0.530835   1.40069 )
Epeak [keV] : 51.2900      ( -49.9107 -51.2237 )
Norm@50keV  : 1.30418E-03    ( -0.00130738   0.00590022 )
------------------------------------------------------------
#Fit statistic : Chi-Squared =          38.22 using 59 PHA bins.
# Reduced chi-squared =         0.6826 for     56 degrees of freedom
# Null hypothesis probability =   9.667414e-01

Photon flux (15-150 keV)    in 64 sec: 0.128566 ( -0.024686  0.024664 ) ph/cm2/s
Energy fluence (15-150 keV)             : 5.08335e-07 ( -1.18366e-07  1.29253e-07 ) ergs/cm2
1-s peak spectrum fit
Power-law model
Time interval is from   40.468 sec. to   41.468 sec.

Spectral model in power-law:
------------------------------------------------------------
Parameters  : value       lower 90%   higher 90%
Photon index: -1.09404     ( -0.822778   1.01655 )
Norm@50keV  : 3.26414E-03    ( -0.00156786   0.00144146 )
------------------------------------------------------------
#Fit statistic : Chi-Squared =          50.28 using 59 PHA bins.
# Reduced chi-squared =         0.8821 for     57 degrees of freedom
# Null hypothesis probability =   7.233181e-01

Photon flux (15-150 keV)    in 1 sec: 0.378401 ( -0.175725  0.178959 ) ph/cm2/s
Energy fluence (15-150 keV)             : 3.41964e-08 ( -1.54947e-08  1.56886e-08 ) ergs/cm2
Cutoff power-law model

Time interval is from   40.468 sec. to   41.468 sec.
Spectral model in the cutoff power-law:
------------------------------------------------------------
Parameters  : value       lower 90%   higher 90%
Photon index: -1.08871     ( -0.827023   1.02531 )
Epeak [keV] : 9999.34      ( -9999.36 -9999.36 )
Norm@50keV  : 3.28145E-03    ( -0.00156795   0.0904732 )
------------------------------------------------------------
#Fit statistic : Chi-Squared =          50.28 using 59 PHA bins.
# Reduced chi-squared =         0.8979 for     56 degrees of freedom
# Null hypothesis probability =   6.901041e-01

Photon flux (15-150 keV)    in 1 sec: 0.381879 ( -0.381879  0.182649 ) ph/cm2/s
Energy fluence (15-150 keV)             : 3.43416e-08 ( -1.64442e-08  1.26035e-08 ) ergs/cm2
Time-resolved spectra
Distribution
T90 vs. Hardness ratio plot
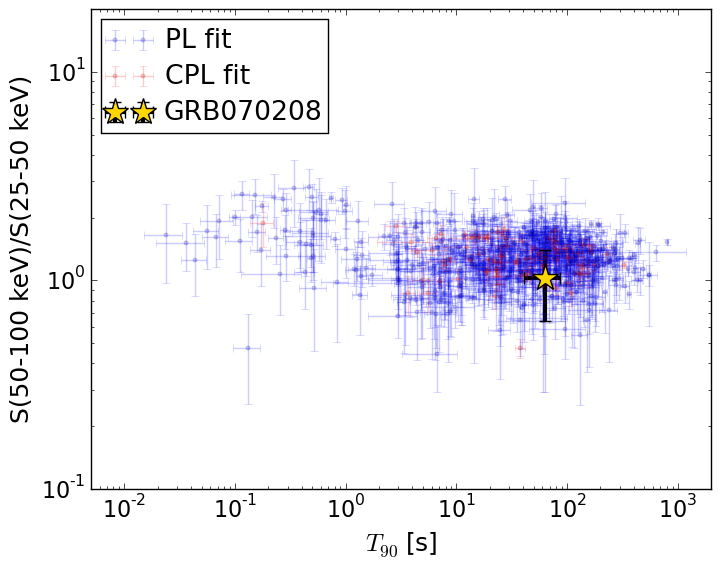
T90                                   = 64.0 sec.
Hardness ratio (energy fluence ratio) = 1.022233585
S(15-50 keV) vs. S(50-150 keV) plot

S(15-50 keV)  = 2.662228e-07
S(50-150 keV) = 2.5193822e-07
The dash-dotted line and the dashed line traces the fluences calculated from the Band function with Epeak = 15 and 150 keV, respectively. Both lines assume a canonical values of alpha = -1 and beta = -2.5.
Mask shadow pattern
IMX = 0.731177215682, IMY = 0.377855168207
Spacecraft aspect plot
Bright source in the pre-burst/pre-slew/post-slew images
Pre-burst image of 15-350 keV band
Time interval of the image:
-239.032000 -15.032000

# RAcent  DECcent POSerr Theta    Phi  PeakCts   SNR AngSep     Name
#  [deg]    [deg]    ['] [deg]  [deg]                   [']
 83.6300  22.0117    0.7  50.3 -161.7   7.5872  17.2    0.2	Crab
114.9921   5.7993    2.0  42.1  151.2   2.0492   5.7 ------	UNKNOWN
103.3975  14.5042    2.4  41.4  172.8   1.3911   4.8 ------	UNKNOWN
 80.3697  12.2662    2.5  58.9 -168.5   4.6613   4.7 ------	UNKNOWN
187.1259  63.7221    2.4  34.9  -31.5   1.0983   4.9 ------	UNKNOWN
Pre-slew background subtracted image of 15-350 keV band
Time interval of the image:
-15.032000 27.868600

# RAcent  DECcent POSerr Theta    Phi  PeakCts   SNR AngSep     Name
#  [deg]    [deg]    ['] [deg]  [deg]                   [']
 83.6798  22.1449   15.2  50.2 -161.6  -0.1170  -0.8    8.2	Crab
126.7399  -2.5471    2.2  45.9  131.2   1.4527   5.2 ------	UNKNOWN
197.8975  61.9381    2.2  39.4  -27.3   0.5095   5.2 ------	UNKNOWN
Post-slew image of 15-350 keV band
Time interval of the image:
98.868600 603.018000

# RAcent  DECcent POSerr Theta    Phi  PeakCts   SNR AngSep     Name
#  [deg]    [deg]    ['] [deg]  [deg]                   [']
254.4504  35.4696   10.7  43.7  -56.1   3.6213   1.1    7.6	Her X-1
160.6103  32.6442    2.5  37.7   80.2  11.8307   4.6 ------	UNKNOWN
180.0529  63.5187    2.9   8.3  132.6   3.5089   4.0 ------	UNKNOWN
164.9911  69.4096    2.8  15.2  157.0   3.5680   4.1 ------	UNKNOWN
228.0072  30.5205    2.6  37.0  -22.2   5.3369   4.5 ------	UNKNOWN