Analysis Summary
Notes:
- 1) No attempt has been made to eliminate the non-significant decimal places.
- 2) This batgrbproduct analysis is done using the HEASARC data.
- 3) This batgrbproduct analysis is using the flight position for the mask-weighting calculation.
======================================================================
BAT GRB EVENT DATA PROCESSING REPORT
Process Script Ver: batgrbproduct v2.46
Process Start Time: Mon Jan 20 11:23:31 EST 2014
Host Name: batevent1
Current Working Dir: /local/data/batevent/batevent_reproc/trigger261664
======================================================================
Trigger: 00261664 Segment: 000
BAT Trigger Time: 193886102.464 [s; MET]
Trigger Stop: 193886105.536 [s; MET]
UTC: 2007-02-23T01:15:00.682000 [includes UTCF correction]
Where From?: TDRSS position message
BAT
RA: 153.452397388761 Dec: 43.1212182236162 [deg; J2000]
Catalogged Source?: NO
Point Source?: YES
GRB Indicated?: YES [ by BAT flight software ]
Image S/N Ratio: 7.24
Image Trigger?: NO
Rate S/N Ratio: 8.42614977317636 [ if not an image trigger ]
Image S/N Ratio: 7.24
Analysis Position: [ source = BAT ]
RA: 153.452397388761 Dec: 43.1212182236162 [deg; J2000]
Refined Position: [ source = BAT pre-slew burst ]
RA: 153.455316888074 Dec: 43.1318306437692 [deg; J2000]
{ 10h 13m 49.3s , +43d 07' 54.6" }
+/- 1.2612021298917 [arcmin] (estimated 90% radius based on SNR)
+/- 0.545916017402036 [arcmin] (formal 1-sigma fit error)
SNR: 21.8343487872758
Angular difference between the analysis and refined position is 0.649453 arcmin
Partial Coding Fraction: 0.828125 [ including projection effects ]
Duration
T90: 128 +/- 32
Measured from: 0.53600001335144
to: 128.536000013351 [s; relative to TRIGTIME]
T50: 64 +/- 16
Measured from: 0.53600001335144
to: 64.5360000133514 [s; relative to TRIGTIME]
Fluence
Peak Flux (peak 1 second)
Measured from: 8.03600001335144
to: 9.03600001335144 [s; relative to TRIGTIME]
Total Fluence
Measured from: 0.53600001335144
to: 144.536000013351 [s; relative to TRIGTIME]
Band 1 Band 2 Band 3 Band 4
15-25 25-50 50-100 100-350 keV
Total 1.116345 1.242207 0.762936 0.083699
0.062358 0.066667 0.062453 0.066258 [error]
Peak 0.020906 0.023665 0.005270 0.012255
0.005769 0.006176 0.005838 0.005844 [error]
[ fluence units of on-axis counts / fully illuminated detector ]
======================================================================
====== Table of the duration information =============================
Value tstart tstop
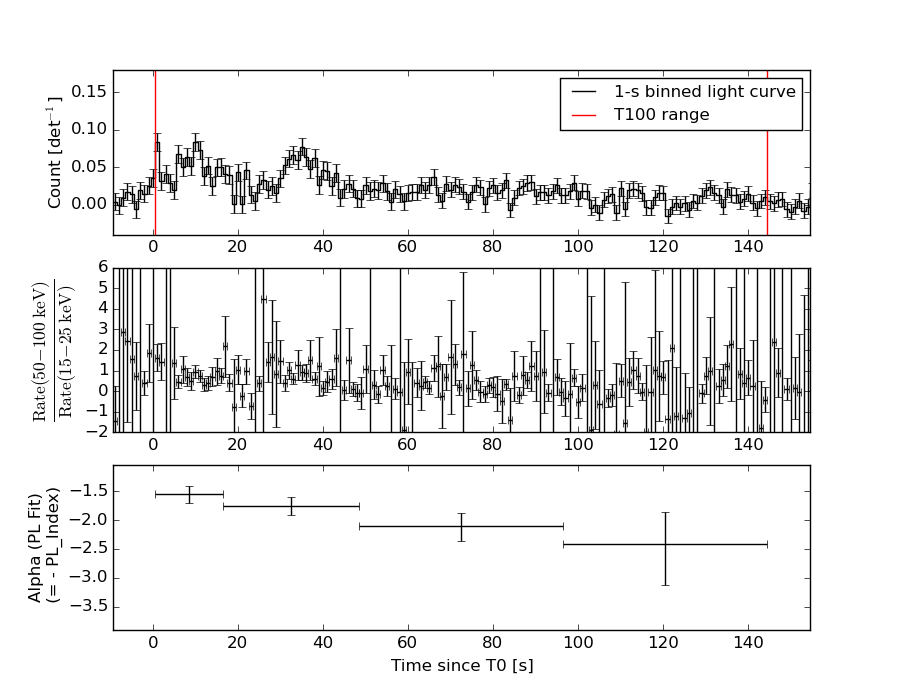
T100 144.000 0.536 144.536
T90 128.000 0.536 128.536
T50 64.000 0.536 64.536
Peak 1.000 8.036 9.036
====== Spectral Analysis Summary =====================================
Model : spectral model: simple power-law (PL) and cutoff power-law (CPL)
Ph_index : photon index: E^{Ph_index}
Ph_90err : 90% error of the photon index
Epeak : Epeak in keV
Epeak_90err: 90% error of Epeak
Norm : normalization at 50 keV in both the PL model and CPL model
Nomr_90err : 90% error of the normalization
chi2 : Chi-Squared
dof : degree of freedo
=== Time-averaged spectral analysis ===
(Best model with acceptable fit: PL)
Model Ph_index Ph_90err_low Ph_90err_hi Epeak Epeak_90err_low Epeak_90err_hi Norm Nomr_90err_low Norm_90err_hi chi2 dof
PL -1.885 -0.125 0.122 - - - 1.35e-03 -1.04e-04 1.02e-04 57.150 57
CPL -1.480 -0.460 0.534 54.437 -14.446 -54.437 2.29e-03 -9.84e-04 2.27e-03 55.010 56
=== 1-s peak spectral analysis ===
(Best model with acceptable fit: N/A)
Model Ph_index Ph_90err_low Ph_90err_hi Epeak Epeak_90err_low Epeak_90err_hi Norm Nomr_90err_low Norm_90err_hi chi2 dof
PL -1.724 -0.695 0.643 - - - 3.29e-03 -1.39e-03 1.29e-03 55.960 57
CPL -1.731 -0.689 0.653 9999.310 -9999.300 -9999.310 3.29e-03 N/A N/A 55.960 56
=== Fluence/Peak Flux Summary ===
Model Band1 Band2 Band3 Band4 Band5 Total
15-25 25-50 50-100 100-350 15-150 15-350 keV
Fluence PL 3.56e-07 5.18e-07 5.61e-07 1.13e-06 1.79e-06 2.57e-06 erg/cm2
90%_error_low -3.38e-08 -3.24e-08 -5.96e-08 -2.28e-07 -1.35e-07 -2.91e-07 erg/cm2
90%_error_hi 3.45e-08 3.24e-08 6.04e-08 2.66e-07 1.37e-07 3.21e-07 erg/cm2
Peak flux PL 1.68e-01 1.48e-01 8.98e-02 8.21e-02 4.41e-01 4.88e-01 ph/cm2/s
90%_error_low -8.06e-02 -4.91e-02 -4.64e-02 -8.21e-02 -1.46e-01 -1.68e-01 ph/cm2/s
90%_error_hi 8.54e-02 4.91e-02 4.93e-02 1.26e-01 1.46e-01 1.76e-01 ph/cm2/s
Fluence CPL 3.42e-07 5.41e-07 5.50e-07 5.45e-07 1.70e-06 1.98e-06 erg/cm2
90%_error_low -3.83e-08 -4.18e-08 -6.73e-08 -2.97e-07 -1.64e-07 -3.49e-07 erg/cm2
90%_error_hi 3.84e-08 4.28e-08 6.51e-08 6.64e-07 1.69e-07 7.05e-07 erg/cm2
Peak flux CPL 1.70e-01 1.48e-01 8.97e-02 8.19e-02 4.42e-01 4.91e-01 ph/cm2/s
90%_error_low -8.62e-02 N/A N/A N/A -1.47e-01 -2.33e-01 ph/cm2/s
90%_error_hi 8.80e-02 N/A N/A N/A 1.45e-01 1.59e-01 ph/cm2/s
======================================================================
Image
Pre-slew 15.0-350.0 keV image (Event data)

#   RAcent    DECcent   POSerr    Theta     Phi              Peak Cts       SNR   Name
  153.4553    43.1318   0.0088    28.1888   173.4214         1.7493860     21.834 TRIG_00261664

Foreground time interval of the image:
  0.536  39.837 (delta_t =  39.301 [sec])
Background time interval of the image:
-239.464   0.536 (delta_t = 240.000 [sec])
Light Curves
Note: The mask-weighted lightcurves have units of either count/det or counts/sec/det, where a det is 0.4 x 0.4 = 0.16 sq cm.
Full-time range; 1 s binning
Other quick-look light curves:
- 64 ms binning (zoomed)
- 16 ms binning (zoomed)
- 8 ms binning (zoomed)
- 2 ms binning (zoomed)
- SN=5 or 10 s binning (full-time range)
- Raw light curve
Spectra
- 64 ms binning (zoomed)
- 16 ms binning (zoomed)
- 8 ms binning (zoomed)
- 2 ms binning (zoomed)
- SN=5 or 10 s binning (full-time range)
- Raw light curve
Spectra
Notes:
- 1) The fitting includes the systematic errors.
- 2) When the burst includes telescope slew time periods, the fitting uses an average response file made from multiple 5-s response files through out the slew time plus single time preiod for the non-slew times, and weighted by the total counts in the corresponding time period using addrmf. An average response file is needed becuase a spectral fit using the pre-slew DRM will introduce some errors in both a spectral shape and a normalization if the PHA file contains a lot of the slew/post-slew time interval.
- 3) For fits to more complicated models (e.g. a power-law over a cutoff power-law), the BAT team has decided to require a chi-square improvement of more than 6 for each extra dof.
Time averaged spectrum fit using the average DRM
Power-law model
Time interval is from    0.536 sec. to  144.536 sec.

Spectral model in power-law:
------------------------------------------------------------
Parameters  : value       lower 90%   higher 90%
Photon index: -1.88541     ( -0.124825   0.121763 )
Norm@50keV  : 1.34831E-03    ( -0.000103625   0.000102269 )
------------------------------------------------------------
#Fit statistic : Chi-Squared =          57.15 using 59 PHA bins.
# Reduced chi-squared =          1.003 for     57 degrees of freedom
# Null hypothesis probability =   4.694959e-01

Photon flux (15-150 keV)    in 144 sec: 0.192322 ( -0.012118  0.012123 ) ph/cm2/s
Energy fluence (15-150 keV)             : 1.78518e-06 ( -1.34808e-07  1.36991e-07 ) ergs/cm2
Cutoff power-law model
Time interval is from    0.536 sec. to  144.536 sec.
Spectral model in the cutoff power-law:
------------------------------------------------------------
Parameters  : value       lower 90%   higher 90%
Photon index: -1.48031     ( -0.460449   0.53397 )
Epeak [keV] : 54.4372      ( -14.4462 -54.4372 )
Norm@50keV  : 2.28681E-03    ( -0.000984353   0.00226669 )
------------------------------------------------------------
#Fit statistic : Chi-Squared =          55.01 using 59 PHA bins.
# Reduced chi-squared =         0.9823 for     56 degrees of freedom
# Null hypothesis probability =   5.124095e-01

Photon flux (15-150 keV)    in 144 sec: 0.188095 ( -0.01303  0.013032 ) ph/cm2/s
Energy fluence (15-150 keV)             : 1.69665e-06 ( -1.63791e-07  1.6888e-07 ) ergs/cm2
1-s peak spectrum fit
Power-law model
Time interval is from    8.036 sec. to    9.036 sec.

Spectral model in power-law:
------------------------------------------------------------
Parameters  : value       lower 90%   higher 90%
Photon index: -1.72394     ( -0.694882   0.642816 )
Norm@50keV  : 3.29368E-03    ( -0.00138624   0.00129416 )
------------------------------------------------------------
#Fit statistic : Chi-Squared =          55.96 using 59 PHA bins.
# Reduced chi-squared =         0.9818 for     57 degrees of freedom
# Null hypothesis probability =   5.140417e-01

Photon flux (15-150 keV)    in 1 sec: 0.441180 ( -0.146027  0.146033 ) ph/cm2/s
Energy fluence (15-150 keV)             : 3.0446e-08 ( -1.24038e-08  1.36288e-08 ) ergs/cm2
Cutoff power-law model

Time interval is from    8.036 sec. to    9.036 sec.
Spectral model in the cutoff power-law:
------------------------------------------------------------
Parameters  : value       lower 90%   higher 90%
Photon index: -1.73126     ( -0.68925   0.652851 )
Epeak [keV] : 9999.31      ( -9999.35 -9999.36 )
Norm@50keV  : 3.28741E-03    (     )
------------------------------------------------------------
#Fit statistic : Chi-Squared =          55.96 using 59 PHA bins.
# Reduced chi-squared =         0.9994 for     56 degrees of freedom
# Null hypothesis probability =   4.762312e-01

Photon flux (15-150 keV)    in 1 sec: 0.441881 ( -0.147148  0.144909 ) ph/cm2/s
Energy fluence (15-150 keV)             : 3.08916e-08 ( -1.33605e-08  7.89753e-09 ) ergs/cm2
Time-resolved spectra
Distribution
T90 vs. Hardness ratio plot
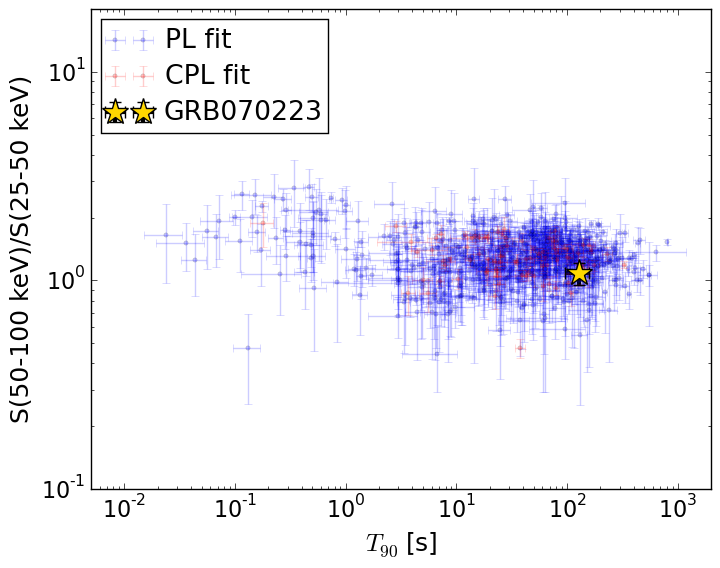
T90                                   = 128.0 sec.
Hardness ratio (energy fluence ratio) = 1.08270457607
S(15-50 keV) vs. S(50-150 keV) plot

S(15-50 keV)  = 8.746547e-07
S(50-150 keV) = 9.10533e-07
The dash-dotted line and the dashed line traces the fluences calculated from the Band function with Epeak = 15 and 150 keV, respectively. Both lines assume a canonical values of alpha = -1 and beta = -2.5.
Mask shadow pattern
IMX = -5.324156209013765E-01, IMY = -6.140106102854202E-02
Spacecraft aspect plot
Bright source in the pre-burst/pre-slew/post-slew images
Pre-burst image of 15-350 keV band
Time interval of the image:
-239.464000 0.536000

# RAcent  DECcent POSerr Theta    Phi  PeakCts   SNR AngSep     Name
#  [deg]    [deg]    ['] [deg]  [deg]                   [']
217.2460  14.4485    2.9  33.7  -23.4   1.0229   3.9 ------	UNKNOWN
Pre-slew background subtracted image of 15-350 keV band
Time interval of the image:
0.536000 39.836590

# RAcent  DECcent POSerr Theta    Phi  PeakCts   SNR AngSep     Name
#  [deg]    [deg]    ['] [deg]  [deg]                   [']
153.4553  43.1319    0.5  28.2  173.4   1.7495  21.8 ------	UNKNOWN
232.5857  10.9807    2.7  48.3  -30.8   0.7674   4.3 ------	UNKNOWN
Post-slew image of 15-350 keV band
Time interval of the image:
98.636590 293.636590

# RAcent  DECcent POSerr Theta    Phi  PeakCts   SNR AngSep     Name
#  [deg]    [deg]    ['] [deg]  [deg]                   [']
146.0362  42.0240    2.0   5.6  175.5   0.8297   5.7 ------	UNKNOWN