Analysis Summary
Notes:
- 1) No attempt has been made to eliminate the non-significant decimal places.
- 2) This batgrbproduct analysis is done using the HEASARC data.
- 3) This batgrbproduct analysis is using the flight position for the mask-weighting calculation.
======================================================================
BAT GRB EVENT DATA PROCESSING REPORT
Process Script Ver: batgrbproduct v2.46
Process Start Time: Mon Jan 20 11:19:39 EST 2014
Host Name: batevent1
Current Working Dir: /local/data/batevent/batevent_reproc/trigger261880
======================================================================
Trigger: 00261880 Segment: 000
BAT Trigger Time: 194041680 [s; MET]
Trigger Stop: 194041744 [s; MET]
UTC: 2007-02-24T20:27:58.214180 [includes UTCF correction]
Where From?: TDRSS position message
BAT
RA: 178.989686201408 Dec: -13.3399298580834 [deg; J2000]
Catalogged Source?: NO
Point Source?: YES
GRB Indicated?: YES [ by BAT flight software ]
Image S/N Ratio: 7.5
Image Trigger?: YES
Rate S/N Ratio: 0 [ if not an image trigger ]
Image S/N Ratio: 7.5
Analysis Position: [ source = BAT ]
RA: 178.989686201408 Dec: -13.3399298580834 [deg; J2000]
Refined Position: [ source = BAT pre-slew burst ]
RA: 178.99720195201 Dec: -13.373545725744 [deg; J2000]
{ 11h 55m 59.3s , -13d 22' 24.8" }
+/- 2.29129570710923 [arcmin] (estimated 90% radius based on SNR)
+/- 0.910543767147948 [arcmin] (formal 1-sigma fit error)
SNR: 9.30500796835042
Angular difference between the analysis and refined position is 2.064121 arcmin
Partial Coding Fraction: 1 [ including projection effects ]
Duration
T90: 48 +/- 35.7770876399966
Measured from: -15
to: 33 [s; relative to TRIGTIME]
T50: 16 +/- 16
Measured from: -15
to: 1 [s; relative to TRIGTIME]
Fluence
Peak Flux (peak 1 second)
Measured from: -7.5
to: -6.5 [s; relative to TRIGTIME]
Total Fluence
Measured from: -15
to: 49 [s; relative to TRIGTIME]
Band 1 Band 2 Band 3 Band 4
15-25 25-50 50-100 100-350 keV
Total 0.361915 0.289511 0.112186 0.027142
0.037197 0.038685 0.033804 0.030114 [error]
Peak 0.009983 0.014453 -0.004225 0.000578
0.004767 0.004912 0.004304 0.003772 [error]
[ fluence units of on-axis counts / fully illuminated detector ]
======================================================================
====== Table of the duration information =============================
Value tstart tstop
T100 64.000 -15.000 49.000
T90 48.000 -15.000 33.000
T50 16.000 -15.000 1.000
Peak 1.000 -7.500 -6.500
====== Spectral Analysis Summary =====================================
Model : spectral model: simple power-law (PL) and cutoff power-law (CPL)
Ph_index : photon index: E^{Ph_index}
Ph_90err : 90% error of the photon index
Epeak : Epeak in keV
Epeak_90err: 90% error of Epeak
Norm : normalization at 50 keV in both the PL model and CPL model
Nomr_90err : 90% error of the normalization
chi2 : Chi-Squared
dof : degree of freedo
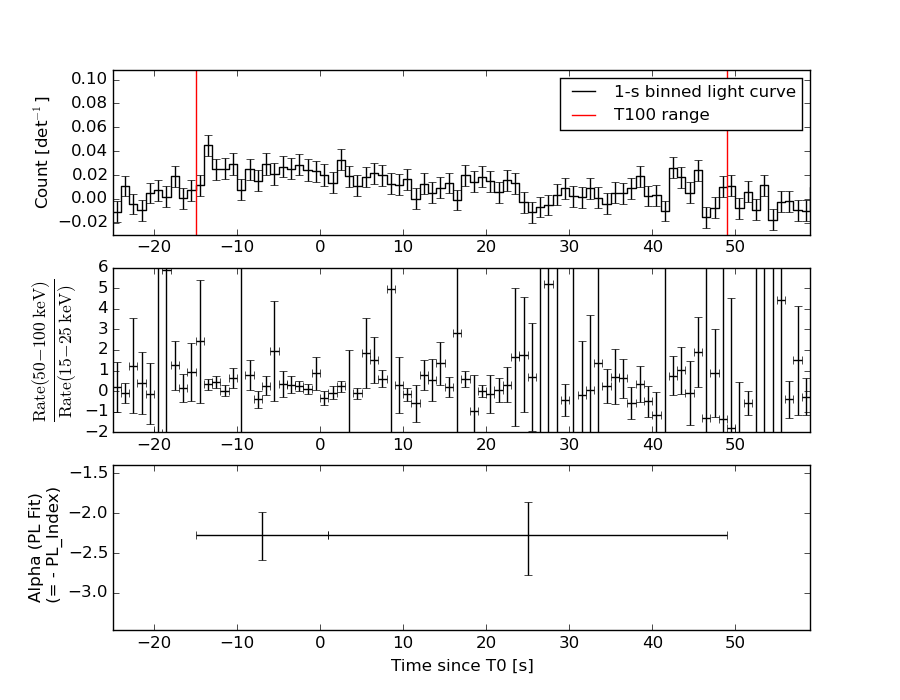
=== Time-averaged spectral analysis ===
(Best model with acceptable fit: PL)
Model Ph_index Ph_90err_low Ph_90err_hi Epeak Epeak_90err_low Epeak_90err_hi Norm Nomr_90err_low Norm_90err_hi chi2 dof
PL -2.289 -0.300 0.270 - - - 6.05e-04 -1.32e-04 1.30e-04 61.380 57
CPL -1.510 -0.827 1.509 22.576 -19.385 14.938 1.89e-03 -1.08e-03 1.57e-02 60.220 56
=== 1-s peak spectral analysis ===
(Best model with acceptable fit: N/A)
Model Ph_index Ph_90err_low Ph_90err_hi Epeak Epeak_90err_low Epeak_90err_hi Norm Nomr_90err_low Norm_90err_hi chi2 dof
PL -2.157 -1.223 0.757 - - - 1.22e-03 -8.85e-04 8.57e-04 51.040 57
CPL 3.008 -3.196 -3.008 32.226 -7.286 8.711 3.04e+00 -3.04e+00 2.16e+05 46.190 56
=== Fluence/Peak Flux Summary ===
Model Band1 Band2 Band3 Band4 Band5 Total
15-25 25-50 50-100 100-350 15-150 15-350 keV
Fluence PL 1.04e-07 1.19e-07 9.75e-08 1.34e-07 3.70e-07 4.55e-07 erg/cm2
90%_error_low -1.72e-08 -1.81e-08 -2.76e-08 -6.04e-08 -6.45e-08 -1.02e-07 erg/cm2
90%_error_hi 1.74e-08 1.77e-08 2.99e-08 8.81e-08 6.76e-08 1.24e-07 erg/cm2
Peak flux PL 9.72e-02 6.37e-02 2.71e-02 1.59e-02 1.96e-01 2.04e-01 ph/cm2/s
90%_error_low -5.77e-02 -3.72e-02 -2.71e-02 -1.59e-02 -1.07e-01 -1.13e-01 ph/cm2/s
90%_error_hi 6.14e-02 3.69e-02 2.90e-02 4.31e-02 1.08e-01 1.17e-01 ph/cm2/s
Fluence CPL 1.02e-07 1.30e-07 N/A 1.11e-07 3.38e-07 3.81e-07 erg/cm2
90%_error_low -1.87e-08 N/A -2.76e-08 -9.20e-08 -6.58e-08 -1.08e-07 erg/cm2
90%_error_hi 1.83e-08 N/A 2.99e-08 4.35e-07 8.11e-08 1.89e-07 erg/cm2
Peak flux CPL 7.66e-02 1.24e-01 7.39e-03 4.66e-07 2.08e-01 2.09e-01 ph/cm2/s
90%_error_low -5.41e-02 -6.00e-02 -7.39e-03 -4.66e-07 -9.39e-02 -9.47e-02 ph/cm2/s
90%_error_hi 7.20e-02 6.08e-02 2.77e-02 1.60e-03 9.82e-02 9.73e-02 ph/cm2/s
======================================================================
Image
Pre-slew 15.0-350.0 keV image (Event data)
#   RAcent    DECcent   POSerr    Theta     Phi              Peak Cts       SNR   Name
  178.9972   -13.3735   0.0206    12.2877    -0.4991         0.7773800      9.305 TRIG_00261880

Foreground time interval of the image:
-15.000  49.000 (delta_t =  64.000 [sec])
Background time interval of the image:
-239.000 -15.000 (delta_t = 224.000 [sec])
Light Curves
Note: The mask-weighted lightcurves have units of either count/det or counts/sec/det, where a det is 0.4 x 0.4 = 0.16 sq cm.
Full-time range; 1 s binning
Other quick-look light curves:
- 64 ms binning (zoomed)
- 16 ms binning (zoomed)
- 8 ms binning (zoomed)
- 2 ms binning (zoomed)
- SN=5 or 10 s binning (full-time range)
- Raw light curve
Spectra
- 64 ms binning (zoomed)
- 16 ms binning (zoomed)
- 8 ms binning (zoomed)
- 2 ms binning (zoomed)
- SN=5 or 10 s binning (full-time range)
- Raw light curve
Spectra
Notes:
- 1) The fitting includes the systematic errors.
- 2) When the burst includes telescope slew time periods, the fitting uses an average response file made from multiple 5-s response files through out the slew time plus single time preiod for the non-slew times, and weighted by the total counts in the corresponding time period using addrmf. An average response file is needed becuase a spectral fit using the pre-slew DRM will introduce some errors in both a spectral shape and a normalization if the PHA file contains a lot of the slew/post-slew time interval.
- 3) For fits to more complicated models (e.g. a power-law over a cutoff power-law), the BAT team has decided to require a chi-square improvement of more than 6 for each extra dof.
Time averaged spectrum fit using the average DRM
Power-law model
Time interval is from  -15.000 sec. to   49.000 sec.

Spectral model in power-law:
------------------------------------------------------------
Parameters  : value       lower 90%   higher 90%
Photon index: -2.28896     ( -0.300418   0.270033 )
Norm@50keV  : 6.05476E-04    ( -0.000131605   0.000129548 )
------------------------------------------------------------
#Fit statistic : Chi-Squared =          61.38 using 59 PHA bins.
# Reduced chi-squared =          1.077 for     57 degrees of freedom
# Null hypothesis probability =   3.219588e-01

Photon flux (15-150 keV)    in 64 sec: 0.105178 ( -0.0140851  0.014092 ) ph/cm2/s
Energy fluence (15-150 keV)             : 3.69641e-07 ( -6.44864e-08  6.76493e-08 ) ergs/cm2
Cutoff power-law model
Time interval is from  -15.000 sec. to   49.000 sec.
Spectral model in the cutoff power-law:
------------------------------------------------------------
Parameters  : value       lower 90%   higher 90%
Photon index: -1.50955     ( -0.826979   1.50891 )
Epeak [keV] : 22.5761      ( -19.3854 14.9369 )
Norm@50keV  : 1.89164E-03    ( -0.00108141   0.0157306 )
------------------------------------------------------------
#Fit statistic : Chi-Squared =          60.22 using 59 PHA bins.
# Reduced chi-squared =          1.075 for     56 degrees of freedom
# Null hypothesis probability =   3.255668e-01

Photon flux (15-150 keV)    in 64 sec: 0.105400 ( -0.0141073  0.013968 ) ph/cm2/s
Energy fluence (15-150 keV)             : 3.38057e-07 ( -6.57619e-08  8.1113e-08 ) ergs/cm2
1-s peak spectrum fit
Power-law model
Time interval is from   -7.500 sec. to   -6.500 sec.

Spectral model in power-law:
------------------------------------------------------------
Parameters  : value       lower 90%   higher 90%
Photon index: -2.15739     ( -1.08746   0.89301 )
Norm@50keV  : 1.21692E-03    ( -0.000872113   0.000869417 )
------------------------------------------------------------
#Fit statistic : Chi-Squared =          51.04 using 59 PHA bins.
# Reduced chi-squared =         0.8954 for     57 degrees of freedom
# Null hypothesis probability =   6.972080e-01

Photon flux (15-150 keV)    in 1 sec: 0.195904 ( -0.107346  0.108216 ) ph/cm2/s
Energy fluence (15-150 keV)             : 1.10438e-08 ( -6.75101e-09  8.03276e-09 ) ergs/cm2
Cutoff power-law model
Time interval is from   -7.500 sec. to   -6.500 sec.
Spectral model in the cutoff power-law:
------------------------------------------------------------
Parameters  : value       lower 90%   higher 90%
Photon index: 6.44076     ( -6.67693   -6.48918 )
Epeak [keV] : 32.0866      ( -7.14227 8.85436 )
Norm@50keV  : 569.343    ( -661.529   215516 )
------------------------------------------------------------
#Fit statistic : Chi-Squared =          45.50 using 59 PHA bins.
# Reduced chi-squared =         0.8126 for     56 degrees of freedom
# Null hypothesis probability =   8.407542e-01

Photon flux (15-150 keV)    in 1 sec: 0.207664 ( -0.09389  0.098156 ) ph/cm2/s
Energy fluence (15-150 keV)             : 9.86938e-09 ( -4.50326e-09  4.92681e-09 ) ergs/cm2
Time-resolved spectra
Distribution
T90 vs. Hardness ratio plot
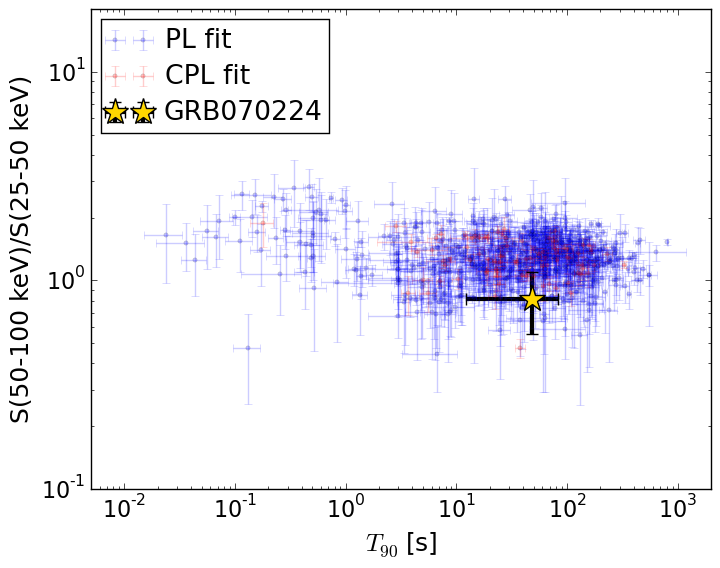
T90                                   = 48.0 sec.
Hardness ratio (energy fluence ratio) = 0.818540397333
S(15-50 keV) vs. S(50-150 keV) plot
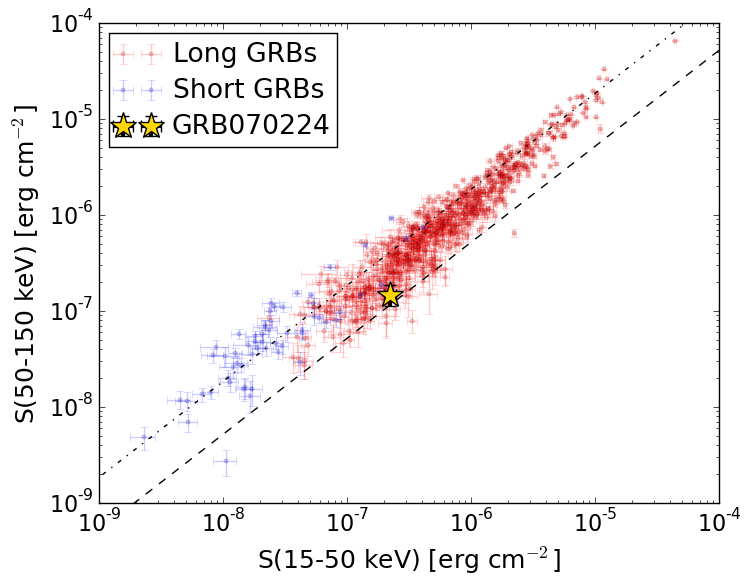
S(15-50 keV)  = 2.235241e-07
S(50-150 keV) = 1.4612069e-07
The dash-dotted line and the dashed line traces the fluences calculated from the Band function with Epeak = 15 and 150 keV, respectively. Both lines assume a canonical values of alpha = -1 and beta = -2.5.
Mask shadow pattern
IMX = 2.178018704812982E-01, IMY = 1.897387479609091E-03
Spacecraft aspect plot
Bright source in the pre-burst/pre-slew/post-slew images
Pre-burst image of 15-350 keV band
Time interval of the image:
-239.000000 -15.000000

# RAcent  DECcent POSerr Theta    Phi  PeakCts   SNR AngSep     Name
#  [deg]    [deg]    ['] [deg]  [deg]                   [']
179.6562  43.9069    2.9  45.0  173.7   1.1662   3.9 ------	UNKNOWN
197.6841  42.0144    2.2  46.0 -167.6   1.4909   5.2 ------	UNKNOWN
194.4151  14.4744    2.1  21.1 -144.1   0.9032   5.5 ------	UNKNOWN
Pre-slew background subtracted image of 15-350 keV band
Time interval of the image:
-15.000000 49.000000

# RAcent  DECcent POSerr Theta    Phi  PeakCts   SNR AngSep     Name
#  [deg]    [deg]    ['] [deg]  [deg]                   [']
154.5690  42.7021    1.9  49.5  149.6   1.9876   6.0 ------	UNKNOWN
176.8772 -11.6020    2.5  11.0   11.3   0.3707   4.7 ------	UNKNOWN
178.9972 -13.3736    1.2  12.3   -0.5   0.7776   9.4 ------	UNKNOWN
Post-slew image of 15-350 keV band
Time interval of the image:
129.100590 963.100000

# RAcent  DECcent POSerr Theta    Phi  PeakCts   SNR AngSep     Name
#  [deg]    [deg]    ['] [deg]  [deg]                   [']
135.6042 -40.5968    5.1  46.6   -0.0   1.8253   2.2    4.3	Vela X-1
170.2892 -60.6424    5.7  47.7  -40.2   2.7231   2.0    1.4	Cen X-3
159.7756   0.1318    2.7  23.3   78.0   2.0529   4.3 ------	UNKNOWN
174.5395  -1.3048    2.9  12.8  113.9   1.4027   4.0 ------	UNKNOWN
145.3789 -33.3172    3.0  36.5    5.2   1.9049   3.8 ------	UNKNOWN
189.5516   1.6451    3.0  18.3  170.0   1.3517   3.8 ------	UNKNOWN
143.4278 -50.4883    2.4  47.0  -15.5   3.4858   4.7 ------	UNKNOWN
231.4595  15.4639    3.7  59.4 -163.2  11.2082   3.2 ------	UNKNOWN