Analysis Summary
Notes:
- 1) No attempt has been made to eliminate the non-significant decimal places.
- 2) This batgrbproduct analysis is done using the HEASARC data.
- 3) This batgrbproduct analysis is using the flight position for the mask-weighting calculation.
======================================================================
BAT GRB EVENT DATA PROCESSING REPORT
Process Script Ver: batgrbproduct v2.46
Process Start Time: Mon Jan 20 11:09:18 EST 2014
Host Name: batevent1
Current Working Dir: /local/data/batevent/batevent_reproc/trigger271019
======================================================================
Trigger: 00271019 Segment: 000
BAT Trigger Time: 195895737.92 [s; MET]
Trigger Stop: 195895738.432 [s; MET]
UTC: 2007-03-18T07:28:56.088640 [includes UTCF correction]
Where From?: TDRSS position message
BAT
RA: 48.5402261665742 Dec: -42.961988565526 [deg; J2000]
Catalogged Source?: NO
Point Source?: YES
GRB Indicated?: YES [ by BAT flight software ]
Image S/N Ratio: 10.03
Image Trigger?: NO
Rate S/N Ratio: 17.9443584449264 [ if not an image trigger ]
Image S/N Ratio: 10.03
Analysis Position: [ source = BAT ]
RA: 48.5402261665742 Dec: -42.961988565526 [deg; J2000]
Refined Position: [ source = BAT pre-slew burst ]
RA: 48.4858797791712 Dec: -42.942277109951 [deg; J2000]
{ 03h 13m 56.6s , -42d 56' 32.2" }
+/- 0.76802989802986 [arcmin] (estimated 90% radius based on SNR)
+/- 0.229677613305789 [arcmin] (formal 1-sigma fit error)
SNR: 44.3469660422778
Angular difference between the analysis and refined position is 2.663609 arcmin
Partial Coding Fraction: 0.8046875 [ including projection effects ]
Duration
T90: 130.368000030518 +/- 28.8086031720255
Measured from: 0.719999998807907
to: 131.088000029325 [s; relative to TRIGTIME]
T50: 35.0720000267029 +/- 4.93464486631663
Measured from: 5.32800000905991
to: 40.4000000357628 [s; relative to TRIGTIME]
Fluence
Peak Flux (peak 1 second)
Measured from: 1.21200001239777
to: 2.21200001239777 [s; relative to TRIGTIME]
Total Fluence
Measured from: -1.00799998641014
to: 171.536000013351 [s; relative to TRIGTIME]
Band 1 Band 2 Band 3 Band 4
15-25 25-50 50-100 100-350 keV
Total 1.015939 1.533896 1.198511 0.375500
0.060796 0.063851 0.057449 0.052009 [error]
Peak 0.045642 0.073220 0.064797 0.018952
0.005715 0.006430 0.005927 0.004918 [error]
[ fluence units of on-axis counts / fully illuminated detector ]
======================================================================
====== Table of the duration information =============================
Value tstart tstop
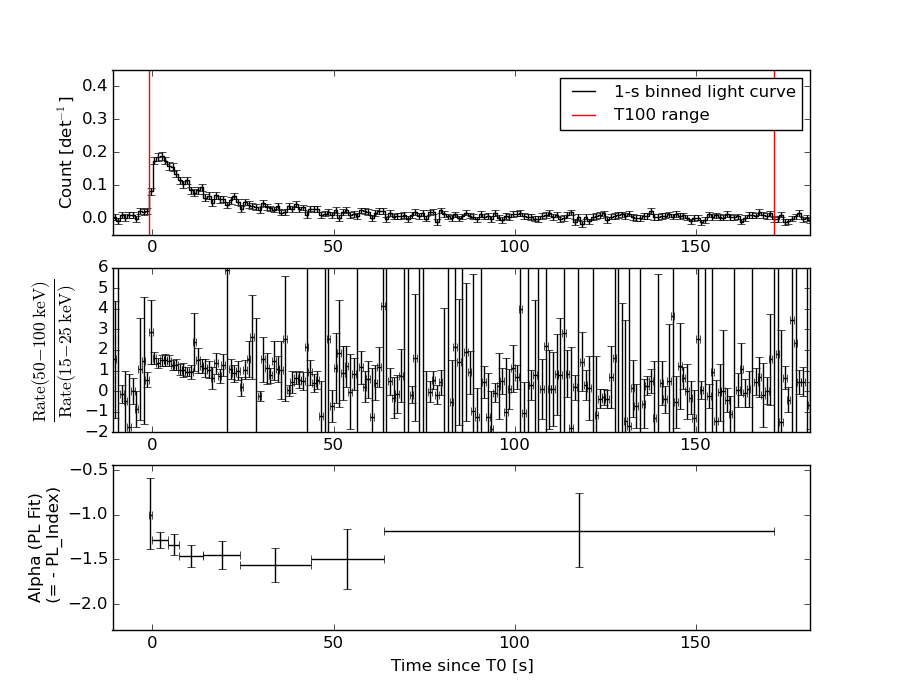
T100 172.544 -1.008 171.536
T90 130.368 0.720 131.088
T50 35.072 5.328 40.400
Peak 1.000 1.212 2.212
====== Spectral Analysis Summary =====================================
Model : spectral model: simple power-law (PL) and cutoff power-law (CPL)
Ph_index : photon index: E^{Ph_index}
Ph_90err : 90% error of the photon index
Epeak : Epeak in keV
Epeak_90err: 90% error of Epeak
Norm : normalization at 50 keV in both the PL model and CPL model
Nomr_90err : 90% error of the normalization
chi2 : Chi-Squared
dof : degree of freedo
=== Time-averaged spectral analysis ===
(Best model with acceptable fit: PL)
Model Ph_index Ph_90err_low Ph_90err_hi Epeak Epeak_90err_low Epeak_90err_hi Norm Nomr_90err_low Norm_90err_hi chi2 dof
PL -1.376 -0.088 0.088 - - - 1.56e-03 -7.45e-05 7.44e-05 43.940 57
CPL -1.257 -0.163 0.336 330.081 -330.081 -330.081 1.78e-03 -2.82e-04 7.77e-04 43.540 56
=== 1-s peak spectral analysis ===
(Best model with acceptable fit: PL)
Model Ph_index Ph_90err_low Ph_90err_hi Epeak Epeak_90err_low Epeak_90err_hi Norm Nomr_90err_low Norm_90err_hi chi2 dof
PL -1.325 -0.158 0.158 - - - 1.34e-02 -1.26e-03 1.26e-03 64.720 57
CPL -0.806 -0.576 0.682 118.368 -41.493 -118.368 2.42e-02 -1.13e-02 2.71e-02 62.490 56
=== Fluence/Peak Flux Summary ===
Model Band1 Band2 Band3 Band4 Band5 Total
15-25 25-50 50-100 100-350 15-150 15-350 keV
Fluence PL 3.07e-07 6.08e-07 9.37e-07 3.17e-06 2.62e-06 5.02e-06 erg/cm2
90%_error_low -2.72e-08 -3.19e-08 -5.73e-08 -4.15e-07 -1.39e-07 -4.55e-07 erg/cm2
90%_error_hi 2.80e-08 3.17e-08 5.71e-08 4.58e-07 1.40e-07 4.91e-07 erg/cm2
Peak flux PL 4.66e-01 5.21e-01 4.16e-01 5.50e-01 1.61e+00 1.95e+00 ph/cm2/s
90%_error_low -7.37e-02 -5.26e-02 -4.84e-02 -1.21e-01 -1.50e-01 -1.91e-01 ph/cm2/s
90%_error_hi 7.71e-02 5.22e-02 4.80e-02 1.40e-01 1.50e-01 1.94e-01 ph/cm2/s
Fluence CPL 2.99e-07 6.14e-07 9.45e-07 2.64e-06 2.60e-06 4.50e-06 erg/cm2
90%_error_low -3.31e-08 -3.53e-08 -6.09e-08 -9.89e-07 -1.55e-07 -9.94e-07 erg/cm2
90%_error_hi 2.80e-08 3.59e-08 6.19e-08 1.07e-06 1.54e-07 6.71e-07 erg/cm2
Peak flux CPL 4.23e-01 5.46e-01 4.36e-01 3.15e-01 1.57e+00 1.72e+00 ph/cm2/s
90%_error_low -8.87e-02 -6.07e-02 -5.48e-02 -1.44e-01 -7.77e-02 -2.18e-01 ph/cm2/s
90%_error_hi 9.10e-02 6.25e-02 5.62e-02 2.81e-01 1.54e-01 3.11e-01 ph/cm2/s
======================================================================
Image
Pre-slew 15.0-350.0 keV image (Event data)
#   RAcent    DECcent   POSerr    Theta     Phi              Peak Cts       SNR   Name
   48.4859   -42.9423   0.0043    21.5540   -57.2923         1.8327941     44.347 TRIG_00271019

Foreground time interval of the image:
 -1.008   9.981 (delta_t =  10.989 [sec])
Background time interval of the image:
-113.419  -1.008 (delta_t = 112.411 [sec])
Light Curves
Note: The mask-weighted lightcurves have units of either count/det or counts/sec/det, where a det is 0.4 x 0.4 = 0.16 sq cm.
Full-time range; 1 s binning
Other quick-look light curves:
- 64 ms binning (zoomed)
- 16 ms binning (zoomed)
- 8 ms binning (zoomed)
- 2 ms binning (zoomed)
- SN=5 or 10 s binning (full-time range)
- Raw light curve
Spectra
- 64 ms binning (zoomed)
- 16 ms binning (zoomed)
- 8 ms binning (zoomed)
- 2 ms binning (zoomed)
- SN=5 or 10 s binning (full-time range)
- Raw light curve
Spectra
Notes:
- 1) The fitting includes the systematic errors.
- 2) When the burst includes telescope slew time periods, the fitting uses an average response file made from multiple 5-s response files through out the slew time plus single time preiod for the non-slew times, and weighted by the total counts in the corresponding time period using addrmf. An average response file is needed becuase a spectral fit using the pre-slew DRM will introduce some errors in both a spectral shape and a normalization if the PHA file contains a lot of the slew/post-slew time interval.
- 3) For fits to more complicated models (e.g. a power-law over a cutoff power-law), the BAT team has decided to require a chi-square improvement of more than 6 for each extra dof.
Time averaged spectrum fit using the average DRM
Power-law model
Time interval is from   -1.008 sec. to  171.536 sec.

Spectral model in power-law:
------------------------------------------------------------
Parameters  : value       lower 90%   higher 90%
Photon index: -1.37558     ( -0.088271   0.0883 )
Norm@50keV  : 1.56413E-03    ( -7.44954e-05   7.43979e-05 )
------------------------------------------------------------
#Fit statistic : Chi-Squared =          43.94 using 59 PHA bins.
# Reduced chi-squared =         0.7709 for     57 degrees of freedom
# Null hypothesis probability =   8.975208e-01

Photon flux (15-150 keV)    in 172.5 sec: 0.189456 ( -0.009282  0.009303 ) ph/cm2/s
Energy fluence (15-150 keV)             : 2.62078e-06 ( -1.39305e-07  1.40115e-07 ) ergs/cm2
Cutoff power-law model

Time interval is from   -1.008 sec. to  171.536 sec.
Spectral model in the cutoff power-law:
------------------------------------------------------------
Parameters  : value       lower 90%   higher 90%
Photon index: -1.25748     ( -0.162714   0.336405 )
Epeak [keV] : 330.081      ( -330.082 -330.082 )
Norm@50keV  : 1.78299E-03    ( -0.000281593   0.00077667 )
------------------------------------------------------------
#Fit statistic : Chi-Squared =          43.54 using 59 PHA bins.
# Reduced chi-squared =         0.7775 for     56 degrees of freedom
# Null hypothesis probability =   8.875840e-01

Photon flux (15-150 keV)    in 172.5 sec: 0.188131 ( -0.009912  0.009909 ) ph/cm2/s
Energy fluence (15-150 keV)             : 2.59597e-06 ( -1.54738e-07  1.53944e-07 ) ergs/cm2
1-s peak spectrum fit
Power-law model

Time interval is from    1.212 sec. to    2.212 sec.

Spectral model in power-law:
------------------------------------------------------------
Parameters  : value       lower 90%   higher 90%
Photon index: -1.32538     ( -0.158419   0.157659 )
Norm@50keV  : 1.33950E-02    ( -0.00126467   0.00126086 )
------------------------------------------------------------
#Fit statistic : Chi-Squared =          64.72 using 59 PHA bins.
# Reduced chi-squared =          1.135 for     57 degrees of freedom
# Null hypothesis probability =   2.252440e-01

Photon flux (15-150 keV)    in 1 sec: 1.60579 ( -0.15022  0.15031 ) ph/cm2/s
Energy fluence (15-150 keV)             : 1.31583e-07 ( -1.405e-08  1.41843e-08 ) ergs/cm2
Cutoff power-law model

Time interval is from    1.212 sec. to    2.212 sec.
Spectral model in the cutoff power-law:
------------------------------------------------------------
Parameters  : value       lower 90%   higher 90%
Photon index: -0.806379     ( -0.575782   0.682046 )
Epeak [keV] : 118.368      ( -41.4931 -118.368 )
Norm@50keV  : 2.42270E-02    ( -0.011324   0.0271302 )
------------------------------------------------------------
#Fit statistic : Chi-Squared =          62.49 using 59 PHA bins.
# Reduced chi-squared =          1.116 for     56 degrees of freedom
# Null hypothesis probability =   2.566618e-01

Photon flux (15-150 keV)    in 1 sec: 1.57472 ( -0.07767  0.15448 ) ph/cm2/s
Energy fluence (15-150 keV)             : 1.27022e-07 ( -1.50834e-08  1.51585e-08 ) ergs/cm2
Time-resolved spectra
Distribution
T90 vs. Hardness ratio plot

T90                                   = 130.368 sec.
Hardness ratio (energy fluence ratio) = 1.54162957403
S(15-50 keV) vs. S(50-150 keV) plot
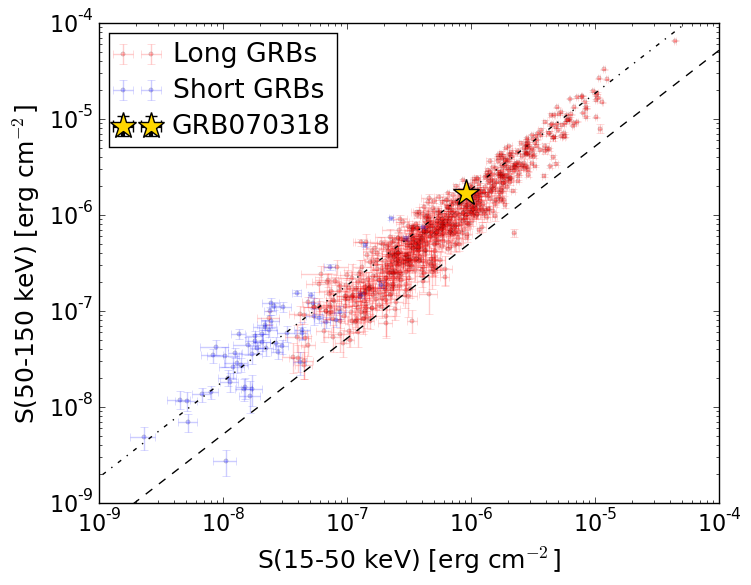
S(15-50 keV)  = 9.146828e-07
S(50-150 keV) = 1.706109e-06
The dash-dotted line and the dashed line traces the fluences calculated from the Band function with Epeak = 15 and 150 keV, respectively. Both lines assume a canonical values of alpha = -1 and beta = -2.5.
Mask shadow pattern
IMX = 2.134392873802190E-01, IMY = 3.323675962069452E-01
Spacecraft aspect plot
Bright source in the pre-burst/pre-slew/post-slew images
Pre-burst image of 15-350 keV band
Time interval of the image:
-113.419380 -1.008000

# RAcent  DECcent POSerr Theta    Phi  PeakCts   SNR AngSep     Name
#  [deg]    [deg]    ['] [deg]  [deg]                   [']
170.3156 -60.7611    8.7  44.6  130.4   0.6340   1.3    8.3	Cen X-3
186.2891 -62.7078    5.6  48.3  139.9   1.0123   2.0   10.8	GX 301-2
 75.1735 -39.8467    2.3  19.5    2.3   0.5000   4.9 ------	UNKNOWN
 66.2951  -5.3186    2.3  54.1  -12.6   1.4965   5.1 ------	UNKNOWN
285.8080 -58.6388    2.7  59.1 -166.2   2.9200   4.3 ------	UNKNOWN
320.8343 -53.8954    5.2  54.0 -143.2   1.3839   2.2 ------	UNKNOWN
 41.9337 -13.4994    3.1  50.7  -44.5   2.0728   3.7 ------	UNKNOWN
Pre-slew background subtracted image of 15-350 keV band
Time interval of the image:
-1.008000 9.980600

# RAcent  DECcent POSerr Theta    Phi  PeakCts   SNR AngSep     Name
#  [deg]    [deg]    ['] [deg]  [deg]                   [']
170.3036 -60.6292   53.7  44.7  130.2  -0.0350  -0.2    0.5	Cen X-3
186.6820 -62.8931   10.5  48.3  140.2  -0.1811  -1.1    7.4	GX 301-2
113.7662 -63.5245    2.3  20.3  113.9   0.2189   5.1 ------	UNKNOWN
238.0174 -66.2490    2.6  54.1  167.1   0.7638   4.5 ------	UNKNOWN
 79.4073 -25.3595    2.3  34.3    6.6   0.2355   5.0 ------	UNKNOWN
 48.4859 -42.9423    0.3  21.6  -57.3   1.8327  44.4 ------	UNKNOWN
297.6359 -55.8728    1.9  59.2 -158.1   1.4249   6.1 ------	UNKNOWN
Post-slew image of 15-350 keV band
Time interval of the image:
52.780600 962.163000

# RAcent  DECcent POSerr Theta    Phi  PeakCts   SNR AngSep     Name
#  [deg]    [deg]    ['] [deg]  [deg]                   [']
312.7394 -54.8767    3.8  59.0 -166.2   9.6607   3.1 ------	UNKNOWN
 44.1302   2.4307    3.0  45.6  -34.3   3.0425   3.8 ------	UNKNOWN
 44.4027  11.4008    5.1  54.5  -33.1   5.4171   2.3 ------	UNKNOWN
 35.8270   6.3838    3.1  50.7  -44.5   9.5670   3.7 ------	UNKNOWN