Analysis Summary
Notes:
- 1) No attempt has been made to eliminate the non-significant decimal places.
- 2) This batgrbproduct analysis is done using the HEASARC data.
- 3) This batgrbproduct analysis is using the flight position for the mask-weighting calculation.
==========================================================================
BAT GROUND-DETECTED GRB DATA PROCESSING REPORT
(This burst occurred during telescope slew)
Process Script Ver: batgrbproduct v2.46
Process Start Time: Mon Mar 23 22:22:32 EDT 2015
Host Name: bat1
Current Working Dir: /local/data/bat1/alien/Swift_3rdBATcatalog/event/batevent_reproc/GRB070326
======================================================================
Trigger: 00271019 Segment: 007
BAT Trigger Time: 196619290.0
UTC: 2007-03-26T16:28:08.151 [includes UTCF correction]
Where From?: Ground analysis (best_duration.txt)
NOTE: BAT trigger time for ground-detected burst during slew is the T100 start time.
Refined Position: [ source = BAT mosaic image ]
RA: 40.3137703019763 Dec: -66.8938287826534 [deg; J2000]
{ 02h 41m 15.3s , -66d -53' -37.8" }
+/- 1.6338296354 [arcmin] (estimated 90% radius based on SNR)
SNR: 15.0866945886
Angular difference between the analysis and refined position is Usage: arcmin
Partial Coding Fraction: Unavailable because the burst occurred during slew.
Duration
T90: 18. +/- 5.3851648071345
Measured from: 1
to: 19 [s; relative to TRIGTIME]
T50: 8. +/- 3.
Measured from: 2
to: 10 [s; relative to TRIGTIME]
====== Table of the duration information =============================
Value tstart tstop
T100 22.000 0.000 22.000
T90 18.000 1.000 19.000
T50 8.000 2.000 10.000
Peak 1.000 1.000 2.000
====== Spectral Analysis Summary =====================================
Model : spectral model: simple power-law (PL) and cutoff power-law (CPL)
Ph_index : photon index: E^{Ph_index}
Ph_90err : 90% error of the photon index
Epeak : Epeak in keV
Epeak_90err: 90% error of Epeak
Norm : normalization at 50 keV in both the PL model and CPL model
Nomr_90err : 90% error of the normalization
chi2 : Chi-Squared
dof : degree of freedo
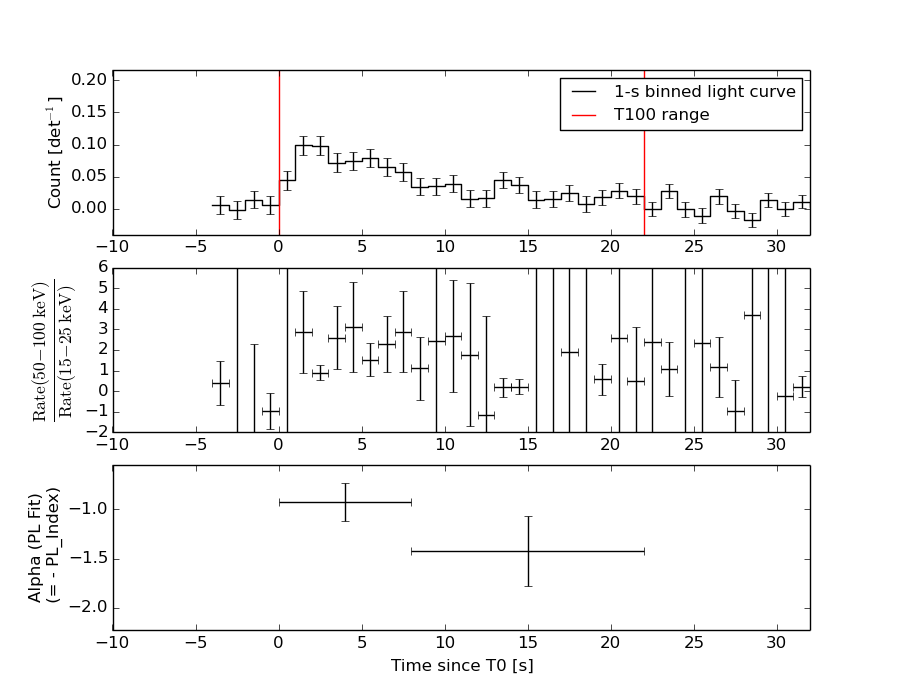
=== Time-averaged spectral analysis ===
(Best model with acceptable fit: PL)
Model Ph_index Ph_90err_low Ph_90err_hi Epeak Epeak_90err_low Epeak_90err_hi Norm Nomr_90err_low Norm_90err_hi chi2 dof
PL -1.096 -0.185 0.189 - - - 2.99e-03 -3.00e-04 3.00e-04 65.140 57
CPL -1.044 -0.240 0.451 997.426 -997.426 -997.426 3.17e-03 -4.58e-04 1.42e-04 65.340 56
=== 1-s peak spectral analysis ===
(Best model with acceptable fit: PL)
Model Ph_index Ph_90err_low Ph_90err_hi Epeak Epeak_90err_low Epeak_90err_hi Norm Nomr_90err_low Norm_90err_hi chi2 dof
PL -0.972 -0.401 0.438 - - - 6.30e-03 -1.54e-03 1.53e-03 62.070 57
CPL -0.124 -1.190 2.602 117.180 -117.180 -117.180 1.61e-02 -1.61e-02 2.59e-01 61.370 56
=== Fluence/Peak Flux Summary ===
Model Band1 Band2 Band3 Band4 Band5 Total
15-25 25-50 50-100 100-350 15-150 15-350 keV
Fluence PL 5.77e-08 1.36e-07 2.54e-07 1.15e-06 6.90e-07 1.60e-06 erg/cm2
90%_error_low -1.15e-08 -1.64e-08 -3.02e-08 -2.88e-07 -7.72e-08 -3.08e-07 erg/cm2
90%_error_hi 1.23e-08 1.61e-08 2.99e-08 3.55e-07 7.79e-08 3.66e-07 erg/cm2
Peak flux PL 1.57e-01 2.16e-01 2.20e-01 4.09e-01 7.24e-01 1.00e+00 ph/cm2/s
90%_error_low -7.02e-02 -6.64e-02 -5.76e-02 -1.87e-01 -1.78e-01 -2.58e-01 ph/cm2/s
90%_error_hi 8.25e-02 6.45e-02 5.68e-02 2.77e-01 1.79e-01 2.81e-01 ph/cm2/s
Fluence CPL 5.84e-08 1.35e-07 2.51e-07 1.22e-06 6.97e-07 1.61e-06 erg/cm2
90%_error_low N/A -1.81e-08 N/A -6.53e-07 -8.54e-08 -6.12e-07 erg/cm2
90%_error_hi N/A 1.93e-08 N/A 8.51e-08 6.92e-08 1.45e-07 erg/cm2
Peak flux CPL 1.31e-01 2.32e-01 2.39e-01 1.74e-01 7.02e-01 7.75e-01 ph/cm2/s
90%_error_low -7.96e-02 -7.54e-02 -6.73e-02 -1.74e-01 -1.85e-01 -2.46e-01 ph/cm2/s
90%_error_hi 9.57e-02 8.19e-02 7.12e-02 2.62e-01 1.85e-01 3.75e-01 ph/cm2/s
======================================================================
Image
Note1: The mosaic image is made with timebin = 0.05 s; energybin = 15-150 keV
Note2: The mosaic image uses Galactic coordinate.
#RAcent DECcent POSerr Theta  Phi  Peak_Cts  SNR Name
40.314 -66.894 0.004 36.344 -162.403 0.044 15.087 UNKNOWN

Image time interval: 0.000 to 22.000 [sec]
Light Curves
Note: The mask-weighted lightcurves have units of either count/det or counts/sec/det, where a det is 0.4 x 0.4 = 0.16 sq cm.
Best duration plot
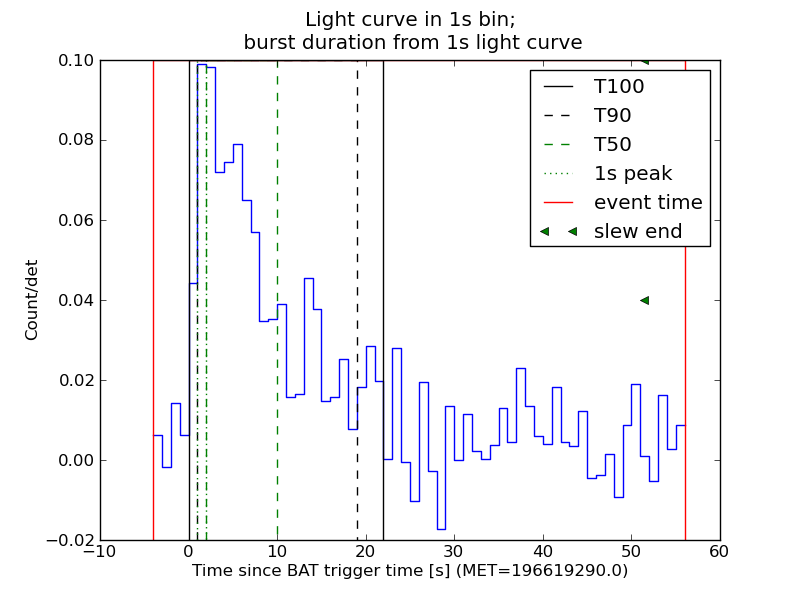
Full-time range; 1 s binning
Other quick-look light curves:
- 64 ms binning (zoomed)
- 16 ms binning (zoomed)
- 8 ms binning (zoomed)
- 2 ms binning (zoomed)
- SN=5 or 10 s binning (full-time range)
- Raw light curve
Spectra
- 64 ms binning (zoomed)
- 16 ms binning (zoomed)
- 8 ms binning (zoomed)
- 2 ms binning (zoomed)
- SN=5 or 10 s binning (full-time range)
- Raw light curve
Spectra
Notes:
- 1) The fitting includes the systematic errors.
- 2) When the burst includes telescope slew time periods, the fitting uses an average response file made from multiple 5-s response files through out the slew time plus single time preiod for the non-slew times, and weighted by the total counts in the corresponding time period using addrmf. An average response file is needed becuase a spectral fit using the pre-slew DRM will introduce some errors in both a spectral shape and a normalization if the PHA file contains a lot of the slew/post-slew time interval.
- 3) For fits to more complicated models (e.g. a power-law over a cutoff power-law), the BAT team has decided to require a chi-square improvement of more than 6 for each extra dof.
Time averaged spectrum fit using the average DRM
Power-law model
Time interval is from    0.000 sec. to   22.000 sec.

Spectral model in power-law:
------------------------------------------------------------
Parameters  : value       lower 90%   higher 90%
Photon index: -1.09617     ( -0.18478   0.189484 )
Norm@50keV  : 2.99444E-03    ( -0.000300007   0.00029954 )
------------------------------------------------------------
#Fit statistic : Chi-Squared =          65.14 using 59 PHA bins.
# Reduced chi-squared =          1.143 for     57 degrees of freedom
# Null hypothesis probability =   2.145370e-01

Photon flux (15-150 keV)    in 22 sec: 0.347207 ( -0.035713  0.03581 ) ph/cm2/s
Energy fluence (15-150 keV)             : 6.89689e-07 ( -7.71938e-08  7.7854e-08 ) ergs/cm2
Cutoff power-law model

Time interval is from    0.000 sec. to   22.000 sec.
Spectral model in the cutoff power-law:
------------------------------------------------------------
Parameters  : value       lower 90%   higher 90%
Photon index: -1.09141     ( -0.239491   0.450953 )
Epeak [keV] : 1.00000E+04      ( -10000 -10000 )
Norm@50keV  : 3.01046E-03    ( -0.000300195   0.000300344 )
------------------------------------------------------------
#Fit statistic : Chi-Squared =          65.16 using 59 PHA bins.
# Reduced chi-squared =          1.164 for     56 degrees of freedom
# Null hypothesis probability =   1.881960e-01

Photon flux (15-150 keV)    in 22 sec: 0.350069 ( -0.038651  0.032837 ) ph/cm2/s
Energy fluence (15-150 keV)             : 6.97145e-07 ( -8.53684e-08  6.91797e-08 ) ergs/cm2
1-s peak spectrum fit
Power-law model
Time interval is from    1.000 sec. to    2.000 sec.

Spectral model in power-law:
------------------------------------------------------------
Parameters  : value       lower 90%   higher 90%
Photon index: -0.972026     ( -0.401345   0.438499 )
Norm@50keV  : 6.29759E-03    ( -0.00154307   0.00153176 )
------------------------------------------------------------
#Fit statistic : Chi-Squared =          62.07 using 59 PHA bins.
# Reduced chi-squared =          1.089 for     57 degrees of freedom
# Null hypothesis probability =   3.004333e-01

Photon flux (15-150 keV)    in 1 sec: 0.724094 ( -0.17849  0.179475 ) ph/cm2/s
Energy fluence (15-150 keV)             : 6.87939e-08 ( -1.7835e-08  1.81422e-08 ) ergs/cm2
Cutoff power-law model
Time interval is from    1.000 sec. to    2.000 sec.
Spectral model in the cutoff power-law:
------------------------------------------------------------
Parameters  : value       lower 90%   higher 90%
Photon index: -0.123693     ( -1.19064   2.60169 )
Epeak [keV] : 117.180      ( -117.137 -117.137 )
Norm@50keV  : 1.60997E-02    ( -0.0161104   0.258684 )
------------------------------------------------------------
#Fit statistic : Chi-Squared =          61.37 using 59 PHA bins.
# Reduced chi-squared =          1.096 for     56 degrees of freedom
# Null hypothesis probability =   2.895578e-01

Photon flux (15-150 keV)    in 1 sec: 0.701598 ( -0.185161  0.18531 ) ph/cm2/s
Energy fluence (15-150 keV)             : 6.44718e-08 ( -2.05803e-08  2.02236e-08 ) ergs/cm2
Time-resolved spectra
Distribution
T90 vs. Hardness ratio plot
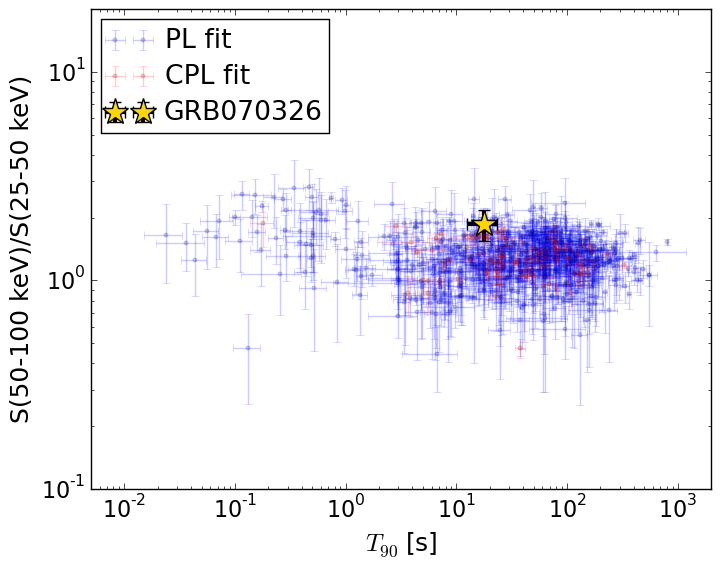
T90                                   = 18.0 sec.
Hardness ratio (energy fluence ratio) = 1.8710275299
S(15-50 keV) vs. S(50-150 keV) plot
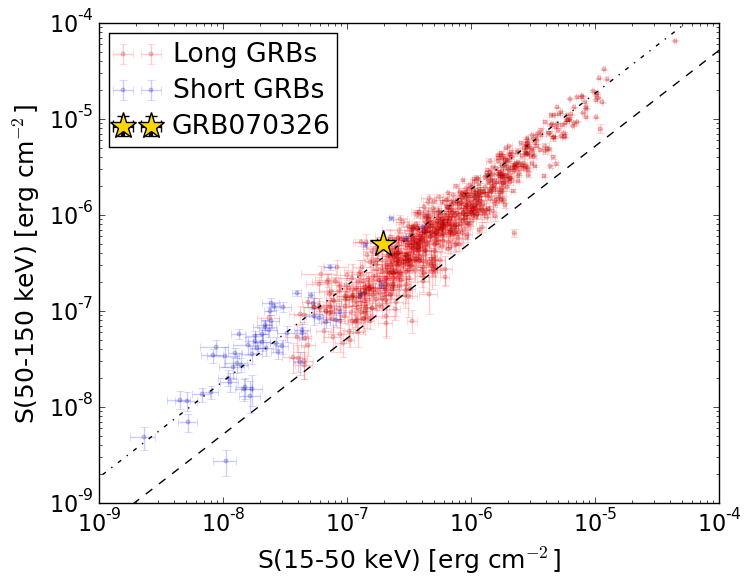
S(15-50 keV)  = 1.9361264e-07
S(50-150 keV) = 4.960679e-07
The dash-dotted line and the dashed line traces the fluences calculated from the Band function with Epeak = 15 and 150 keV, respectively. Both lines assume a canonical values of alpha = -1 and beta = -2.5.
Mask shadow pattern
Mask shadow pattern unavailable because this burst occurs during telescope slews.Spacecraft aspect plot