Analysis Summary
Notes:
- 1) No attempt has been made to eliminate the non-significant decimal places.
- 2) This batgrbproduct analysis is done using the HEASARC data.
- 3) This batgrbproduct analysis is using the flight position for the mask-weighting calculation.
======================================================================
                  BAT GRB EVENT DATA PROCESSING REPORT
    Process Script Ver: batgrbproduct v2.46
    Process Start Time: Mon Jan 20 11:02:14 EST 2014
             Host Name: batevent1
   Current Working Dir: /local/data/batevent/batevent_reproc/trigger272773
======================================================================

  Trigger: 00272773      Segment: 000

  BAT Trigger Time: 196746835.008   [s; MET]
      Trigger Stop: 196746836.032   [s; MET]
               UTC: 2007-03-28T03:53:53.155520    [includes UTCF correction]
       Where From?: TDRSS position message

  BAT
    RA: 65.1167749451009   Dec: -34.0690105976273  [deg; J2000]

     Catalogged Source?: NO
     Point Source?:      YES
     GRB Indicated?:     YES    [ by BAT flight software ]
     Image S/N Ratio:    16.55
     Image Trigger?:     NO
     Rate S/N Ratio:     75.5645419492502  [ if not an image trigger ]
     Image S/N Ratio:    16.55

  Analysis Position:   [ source = BAT ]
    RA: 65.1167749451009   Dec: -34.0690105976273  [deg; J2000]

  Refined Position:   [ source = BAT pre-slew burst ]
    RA: 65.1156752078046   Dec: -34.0764757488784  [deg; J2000]
        { 04h 20m 27.8s , -34d 04' 35.3" }
         +/- 0.64247440303593 [arcmin] (estimated 90% radius based on SNR)
         +/- 0.228990516345009 [arcmin] (formal 1-sigma fit error)
    SNR: 57.2281954992137

  Angular difference between the analysis and refined position is 0.451232 arcmin

  Partial Coding Fraction: 0.609375    [ including projection effects ]

  Duration
     T90: 72.1160000264645 +/- 8.4830277610073
        Measured from: -3.80799999833107
                   to: 68.3080000281334     [s; relative to TRIGTIME]
     T50: 17.9679999947548 +/- 0.765631784157104
        Measured from: 3.80400002002716
                   to: 21.772000014782     [s; relative to TRIGTIME]


  Fluence
     Peak Flux  (peak 1 second)
        Measured from: 0.784000009298325
                   to: 1.78400000929832     [s; relative to TRIGTIME]
     Total Fluence
        Measured from: -17.9679999947548
                   to: 123.092000007629     [s; relative to TRIGTIME]

             Band 1     Band 2     Band 3     Band 4
              15-25      25-50     50-100    100-350     keV
 Total     2.650506   4.463461   4.401652   1.566906
           0.064556   0.069126   0.063031   0.052093 [error]
 Peak      0.100188   0.168375   0.188215   0.083044
           0.007786   0.009170   0.009104   0.007645 [error]

     [ fluence units of on-axis counts / fully illuminated detector ]

======================================================================


====== Table of the duration information =============================

        Value   tstart    tstop
T100  141.060  -17.968  123.092
T90    72.116   -3.808   68.308
T50    17.968    3.804   21.772
Peak    1.000    0.784    1.784


====== Spectral Analysis Summary =====================================

Model      : spectral model: simple power-law (PL) and cutoff power-law (CPL)
Ph_index   : photon index: E^{Ph_index}
Ph_90err   : 90% error of the photon index
Epeak      : Epeak in keV
Epeak_90err: 90% error of Epeak
Norm       : normalization at 50 keV in both the PL model and CPL model
Nomr_90err : 90% error of the normalization
chi2       : Chi-Squared
dof        : degree of freedo

=== Time-averaged spectral analysis ===
(Best model with acceptable fit: PL)

Model Ph_index Ph_90err_low Ph_90err_hi  Epeak  Epeak_90err_low  Epeak_90err_hi  Norm       Nomr_90err_low    Norm_90err_hi    chi2    dof
PL      -1.213    -0.036      0.036       -           -               -         6.42e-03     -1.27e-04          1.27e-04      36.780   57
CPL     -1.116    -0.066      0.146      565.879    -565.879      -565.879      7.03e-03     -3.98e-04          9.98e-04      35.430   56


=== 1-s peak spectral analysis ===
(Best model with acceptable fit: PL)

Model Ph_index Ph_90err_low Ph_90err_hi  Epeak  Epeak_90err_low  Epeak_90err_hi  Norm       Nomr_90err_low    Norm_90err_hi    chi2    dof
PL      -1.071     -0.095     0.096       -           -               -         3.64e-02     -1.96e-03          1.95e-03      54.380   57
CPL     -0.982     -0.133     0.374      655.075    -655.075      -655.075      3.99e-02     -8.41e-03          1.81e-02      54.200   56


=== Fluence/Peak Flux Summary ===

              Model    Band1     Band2     Band3     Band4     Band5     Total
                       15-25     25-50    50-100    100-350    15-150    15-350    keV
Fluence         PL   8.84e-07  1.94e-06  3.34e-06  1.34e-05  9.15e-06  1.95e-05   erg/cm2
      90%_error_low -3.85e-08 -4.98e-08 -6.77e-08 -6.42e-07 -1.76e-07 -6.59e-07   erg/cm2
      90%_error_hi   3.92e-08  4.97e-08  6.76e-08  6.64e-07  1.76e-07  6.78e-07   erg/cm2
Peak flux       PL   9.94e-01  1.29e+00  1.23e+00  2.07e+00  4.21e+00  5.59e+00   ph/cm2/s
      90%_error_low -1.09e-01 -8.72e-02 -7.24e-02 -2.55e-01 -2.33e-01 -3.19e-01   ph/cm2/s
      90%_error_hi   1.13e-01  8.65e-02  7.20e-02  2.78e-01  2.34e-01  3.24e-01   ph/cm2/s

Fluence        CPL   8.57e-07  1.94e-06  3.38e-06  1.19e-05  9.12e-06  1.81e-05   erg/cm2
      90%_error_low -5.33e-08 -5.05e-08 -7.40e-08 -1.79e-06 -1.83e-07 -1.78e-06   erg/cm2
      90%_error_hi   5.40e-08  5.06e-08  8.59e-08  1.51e-06  1.83e-07  1.50e-06   erg/cm2
Peak flux      CPL   1.24e+00  1.25e+00  7.00e-01  7.45e-01  3.85e+00  4.33e+00   ph/cm2/s
      90%_error_low     N/A       N/A       N/A       N/A       N/A       N/A     ph/cm2/s
      90%_error_hi      N/A       N/A       N/A       N/A       N/A       N/A     ph/cm2/s

======================================================================
Image
Pre-slew 15.0-350.0 keV image (Event data)
#   RAcent    DECcent   POSerr    Theta     Phi              Peak Cts       SNR   Name
   65.1157   -34.0765   0.0034    39.5857  -167.8965         6.0581134     57.228 TRIG_00272773

Foreground time interval of the image:
-17.968  11.493 (delta_t =  29.461 [sec])
Background time interval of the image:
-74.707 -17.968 (delta_t =  56.739 [sec])
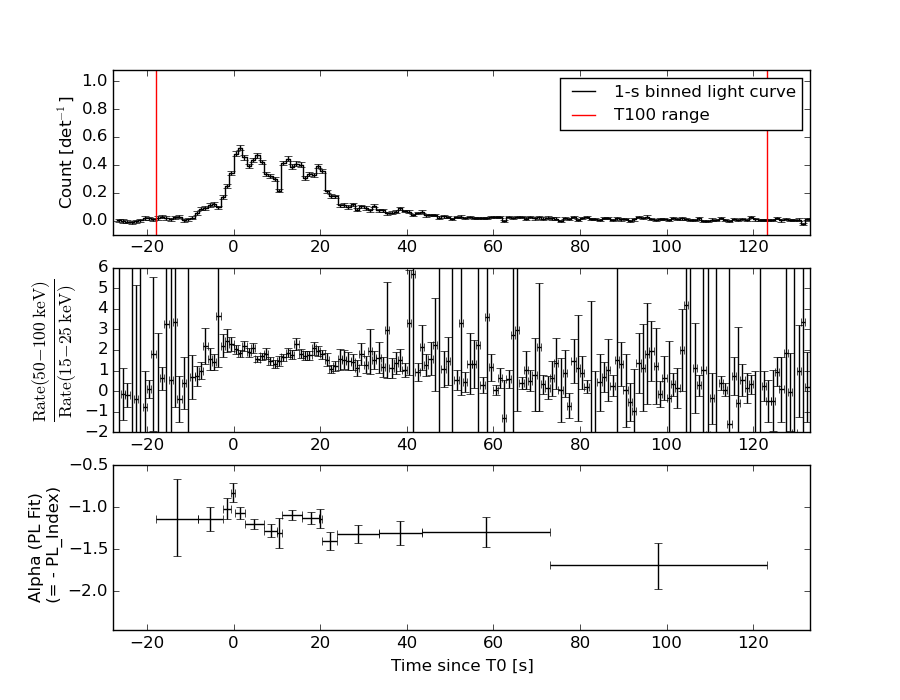
Light Curves
Note: The mask-weighted lightcurves have units of either count/det or counts/sec/det, where a det is 0.4 x 0.4 = 0.16 sq cm.
Full-time range; 1 s binning
Other quick-look light curves:
- 64 ms binning (zoomed)
- 16 ms binning (zoomed)
- 8 ms binning (zoomed)
- 2 ms binning (zoomed)
- SN=5 or 10 s binning (full-time range)
- Raw light curve
Spectra
- 64 ms binning (zoomed)
- 16 ms binning (zoomed)
- 8 ms binning (zoomed)
- 2 ms binning (zoomed)
- SN=5 or 10 s binning (full-time range)
- Raw light curve
Spectra
Notes:
- 1) The fitting includes the systematic errors.
- 2) When the burst includes telescope slew time periods, the fitting uses an average response file made from multiple 5-s response files through out the slew time plus single time preiod for the non-slew times, and weighted by the total counts in the corresponding time period using addrmf. An average response file is needed becuase a spectral fit using the pre-slew DRM will introduce some errors in both a spectral shape and a normalization if the PHA file contains a lot of the slew/post-slew time interval.
- 3) For fits to more complicated models (e.g. a power-law over a cutoff power-law), the BAT team has decided to require a chi-square improvement of more than 6 for each extra dof.
Time averaged spectrum fit using the average DRM
Power-law model
Time interval is from  -17.968 sec. to  123.092 sec.

Spectral model in power-law:
------------------------------------------------------------
Parameters  : value       lower 90%   higher 90%
Photon index: -1.21295     ( -0.0359883   0.036152 )
Norm@50keV  : 6.41683E-03    ( -0.000127179   0.000126811 )
------------------------------------------------------------
#Fit statistic : Chi-Squared =          36.78 using 59 PHA bins.
# Reduced chi-squared =         0.6452 for     57 degrees of freedom
# Null hypothesis probability =   9.828108e-01

Photon flux (15-150 keV)    in 141.1 sec: 0.754610 ( -0.016576  0.016628 ) ph/cm2/s
Energy fluence (15-150 keV)             : 9.1535e-06 ( -1.7555e-07  1.7576e-07 ) ergs/cm2
Cutoff power-law model
Time interval is from  -17.968 sec. to  123.092 sec.
Spectral model in the cutoff power-law:
------------------------------------------------------------
Parameters  : value       lower 90%   higher 90%
Photon index: -1.11607     ( -0.0663506   0.145965 )
Epeak [keV] : 565.879      ( -565.881 -565.881 )
Norm@50keV  : 7.02525E-03    ( -0.000397587   0.000998337 )
------------------------------------------------------------
#Fit statistic : Chi-Squared =          35.43 using 59 PHA bins.
# Reduced chi-squared =         0.6327 for     56 degrees of freedom
# Null hypothesis probability =   9.855720e-01

Photon flux (15-150 keV)    in 141.1 sec: 0.749138 ( -0.018237  0.018158 ) ph/cm2/s
Energy fluence (15-150 keV)             : 9.11921e-06 ( -1.82923e-07  1.82592e-07 ) ergs/cm2
1-s peak spectrum fit
Power-law model
Time interval is from    0.784 sec. to    1.784 sec.

Spectral model in power-law:
------------------------------------------------------------
Parameters  : value       lower 90%   higher 90%
Photon index: -1.07145     ( -0.0947168   0.0958464 )
Norm@50keV  : 3.63593E-02    ( -0.00195912   0.00195488 )
------------------------------------------------------------
#Fit statistic : Chi-Squared =          54.38 using 59 PHA bins.
# Reduced chi-squared =         0.9541 for     57 degrees of freedom
# Null hypothesis probability =   5.738446e-01

Photon flux (15-150 keV)    in 1 sec: 4.20655 ( -0.23346  0.23377 ) ph/cm2/s
Energy fluence (15-150 keV)             : 3.83725e-07 ( -2.22735e-08  2.23442e-08 ) ergs/cm2
Cutoff power-law model
Time interval is from    0.784 sec. to    1.784 sec.
Spectral model in the cutoff power-law:
------------------------------------------------------------
Parameters  : value       lower 90%   higher 90%
Photon index: -0.982101     ( -0.133391   0.374105 )
Epeak [keV] : 655.075      ( -655.075 -655.075 )
Norm@50keV  : 3.98738E-02    ( -0.00840645   0.0180542 )
------------------------------------------------------------
#Fit statistic : Chi-Squared =          54.20 using 59 PHA bins.
# Reduced chi-squared =         0.9678 for     56 degrees of freedom
# Null hypothesis probability =   5.434376e-01

Photon flux (15-150 keV)    in 1 sec: 3.84854 (    ) ph/cm2/s
Energy fluence (15-150 keV)             : 3.82226e-07 ( -2.31966e-08  2.30492e-08 ) ergs/cm2
Time-resolved spectra
Distribution
T90 vs. Hardness ratio plot
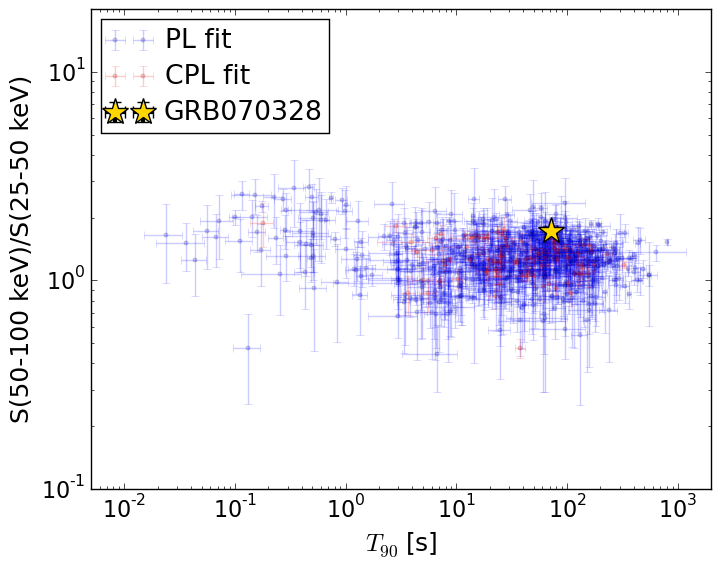
T90                                   = 72.116 sec.
Hardness ratio (energy fluence ratio) = 1.72559994302
S(15-50 keV) vs. S(50-150 keV) plot
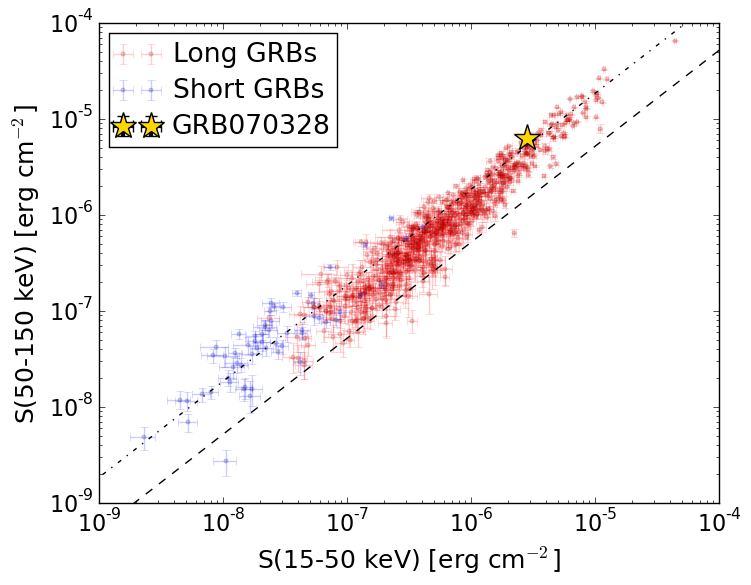
S(15-50 keV)  = 2.8215048e-06
S(50-150 keV) = 6.332107e-06
The dash-dotted line and the dashed line traces the fluences calculated from the Band function with Epeak = 15 and 150 keV, respectively. Both lines assume a canonical values of alpha = -1 and beta = -2.5.
Mask shadow pattern
IMX = -8.084711976861790E-01, IMY = 1.733730157792924E-01
Spacecraft aspect plot

Bright source in the pre-burst/pre-slew/post-slew images
Pre-burst image of 15-350 keV band
Time interval of the image:
-74.707410 -17.968000

# RAcent  DECcent POSerr Theta    Phi  PeakCts   SNR AngSep     Name
#  [deg]    [deg]    ['] [deg]  [deg]                   [']
 83.6517  22.0112    0.4  22.3   48.4   2.4446  29.8    1.0	Crab
 84.0429  45.2019    2.0  42.1   24.6   0.7470   5.7 ------	UNKNOWN
 24.2144  21.1234    2.6  45.5  -57.5   1.3701   4.5 ------	UNKNOWN
Pre-slew background subtracted image of 15-350 keV band
Time interval of the image:
-17.968000 11.492600

# RAcent  DECcent POSerr Theta    Phi  PeakCts   SNR AngSep     Name
#  [deg]    [deg]    ['] [deg]  [deg]                   [']
 83.7718  22.0285    6.6  22.4   48.6  -0.1437  -1.8    7.8	Crab
 65.1157 -34.0765    0.2  39.6 -167.9   6.0580  57.2 ------	UNKNOWN
 65.9519 -53.0133    2.7  58.4 -170.3   1.9787   4.3 ------	UNKNOWN
 30.8764  -8.8687    3.1  39.9 -102.7   0.9695   3.8 ------	UNKNOWN
 28.8703  -6.4421    2.6  41.1  -98.2   1.3406   4.4 ------	UNKNOWN
Post-slew image of 15-350 keV band
Time interval of the image:
77.092600 963.097200

# RAcent  DECcent POSerr Theta    Phi  PeakCts   SNR AngSep     Name
#  [deg]    [deg]    ['] [deg]  [deg]                   [']
104.9740 -29.0881    3.5  34.1   71.6   2.5292   3.3 ------	UNKNOWN
 77.4519 -14.3094    2.9  22.7   11.2   1.3208   4.0 ------	UNKNOWN
 65.1854 -34.0914    2.1   0.1  112.6   2.0803   5.5 ------	UNKNOWN
 42.0219   7.8286    3.9  47.2  -53.2   6.2769   3.0 ------	UNKNOWN