Analysis Summary
Notes:
- 1) No attempt has been made to eliminate the non-significant decimal places.
- 2) This batgrbproduct analysis is done using the HEASARC data.
- 3) This batgrbproduct analysis is using the flight position for the mask-weighting calculation.
======================================================================
                  BAT GRB EVENT DATA PROCESSING REPORT
    Process Script Ver: batgrbproduct v2.46
    Process Start Time: Tue Jun 23 22:35:48 EDT 2015
             Host Name: bat1
   Current Working Dir: /local/data/bat1/alien/Swift_3rdBATcatalog/event/batevent_reproc/trigger275087
======================================================================

  Trigger: 00275087      Segment: 000

  BAT Trigger Time: 198015155.2   [s; MET]
      Trigger Stop: 198015159.296   [s; MET]
               UTC: 2007-04-11T20:12:33.316080    [includes UTCF correction]
       Where From?: TDRSS position message

  BAT
    RA: 107.337604211936   Dec: 1.08250430991337  [deg; J2000]

     Catalogged Source?: NO
     Point Source?:      YES
     GRB Indicated?:     YES    [ by BAT flight software ]
     Image S/N Ratio:    10.52
     Image Trigger?:     NO
     Rate S/N Ratio:     8  [ if not an image trigger ]
     Image S/N Ratio:    10.52

  Analysis Position:   [ source = BAT ]
    RA: 107.337604211936   Dec: 1.08250430991337  [deg; J2000]

  Refined Position:   [ source = BAT pre-slew burst ]
    RA: 107.343030690904   Dec: 1.06619341368563  [deg; J2000]
        { 07h 09m 22.3s , +01d 03' 58.3" }
         +/- 1.42092839248244 [arcmin] (estimated 90% radius based on SNR)
         +/- 0.516603943044787 [arcmin] (formal 1-sigma fit error)
    SNR: 18.4144225830642

  Angular difference between the analysis and refined position is 1.031375 arcmin

  Partial Coding Fraction: 0.7421875    [ including projection effects ]

  Duration
     T90: 115.692000001669 +/- 16.8657818186081
        Measured from: -25.1239999830723
                   to: 90.5680000185966     [s; relative to TRIGTIME]
     T50: 64.0960000157356 +/- 3.46139684970833
        Measured from: 6.28000000119209
                   to: 70.3760000169277     [s; relative to TRIGTIME]


  Fluence
     Peak Flux  (peak 1 second)
        Measured from: 70.2240000069141
                   to: 71.2240000069141     [s; relative to TRIGTIME]
     Total Fluence
        Measured from: -47.8839999735355
                   to: 109.536000013351     [s; relative to TRIGTIME]

             Band 1     Band 2     Band 3     Band 4
              15-25      25-50     50-100    100-350     keV
 Total     1.468113   1.774935   1.157568   0.297044
           0.072248   0.073694   0.064137   0.055205 [error]
 Peak      0.036570   0.043577   0.032045   0.005459
           0.005329   0.005652   0.004865   0.004076 [error]

     [ fluence units of on-axis counts / fully illuminated detector ]

======================================================================


====== Table of the duration information =============================

        Value   tstart    tstop
T100  157.420  -47.884  109.536
T90   115.692  -25.124   90.568
T50    64.096    6.280   70.376
Peak    1.000   70.224   71.224


====== Spectral Analysis Summary =====================================

Model      : spectral model: simple power-law (PL) and cutoff power-law (CPL)
Ph_index   : photon index: E^{Ph_index}
Ph_90err   : 90% error of the photon index
Epeak      : Epeak in keV
Epeak_90err: 90% error of Epeak
Norm       : normalization at 50 keV in both the PL model and CPL model
Nomr_90err : 90% error of the normalization
chi2       : Chi-Squared
dof        : degree of freedo

=== Time-averaged spectral analysis ===
(Best model with acceptable fit: PL)

Model Ph_index Ph_90err_low Ph_90err_hi  Epeak  Epeak_90err_low  Epeak_90err_hi  Norm       Nomr_90err_low    Norm_90err_hi    chi2    dof
PL      -1.657    -0.095      0.095       -           -               -         1.84e-03     -9.60e-05          9.54e-05      60.500   57
CPL     -1.655    -0.096      0.095     9999.200    -9999.190      -9999.200      1.85e-03     -7.09e-04          4.80e-04      60.520   56


=== 1-s peak spectral analysis ===
(Best model with acceptable fit: PL)

Model Ph_index Ph_90err_low Ph_90err_hi  Epeak  Epeak_90err_low  Epeak_90err_hi  Norm       Nomr_90err_low    Norm_90err_hi    chi2    dof
PL      -1.486     -0.240     0.236       -           -               -         7.45e-03     -1.06e-03          1.04e-03      34.230   57
CPL     -1.370     -1.100     0.986      259.140    -259.140      -259.140      8.59e-03     -2.17e-03          1.91e-02      34.180   56


=== Fluence/Peak Flux Summary ===

              Model    Band1     Band2     Band3     Band4     Band5     Total
                       15-25     25-50    50-100    100-350    15-150    15-350    keV
Fluence         PL   4.29e-07  7.16e-07  9.09e-07  2.30e-06  2.69e-06  4.36e-06   erg/cm2
      90%_error_low -3.72e-08 -3.69e-08 -6.43e-08 -3.37e-07 -1.49e-07 -3.88e-07   erg/cm2
      90%_error_hi   3.81e-08  3.68e-08  6.43e-08  3.76e-07  1.50e-07  4.19e-07   erg/cm2
Peak flux       PL   3.03e-01  3.07e-01  2.19e-01  2.50e-01  9.27e-01  1.08e+00   ph/cm2/s
      90%_error_low -6.58e-02 -4.29e-02 -4.00e-02 -8.15e-02 -1.24e-01 -1.50e-01   ph/cm2/s
      90%_error_hi   6.93e-02  4.25e-02  3.96e-02  1.03e-01  1.24e-01  1.52e-01   ph/cm2/s

Fluence        CPL   4.37e-07  7.12e-07  9.05e-07  2.65e-06  2.72e-06  4.40e-06   erg/cm2
      90%_error_low    N/A       N/A    -6.08e-08    N/A    -1.80e-07 -8.10e-07   erg/cm2
      90%_error_hi     N/A       N/A     6.78e-08    N/A     1.20e-07  1.52e-07   erg/cm2
Peak flux      CPL   2.98e-01  3.11e-01  2.21e-01  2.13e-01  9.23e-01  1.04e+00   ph/cm2/s
      90%_error_low -7.66e-02 -4.61e-02 -4.12e-02 -2.13e-01 -1.28e-01 -2.04e-01   ph/cm2/s
      90%_error_hi   6.70e-02  5.32e-02  4.31e-02  9.63e-02  1.27e-01  1.85e-01   ph/cm2/s

======================================================================
Image
Pre-slew 15.0-350.0 keV image (Event data)
#   RAcent    DECcent   POSerr    Theta     Phi              Peak Cts       SNR   Name
  107.3430     1.0662   0.0105    29.1591    14.2143         2.1897984     18.414 TRIG_00275087

Foreground time interval of the image:
-47.884  36.101 (delta_t =  83.985 [sec])
Background time interval of the image:
-239.200 -47.884 (delta_t = 191.316 [sec])
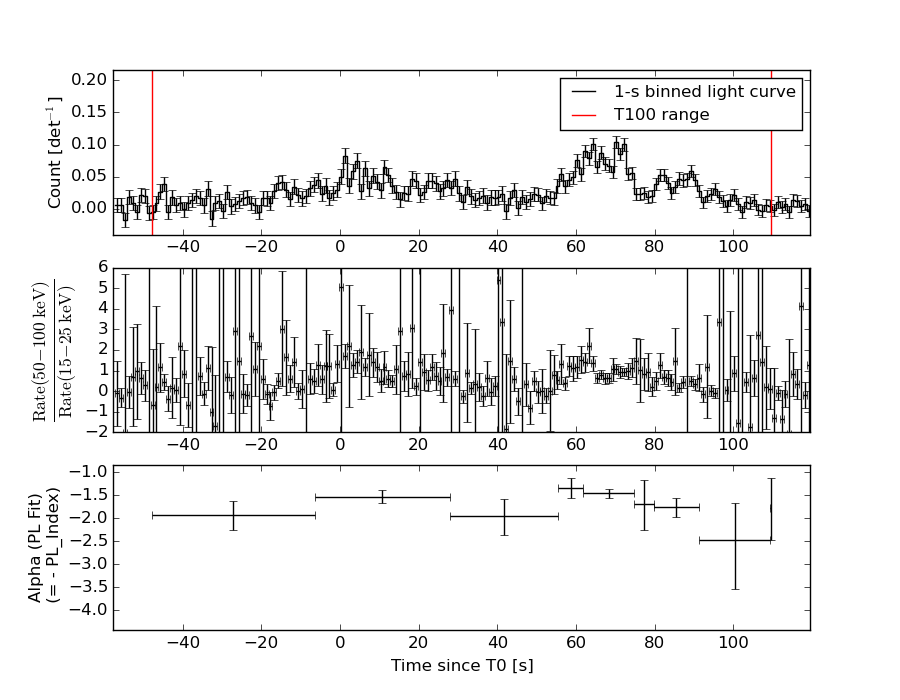
Light Curves
Note: The mask-weighted lightcurves have units of either count/det or counts/sec/det, where a det is 0.4 x 0.4 = 0.16 sq cm.
Full-time range; 1 s binning
Other quick-look light curves:
- 64 ms binning (zoomed)
- 16 ms binning (zoomed)
- 8 ms binning (zoomed)
- 2 ms binning (zoomed)
- SN=5 or 10 s binning (full-time range)
- Raw light curve
Spectra
- 64 ms binning (zoomed)
- 16 ms binning (zoomed)
- 8 ms binning (zoomed)
- 2 ms binning (zoomed)
- SN=5 or 10 s binning (full-time range)
- Raw light curve
Spectra
Notes:
- 1) The fitting includes the systematic errors.
- 2) When the burst includes telescope slew time periods, the fitting uses an average response file made from multiple 5-s response files through out the slew time plus single time preiod for the non-slew times, and weighted by the total counts in the corresponding time period using addrmf. An average response file is needed becuase a spectral fit using the pre-slew DRM will introduce some errors in both a spectral shape and a normalization if the PHA file contains a lot of the slew/post-slew time interval.
- 3) For fits to more complicated models (e.g. a power-law over a cutoff power-law), the BAT team has decided to require a chi-square improvement of more than 6 for each extra dof.
Time averaged spectrum fit using the average DRM
Power-law model
Time interval is from  -47.884 sec. to  109.536 sec.

Spectral model in power-law:
------------------------------------------------------------
Parameters  : value       lower 90%   higher 90%
Photon index: -1.65699     ( -0.0954638   0.094867 )
Norm@50keV  : 1.84159E-03    ( -9.59557e-05   9.545e-05 )
------------------------------------------------------------
#Fit statistic : Chi-Squared =          60.50 using 59 PHA bins.
# Reduced chi-squared =          1.061 for     57 degrees of freedom
# Null hypothesis probability =   3.505121e-01

Photon flux (15-150 keV)    in 157.4 sec: 0.241033 ( -0.012377  0.012409 ) ph/cm2/s
Energy fluence (15-150 keV)             : 2.69442e-06 ( -1.49321e-07  1.50268e-07 ) ergs/cm2
Cutoff power-law model

Time interval is from  -47.884 sec. to  109.536 sec.
Spectral model in the cutoff power-law:
------------------------------------------------------------
Parameters  : value       lower 90%   higher 90%
Photon index: -1.65524     ( -0.0960834   0.0952058 )
Epeak [keV] : 9999.20      ( -9999.35 -9999.36 )
Norm@50keV  : 1.84535E-03    ( -0.00070928   0.00048017 )
------------------------------------------------------------
#Fit statistic : Chi-Squared =          60.52 using 59 PHA bins.
# Reduced chi-squared =          1.081 for     56 degrees of freedom
# Null hypothesis probability =   3.160402e-01

Photon flux (15-150 keV)    in 157.4 sec: 0.243036 ( -0.014403  0.010376 ) ph/cm2/s
Energy fluence (15-150 keV)             : 2.72423e-06 ( -1.7966e-07  1.19867e-07 ) ergs/cm2
1-s peak spectrum fit
Power-law model
Time interval is from   70.224 sec. to   71.224 sec.

Spectral model in power-law:
------------------------------------------------------------
Parameters  : value       lower 90%   higher 90%
Photon index: -1.48624     ( -0.239822   0.235944 )
Norm@50keV  : 7.45468E-03    ( -0.00105963   0.00104475 )
------------------------------------------------------------
#Fit statistic : Chi-Squared =          34.23 using 59 PHA bins.
# Reduced chi-squared =         0.6005 for     57 degrees of freedom
# Null hypothesis probability =   9.927454e-01

Photon flux (15-150 keV)    in 1 sec: 0.927258 ( -0.124226  0.124302 ) ph/cm2/s
Energy fluence (15-150 keV)             : 7.08892e-08 ( -1.11334e-08  1.13332e-08 ) ergs/cm2
Cutoff power-law model
Time interval is from   70.224 sec. to   71.224 sec.
Spectral model in the cutoff power-law:
------------------------------------------------------------
Parameters  : value       lower 90%   higher 90%
Photon index: -1.36955     ( -1.09933   0.986284 )
Epeak [keV] : 259.140      ( -261.611 -261.611 )
Norm@50keV  : 8.58865E-03    ( -0.00215983   0.019126 )
------------------------------------------------------------
#Fit statistic : Chi-Squared =          34.18 using 59 PHA bins.
# Reduced chi-squared =         0.6103 for     56 degrees of freedom
# Null hypothesis probability =   9.905896e-01

Photon flux (15-150 keV)    in 1 sec: 0.923068 ( -0.128181  0.127172 ) ph/cm2/s
Energy fluence (15-150 keV)             : 7.01407e-08 ( -1.24946e-08  1.18982e-08 ) ergs/cm2
Time-resolved spectra
Distribution
T90 vs. Hardness ratio plot
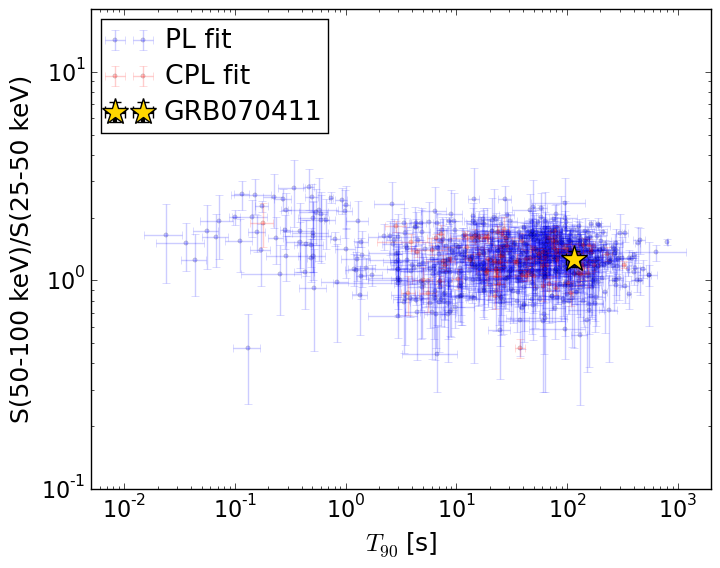
T90                                   = 115.692 sec.
Hardness ratio (energy fluence ratio) = 1.2684402707
S(15-50 keV) vs. S(50-150 keV) plot
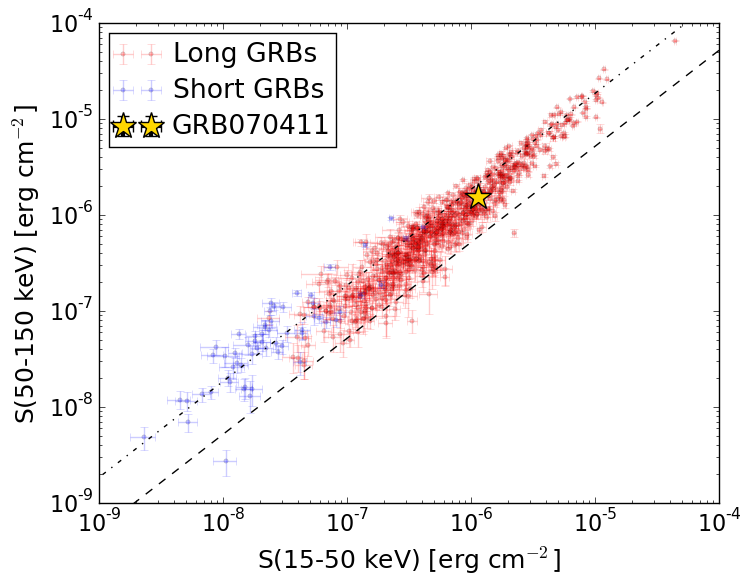
S(15-50 keV)  = 1.1452147e-06
S(50-150 keV) = 1.5491824e-06
The dash-dotted line and the dashed line traces the fluences calculated from the Band function with Epeak = 15 and 150 keV, respectively. Both lines assume a canonical values of alpha = -1 and beta = -2.5.
Mask shadow pattern
IMX = 5.408630220464085E-01, IMY = -1.370027779097523E-01
Spacecraft aspect plot
Bright source in the pre-burst/pre-slew/post-slew images
Pre-burst image of 15-350 keV band
Time interval of the image:
-239.200000 -47.884000

# RAcent  DECcent POSerr Theta    Phi  PeakCts   SNR AngSep     Name
#  [deg]    [deg]    ['] [deg]  [deg]                   [']
 83.6197  22.0227    0.5  48.0  -27.3   6.2372  21.6    0.9	Crab
135.3589 -40.7088  168.6  37.9  110.4   0.0239   0.1   12.0	Vela X-1
 31.9279 -70.3018    2.6  57.2 -173.8   3.0351   4.4 ------	UNKNOWN
 42.4913 -62.7641    2.8  50.6 -167.0   1.4161   4.1 ------	UNKNOWN
 76.5130 -17.3112    2.2  17.8  -82.5   0.7332   5.1 ------	UNKNOWN
 22.9246 -57.0908    3.9  58.9 -157.7   3.1546   3.0 ------	UNKNOWN
Pre-slew background subtracted image of 15-350 keV band
Time interval of the image:
-47.884000 36.100590

# RAcent  DECcent POSerr Theta    Phi  PeakCts   SNR AngSep     Name
#  [deg]    [deg]    ['] [deg]  [deg]                   [']
 83.7713  22.0652    5.2  48.0  -27.1   0.5286   2.2    8.3	Crab
135.5926 -40.6688    8.6  38.0  110.3  -0.4049  -1.3    7.4	Vela X-1
107.3430   1.0662    0.6  29.2   14.2   2.1898  18.4 ------	UNKNOWN
 91.7124  27.2264    2.7  52.2  -16.9   1.1454   4.2 ------	UNKNOWN
Post-slew image of 15-350 keV band
Time interval of the image:
85.700600 302.890000
420.800000 532.700590

# RAcent  DECcent POSerr Theta    Phi  PeakCts   SNR AngSep     Name
#  [deg]    [deg]    ['] [deg]  [deg]                   [']
 83.6240  22.0245    0.3  31.2  -54.4  12.5806  37.3    0.8	Crab
135.5903 -40.6706    3.0  49.0  143.3  -4.0911  -3.8    7.5	Vela X-1
138.8006 -18.7074    2.5  36.7  115.9   2.5056   4.5 ------	UNKNOWN
134.1773  45.7299    2.4  50.5   15.8   2.9487   4.8 ------	UNKNOWN
120.7105  35.5872    2.7  36.7   10.0   1.2357   4.2 ------	UNKNOWN
109.8524  36.0199    2.9  35.0   -4.8   1.1741   4.0 ------	UNKNOWN
101.1822  37.8932    3.2  37.2  -16.4   1.0977   3.6 ------	UNKNOWN
 90.3267 -20.2434    2.4  27.1 -151.2   1.0511   4.7 ------	UNKNOWN
 85.9870  41.6994    2.4  44.9  -31.0   2.1178   4.8 ------	UNKNOWN
 84.2882  56.7673    3.7  58.7  -22.9   4.6193   3.2 ------	UNKNOWN
 69.8457  32.0825    3.6  47.0  -53.2   3.6229   3.2 ------	UNKNOWN