Analysis Summary
Notes:
- 1) No attempt has been made to eliminate the non-significant decimal places.
- 2) This batgrbproduct analysis is done using the HEASARC data.
- 3) This batgrbproduct analysis is using the flight position for the mask-weighting calculation.
======================================================================
                  BAT GRB EVENT DATA PROCESSING REPORT
    Process Script Ver: batgrbproduct v2.46
    Process Start Time: Tue Jun 23 22:14:14 EDT 2015
             Host Name: bat1
   Current Working Dir: /local/data/bat1/alien/Swift_3rdBATcatalog/event/batevent_reproc/trigger275119
======================================================================

  Trigger: 00275119      Segment: 000

  BAT Trigger Time: 198034025.28   [s; MET]
      Trigger Stop: 198034025.792   [s; MET]
               UTC: 2007-04-12T01:27:03.395620    [includes UTCF correction]
       Where From?: TDRSS position message

  BAT
    RA: 181.505172705328   Dec: 40.1008001435465  [deg; J2000]

     Catalogged Source?: NO
     Point Source?:      YES
     GRB Indicated?:     YES    [ by BAT flight software ]
     Image S/N Ratio:    7.32
     Image Trigger?:     NO
     Rate S/N Ratio:     8.94427190999916  [ if not an image trigger ]
     Image S/N Ratio:    7.32

  Analysis Position:   [ source = BAT ]
    RA: 181.505172705328   Dec: 40.1008001435465  [deg; J2000]

  Refined Position:   [ source = BAT pre-slew burst ]
    RA: 181.523400544306   Dec: 40.1474402138937  [deg; J2000]
        { 12h 06m 05.6s , +40d 08' 50.8" }
         +/- 1.52925958471965 [arcmin] (estimated 90% radius based on SNR)
         +/- 0.632155016314402 [arcmin] (formal 1-sigma fit error)
    SNR: 16.5795902308619

  Angular difference between the analysis and refined position is 2.920689 arcmin

  Partial Coding Fraction: 0.984375    [ including projection effects ]

  Duration
     T90: 33.8760000169277 +/- 5.07696445672102
        Measured from: -3.21999999880791
                   to: 30.6560000181198     [s; relative to TRIGTIME]
     T50: 7.91200003027916 +/- 15.3215607602688
        Measured from: 0.359999984502792
                   to: 8.27200001478195     [s; relative to TRIGTIME]


  Fluence
     Peak Flux  (peak 1 second)
        Measured from: 5.31999999284744
                   to: 6.31999999284744     [s; relative to TRIGTIME]
     Total Fluence
        Measured from: -4.55200001597404
                   to: 31.1879999935627     [s; relative to TRIGTIME]

             Band 1     Band 2     Band 3     Band 4
              15-25      25-50     50-100    100-350     keV
 Total     0.215926   0.309423   0.223459   0.007192
           0.027741   0.029851   0.028857   0.031731 [error]
 Peak      0.017232   0.035541   0.029571   0.007499
           0.004822   0.005309   0.005111   0.005537 [error]

     [ fluence units of on-axis counts / fully illuminated detector ]

======================================================================


====== Table of the duration information =============================

        Value   tstart    tstop
T100   35.740   -4.552   31.188
T90    33.876   -3.220   30.656
T50     7.912    0.360    8.272
Peak    1.000    5.320    6.320


====== Spectral Analysis Summary =====================================

Model      : spectral model: simple power-law (PL) and cutoff power-law (CPL)
Ph_index   : photon index: E^{Ph_index}
Ph_90err   : 90% error of the photon index
Epeak      : Epeak in keV
Epeak_90err: 90% error of Epeak
Norm       : normalization at 50 keV in both the PL model and CPL model
Nomr_90err : 90% error of the normalization
chi2       : Chi-Squared
dof        : degree of freedo

=== Time-averaged spectral analysis ===
(Best model with acceptable fit: PL)

Model Ph_index Ph_90err_low Ph_90err_hi  Epeak  Epeak_90err_low  Epeak_90err_hi  Norm       Nomr_90err_low    Norm_90err_hi    chi2    dof
PL      -1.407    -0.194      0.192       -           -               -         1.40e-03     -1.67e-04          1.66e-04      67.290   57
CPL     -0.340    -0.871      1.077       69.928     -16.654       103.328      5.34e-03     -5.34e-03          1.48e-02      62.760   56


=== 1-s peak spectral analysis ===
(Best model with acceptable fit: PL)

Model Ph_index Ph_90err_low Ph_90err_hi  Epeak  Epeak_90err_low  Epeak_90err_hi  Norm       Nomr_90err_low    Norm_90err_hi    chi2    dof
PL      -1.350     -0.317     0.312       -           -               -         5.64e-03     -1.05e-03          1.04e-03      58.820   57
CPL     -1.007     -1.511     1.378      135.411    -135.411      -135.411      8.61e-03     -3.95e-03          3.74e-02      58.550   56


=== Fluence/Peak Flux Summary ===

              Model    Band1     Band2     Band3     Band4     Band5     Total
                       15-25     25-50    50-100    100-350    15-150    15-350    keV
Fluence         PL   5.85e-08  1.14e-07  1.72e-07  5.61e-07  4.82e-07  9.04e-07   erg/cm2
      90%_error_low -1.01e-08 -1.29e-08 -2.71e-08 -1.64e-07 -6.54e-08 -1.91e-07   erg/cm2
      90%_error_hi   1.05e-08  1.28e-08  2.73e-08  2.08e-07  6.71e-08  2.28e-07   erg/cm2
Peak flux       PL   2.01e-01  2.21e-01  1.74e-01  2.24e-01  6.79e-01  8.20e-01   ph/cm2/s
      90%_error_low -5.66e-02 -4.04e-02 -4.15e-02 -9.29e-02 -1.18e-01 -1.56e-01   ph/cm2/s
      90%_error_hi   6.04e-02  4.00e-02  4.14e-02  1.29e-01  1.18e-01  1.65e-01   ph/cm2/s

Fluence        CPL   5.16e-08  1.28e-07  1.70e-07  1.18e-07  4.24e-07  4.68e-07   erg/cm2
      90%_error_low -1.21e-08 -1.74e-08 -3.28e-08 -7.88e-08 -7.21e-08 -1.07e-07   erg/cm2
      90%_error_hi   1.21e-08  1.81e-08  3.14e-08  2.74e-07  7.94e-08  2.78e-07   erg/cm2
Peak flux      CPL   1.92e-01  2.30e-01  1.76e-01  1.40e-01  6.68e-01  7.38e-01   ph/cm2/s
      90%_error_low -6.54e-02 -4.67e-02 -4.37e-02 -1.40e-01 -1.24e-01 -1.76e-01   ph/cm2/s
      90%_error_hi   6.31e-02  5.12e-02  4.51e-02  1.09e-01  1.22e-01  1.89e-01   ph/cm2/s

======================================================================
Image
Pre-slew 15.0-350.0 keV image (Event data)
#   RAcent    DECcent   POSerr    Theta     Phi              Peak Cts       SNR   Name
  181.5234    40.1474   0.0116    10.5903   -65.8286         0.6712004     16.580 TRIG_00275119

Foreground time interval of the image:
 -4.552  10.821 (delta_t =  15.373 [sec])
Background time interval of the image:
-239.280  -4.552 (delta_t = 234.728 [sec])
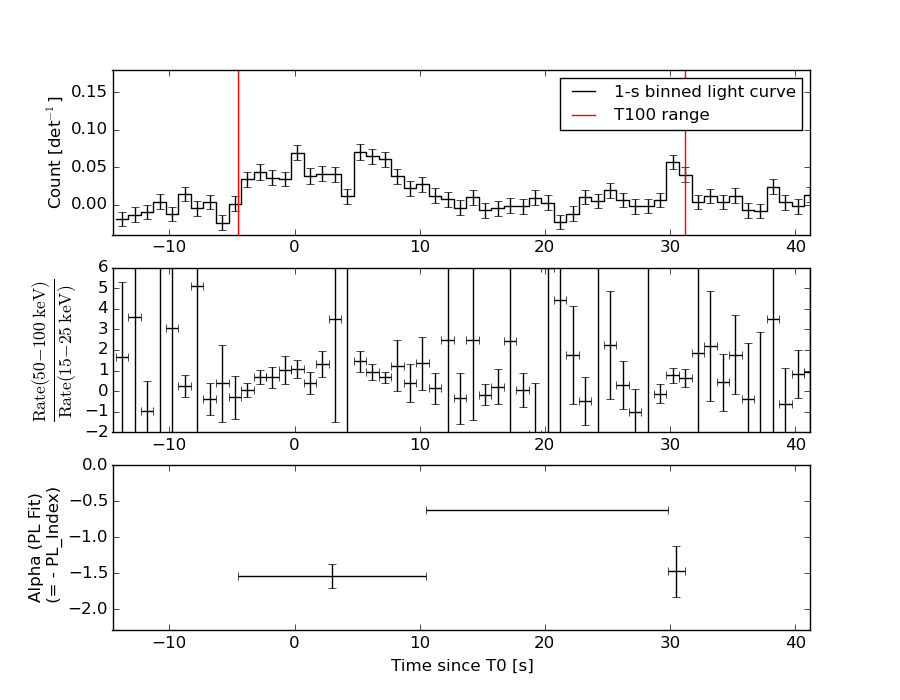
Light Curves
Note: The mask-weighted lightcurves have units of either count/det or counts/sec/det, where a det is 0.4 x 0.4 = 0.16 sq cm.
Full-time range; 1 s binning
Other quick-look light curves:
- 64 ms binning (zoomed)
- 16 ms binning (zoomed)
- 8 ms binning (zoomed)
- 2 ms binning (zoomed)
- SN=5 or 10 s binning (full-time range)
- Raw light curve
Spectra
- 64 ms binning (zoomed)
- 16 ms binning (zoomed)
- 8 ms binning (zoomed)
- 2 ms binning (zoomed)
- SN=5 or 10 s binning (full-time range)
- Raw light curve
Spectra
Notes:
- 1) The fitting includes the systematic errors.
- 2) When the burst includes telescope slew time periods, the fitting uses an average response file made from multiple 5-s response files through out the slew time plus single time preiod for the non-slew times, and weighted by the total counts in the corresponding time period using addrmf. An average response file is needed becuase a spectral fit using the pre-slew DRM will introduce some errors in both a spectral shape and a normalization if the PHA file contains a lot of the slew/post-slew time interval.
- 3) For fits to more complicated models (e.g. a power-law over a cutoff power-law), the BAT team has decided to require a chi-square improvement of more than 6 for each extra dof.
Time averaged spectrum fit using the average DRM
Power-law model

Time interval is from   -4.552 sec. to   31.188 sec.

Spectral model in power-law:
------------------------------------------------------------
Parameters  : value       lower 90%   higher 90%
Photon index: -1.40725     ( -0.194169   0.19183 )
Norm@50keV  : 1.39783E-03    ( -0.000167289   0.000165608 )
------------------------------------------------------------
#Fit statistic : Chi-Squared =          67.29 using 59 PHA bins.
# Reduced chi-squared =          1.180 for     57 degrees of freedom
# Null hypothesis probability =   1.653768e-01

Photon flux (15-150 keV)    in 35.74 sec: 0.170514 ( -0.018975  0.018976 ) ph/cm2/s
Energy fluence (15-150 keV)             : 4.82075e-07 ( -6.54224e-08  6.7054e-08 ) ergs/cm2
Cutoff power-law model
Time interval is from   -4.552 sec. to   31.188 sec.
Spectral model in the cutoff power-law:
------------------------------------------------------------
Parameters  : value       lower 90%   higher 90%
Photon index: -0.339956     ( -0.870656   1.07681 )
Epeak [keV] : 69.9283      ( -16.6539 103.328 )
Norm@50keV  : 5.33913E-03    ( -0.00533913   0.0147595 )
------------------------------------------------------------
#Fit statistic : Chi-Squared =          62.76 using 59 PHA bins.
# Reduced chi-squared =          1.121 for     56 degrees of freedom
# Null hypothesis probability =   2.492002e-01

Photon flux (15-150 keV)    in 35.74 sec: 0.162111 ( -0.019943  0.020076 ) ph/cm2/s
Energy fluence (15-150 keV)             : 4.24037e-07 ( -7.20518e-08  7.94339e-08 ) ergs/cm2
1-s peak spectrum fit
Power-law model
Time interval is from    5.320 sec. to    6.320 sec.

Spectral model in power-law:
------------------------------------------------------------
Parameters  : value       lower 90%   higher 90%
Photon index: -1.35043     ( -0.316653   0.312093 )
Norm@50keV  : 5.63928E-03    ( -0.00105324   0.0010351 )
------------------------------------------------------------
#Fit statistic : Chi-Squared =          58.82 using 59 PHA bins.
# Reduced chi-squared =          1.032 for     57 degrees of freedom
# Null hypothesis probability =   4.087139e-01

Photon flux (15-150 keV)    in 1 sec: 0.679441 ( -0.118449  0.11845 ) ph/cm2/s
Energy fluence (15-150 keV)             : 5.50795e-08 ( -1.17574e-08  1.21903e-08 ) ergs/cm2
Cutoff power-law model
Time interval is from    5.320 sec. to    6.320 sec.
Spectral model in the cutoff power-law:
------------------------------------------------------------
Parameters  : value       lower 90%   higher 90%
Photon index: -1.00667     ( -1.51052   1.37837 )
Epeak [keV] : 135.411      ( -135.411 -135.411 )
Norm@50keV  : 8.60857E-03    ( -0.00395471   0.0373698 )
------------------------------------------------------------
#Fit statistic : Chi-Squared =          58.55 using 59 PHA bins.
# Reduced chi-squared =          1.045 for     56 degrees of freedom
# Null hypothesis probability =   3.821214e-01

Photon flux (15-150 keV)    in 1 sec: 0.668498 ( -0.123607  0.121963 ) ph/cm2/s
Energy fluence (15-150 keV)             : 5.28628e-08 ( -1.35304e-08  1.37442e-08 ) ergs/cm2
Time-resolved spectra
Distribution
T90 vs. Hardness ratio plot
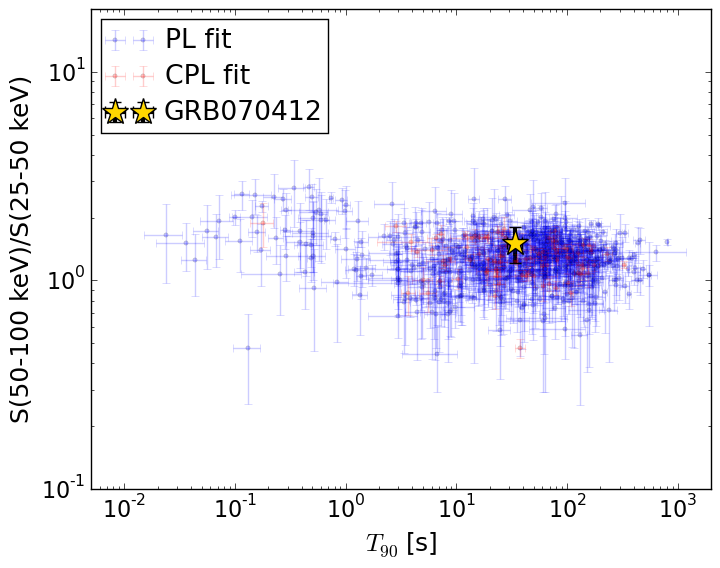
T90                                   = 33.876 sec.
Hardness ratio (energy fluence ratio) = 1.50816992746
S(15-50 keV) vs. S(50-150 keV) plot
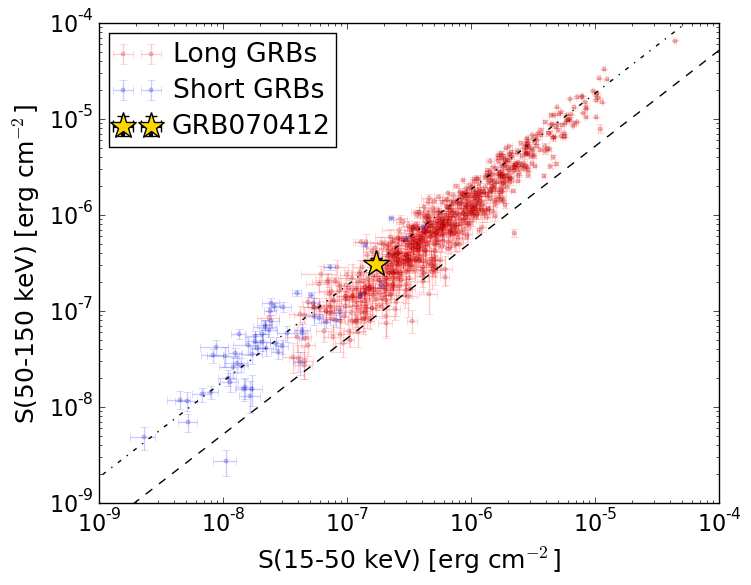
S(15-50 keV)  = 1.7222395e-07
S(50-150 keV) = 3.098596e-07
The dash-dotted line and the dashed line traces the fluences calculated from the Band function with Epeak = 15 and 150 keV, respectively. Both lines assume a canonical values of alpha = -1 and beta = -2.5.
Mask shadow pattern
IMX = 7.655770389769587E-02, IMY = 1.705764847002052E-01
Spacecraft aspect plot
Bright source in the pre-burst/pre-slew/post-slew images
Pre-burst image of 15-350 keV band
Time interval of the image:
-239.280000 -4.552000

# RAcent  DECcent POSerr Theta    Phi  PeakCts   SNR AngSep     Name
#  [deg]    [deg]    ['] [deg]  [deg]                   [']
160.8195   2.6073    2.5  35.4  171.1   1.1118   4.6 ------	UNKNOWN
138.3684  -6.0655    2.5  57.0 -174.2   4.6316   4.6 ------	UNKNOWN
237.7695  72.9272    3.5  51.1  -35.4   2.2458   3.3 ------	UNKNOWN
136.8836  51.0649    3.3  41.1  -98.0   3.7912   3.5 ------	UNKNOWN
Pre-slew background subtracted image of 15-350 keV band
Time interval of the image:
-4.552000 10.820590

# RAcent  DECcent POSerr Theta    Phi  PeakCts   SNR AngSep     Name
#  [deg]    [deg]    ['] [deg]  [deg]                   [']
181.5234  40.1475    0.7  10.6  -65.8   0.6713  16.6 ------	UNKNOWN
143.2708  27.6079    2.2  36.1 -136.1   0.3074   5.2 ------	UNKNOWN
139.3017  53.9833    2.1  40.4  -93.1   0.8930   5.4 ------	UNKNOWN
Post-slew image of 15-350 keV band
Time interval of the image:
49.620590 75.911100
76.720000 123.420600

# RAcent  DECcent POSerr Theta    Phi  PeakCts   SNR AngSep     Name
#  [deg]    [deg]    ['] [deg]  [deg]                   [']
254.3765  35.4599    4.6  56.1    3.4   1.2762   2.5    8.1	Her X-1
119.6496  14.4203    2.6  59.4 -163.1   2.7128   4.4 ------	UNKNOWN
125.5980  31.4649    2.5  45.4 -148.8   0.8041   4.5 ------	UNKNOWN