Analysis Summary
Notes:
- 1) No attempt has been made to eliminate the non-significant decimal places.
- 2) This batgrbproduct analysis is done using the HEASARC data.
- 3) This batgrbproduct analysis is using the flight position for the mask-weighting calculation.
======================================================================
                  BAT GRB EVENT DATA PROCESSING REPORT
    Process Script Ver: batgrbproduct v2.46
    Process Start Time: Mon Jan 20 10:38:47 EST 2014
             Host Name: batevent1
   Current Working Dir: /local/data/batevent/batevent_reproc/trigger276205
======================================================================

  Trigger: 00276205      Segment: 000

  BAT Trigger Time: 198669568   [s; MET]
      Trigger Stop: 198669632   [s; MET]
               UTC: 2007-04-19T09:59:26.099880    [includes UTCF correction]
       Where From?: TDRSS position message

  BAT
    RA: 182.714045406784   Dec: 39.908351699379  [deg; J2000]

     Catalogged Source?: NO
     Point Source?:      YES
     GRB Indicated?:     YES    [ by BAT flight software ]
     Image S/N Ratio:    10.8
     Image Trigger?:     YES
     Rate S/N Ratio:     0  [ if not an image trigger ]
     Image S/N Ratio:    10.8

  Analysis Position:   [ source = BAT ]
    RA: 182.714045406784   Dec: 39.908351699379  [deg; J2000]

  Refined Position:   [ source = BAT pre-slew burst ]
    RA: 182.751768813539   Dec: 39.8992224189556  [deg; J2000]
        { 12h 11m 00.4s , +39d 53' 57.2" }
         +/- 2.34769878819012 [arcmin] (estimated 90% radius based on SNR)
         +/- 1.14157964187767 [arcmin] (formal 1-sigma fit error)
    SNR: 8.98730067972945

  Angular difference between the analysis and refined position is 1.820661 arcmin

  Partial Coding Fraction: 1    [ including projection effects ]

  Duration
     T90: 160 +/- 50.5964425626941
        Measured from: -31
                   to: 129     [s; relative to TRIGTIME]
     T50: 80 +/- 22.6274169979695
        Measured from: 1
                   to: 81     [s; relative to TRIGTIME]


  Fluence
     Peak Flux  (peak 1 second)
        Measured from: 24.5
                   to: 25.5     [s; relative to TRIGTIME]
     Total Fluence
        Measured from: -31
                   to: 161     [s; relative to TRIGTIME]

             Band 1     Band 2     Band 3     Band 4
              15-25      25-50     50-100    100-350     keV
 Total     0.654622   0.620752   0.136435   0.122572
           0.059748   0.061548   0.053718   0.046285 [error]
 Peak      0.008659  -0.000812  -0.000703  -0.002258
           0.004296   0.004488   0.003841   0.003277 [error]

     [ fluence units of on-axis counts / fully illuminated detector ]

======================================================================


====== Table of the duration information =============================

        Value   tstart    tstop
T100  192.000  -31.000  161.000
T90   160.000  -31.000  129.000
T50    80.000    1.000   81.000
Peak    1.000   24.500   25.500


====== Spectral Analysis Summary =====================================

Model      : spectral model: simple power-law (PL) and cutoff power-law (CPL)
Ph_index   : photon index: E^{Ph_index}
Ph_90err   : 90% error of the photon index
Epeak      : Epeak in keV
Epeak_90err: 90% error of Epeak
Norm       : normalization at 50 keV in both the PL model and CPL model
Nomr_90err : 90% error of the normalization
chi2       : Chi-Squared
dof        : degree of freedo

=== Time-averaged spectral analysis ===
(Best model with acceptable fit: PL)

Model Ph_index Ph_90err_low Ph_90err_hi  Epeak  Epeak_90err_low  Epeak_90err_hi  Norm       Nomr_90err_low    Norm_90err_hi    chi2    dof
PL      -2.372    -0.257      0.234       -           -               -         3.58e-04     -6.80e-05          6.75e-05      45.980   57
CPL     -0.839    -1.070      1.553       26.477     -22.416         7.141      3.43e-03     -3.43e-03          3.14e-02      41.380   56


=== 1-s peak spectral analysis ===
(Best model with acceptable fit: N/A)

Model Ph_index Ph_90err_low Ph_90err_hi  Epeak  Epeak_90err_low  Epeak_90err_hi  Norm       Nomr_90err_low    Norm_90err_hi    chi2    dof
PL      -4.286      4.286     4.286       -           -               -         7.01e-05     -7.01e-05          6.59e-04      65.800   57
CPL     -1.224     -1.317     1.224        4.920       4.751        20.865      3.19e-02     -3.19e-02          1.50e+11      65.410   56


=== Fluence/Peak Flux Summary ===

              Model    Band1     Band2     Band3     Band4     Band5     Total
                       15-25     25-50    50-100    100-350    15-150    15-350    keV
Fluence         PL   2.01e-07  2.18e-07  1.68e-07  2.13e-07  6.67e-07  8.00e-07   erg/cm2
      90%_error_low -2.83e-08 -2.88e-08 -4.17e-08 -8.56e-08 -9.87e-08 -1.51e-07   erg/cm2
      90%_error_hi   2.86e-08  2.83e-08  4.49e-08  1.19e-07  1.03e-07  1.76e-07   erg/cm2
Peak flux       PL   4.56e-02  9.55e-03  1.00e-03  1.16e-04  5.62e-02  5.63e-02   ph/cm2/s
      90%_error_low -4.56e-02 -9.55e-03 -1.00e-03 -1.16e-04 -5.62e-02 -5.63e-02   ph/cm2/s
      90%_error_hi   5.72e-02  3.11e-02  1.78e-02  1.37e-01  8.40e-02  8.48e-02   ph/cm2/s

Fluence        CPL   1.90e-07  2.52e-07  1.25e-07  1.73e-08  5.82e-07  5.84e-07   erg/cm2
      90%_error_low -3.18e-08 -3.97e-08 -5.29e-08 -1.52e-08 -8.89e-08 -9.07e-08   erg/cm2
      90%_error_hi   3.12e-08  4.06e-08  5.95e-08  9.68e-08  1.09e-07  1.41e-07   erg/cm2
Peak flux      CPL     N/A      N/A      N/A      N/A      N/A      N/A     ph/cm2/s
      90%_error_low -4.56e-02 -9.55e-03 -1.00e-03 -1.16e-04 -5.62e-02 -5.63e-02   ph/cm2/s
      90%_error_hi   5.72e-02  3.11e-02  1.78e-02  1.37e-01  8.40e-02  8.48e-02   ph/cm2/s

======================================================================
Image
Pre-slew 15.0-350.0 keV image (Event data)
#   RAcent    DECcent   POSerr    Theta     Phi              Peak Cts       SNR   Name
  182.7518    39.8992   0.0214     0.9662    32.4700         0.9193433      8.987 TRIG_00276205

Foreground time interval of the image:
-31.000  73.301 (delta_t = 104.301 [sec])
Background time interval of the image:
-239.000 -31.000 (delta_t = 208.000 [sec])
Light Curves
Note: The mask-weighted lightcurves have units of either count/det or counts/sec/det, where a det is 0.4 x 0.4 = 0.16 sq cm.
Full-time range; 1 s binning
Other quick-look light curves:
- 64 ms binning (zoomed)
- 16 ms binning (zoomed)
- 8 ms binning (zoomed)
- 2 ms binning (zoomed)
- SN=5 or 10 s binning (full-time range)
- Raw light curve
Spectra
- 64 ms binning (zoomed)
- 16 ms binning (zoomed)
- 8 ms binning (zoomed)
- 2 ms binning (zoomed)
- SN=5 or 10 s binning (full-time range)
- Raw light curve
Spectra
Notes:
- 1) The fitting includes the systematic errors.
- 2) When the burst includes telescope slew time periods, the fitting uses an average response file made from multiple 5-s response files through out the slew time plus single time preiod for the non-slew times, and weighted by the total counts in the corresponding time period using addrmf. An average response file is needed becuase a spectral fit using the pre-slew DRM will introduce some errors in both a spectral shape and a normalization if the PHA file contains a lot of the slew/post-slew time interval.
- 3) For fits to more complicated models (e.g. a power-law over a cutoff power-law), the BAT team has decided to require a chi-square improvement of more than 6 for each extra dof.
Time averaged spectrum fit using the average DRM
Power-law model
Time interval is from  -31.000 sec. to  161.000 sec.

Spectral model in power-law:
------------------------------------------------------------
Parameters  : value       lower 90%   higher 90%
Photon index: -2.37223     ( -0.257175   0.234206 )
Norm@50keV  : 3.58289E-04    ( -6.79785e-05   6.75317e-05 )
------------------------------------------------------------
#Fit statistic : Chi-Squared =          45.98 using 59 PHA bins.
# Reduced chi-squared =         0.8066 for     57 degrees of freedom
# Null hypothesis probability =   8.517643e-01

Photon flux (15-150 keV)    in 192 sec: 6.52388E-02 ( -0.0075359  0.0075385 ) ph/cm2/s
Energy fluence (15-150 keV)             : 6.67085e-07 ( -9.86886e-08  1.02863e-07 ) ergs/cm2
Cutoff power-law model

Time interval is from  -31.000 sec. to  161.000 sec.
Spectral model in the cutoff power-law:
------------------------------------------------------------
Parameters  : value       lower 90%   higher 90%
Photon index: -0.838958     ( -1.06958   1.55344 )
Epeak [keV] : 26.4772      ( -22.4162 7.14064 )
Norm@50keV  : 3.42794E-03    ( -0.00342796   0.0313621 )
------------------------------------------------------------
#Fit statistic : Chi-Squared =          41.38 using 59 PHA bins.
# Reduced chi-squared =         0.7389 for     56 degrees of freedom
# Null hypothesis probability =   9.278647e-01

Photon flux (15-150 keV)    in 192 sec: 6.27316E-02 ( -0.007536  0.0076213 ) ph/cm2/s
Energy fluence (15-150 keV)             : 5.81931e-07 ( -8.89033e-08  1.08533e-07 ) ergs/cm2
1-s peak spectrum fit
Power-law model
Time interval is from   24.500 sec. to   25.500 sec.

Spectral model in power-law:
------------------------------------------------------------
Parameters  : value       lower 90%   higher 90%
Photon index: -4.28552     ( 4.26872   4.26872 )
Norm@50keV  : 7.01284E-05    ( -7.21972e-05   0.000657201 )
------------------------------------------------------------
#Fit statistic : Chi-Squared =          65.80 using 59 PHA bins.
# Reduced chi-squared =          1.154 for     57 degrees of freedom
# Null hypothesis probability =   1.984588e-01

Photon flux (15-150 keV)    in 1 sec: 5.62100E-02 ( -0.05621  0.08399 ) ph/cm2/s
Energy fluence (15-150 keV)             : 1.95907e-09 ( 1  4.82203e-09 ) ergs/cm2
Cutoff power-law model
Time interval is from   24.500 sec. to   25.500 sec.
Spectral model in the cutoff power-law:
------------------------------------------------------------
Parameters  : value       lower 90%   higher 90%
Photon index: 9.88335     ( -12.4403   -9.9001 )
Epeak [keV] : 16.6096      ( -6.96989 9.14447 )
Norm@50keV  : 9.30265E+07    ( -9.98428e+07   1.50181e+11 )
------------------------------------------------------------
#Fit statistic : Chi-Squared =          64.40 using 59 PHA bins.
# Reduced chi-squared =          1.150 for     56 degrees of freedom
# Null hypothesis probability =   2.063162e-01

Photon flux (15-150 keV)    in 1 sec:  (    ) ph/cm2/s
Energy fluence (15-150 keV)             : 1.81895e-09 ( 0  0 ) ergs/cm2
Time-resolved spectra
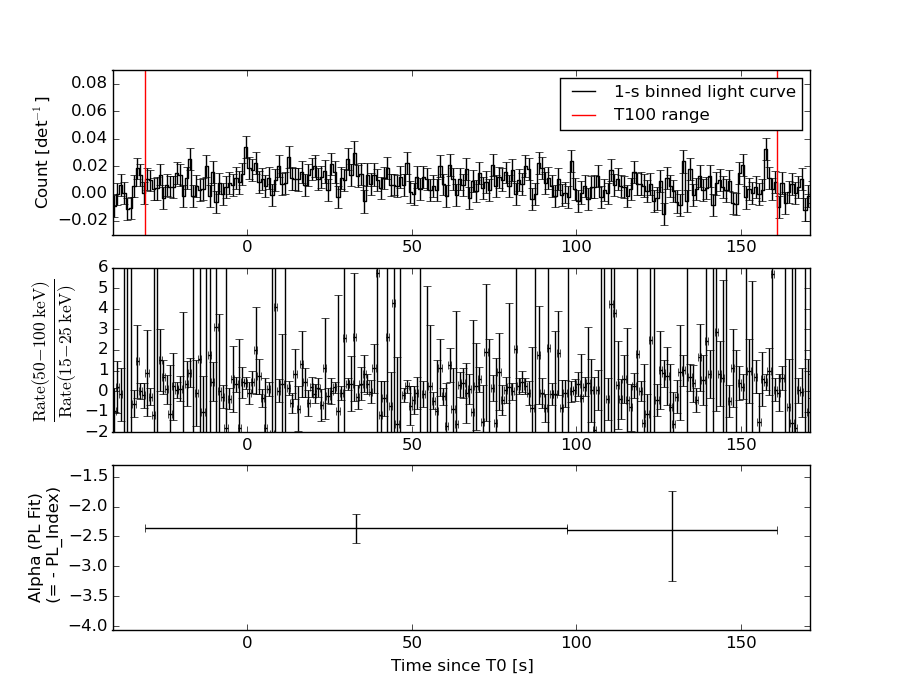
Distribution
T90 vs. Hardness ratio plot
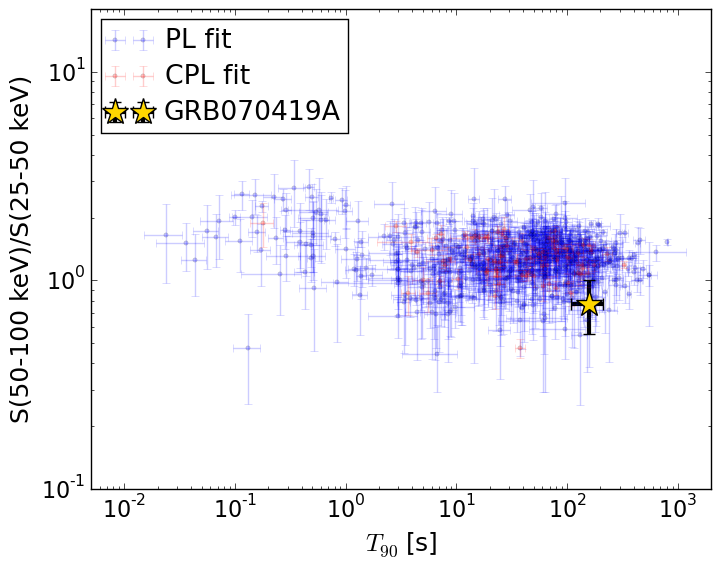
T90                                   = 160.0 sec.
Hardness ratio (energy fluence ratio) = 0.772645565606
S(15-50 keV) vs. S(50-150 keV) plot
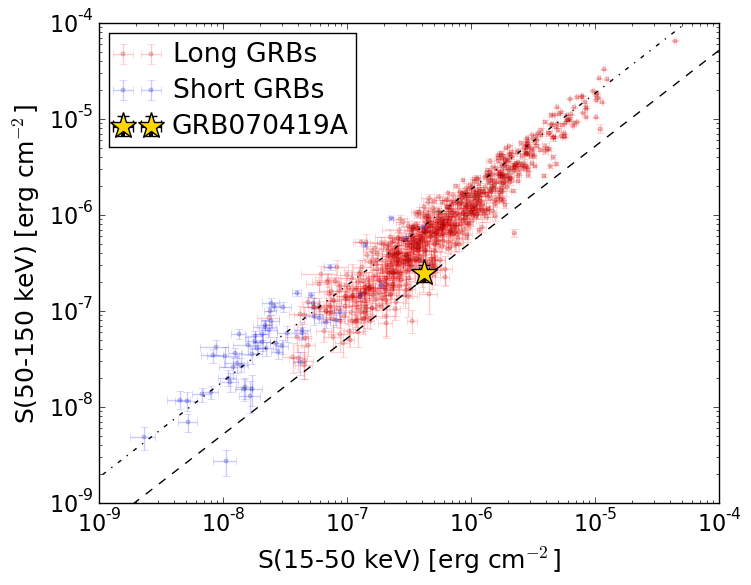
S(15-50 keV)  = 4.185995e-07
S(50-150 keV) = 2.4849408e-07
The dash-dotted line and the dashed line traces the fluences calculated from the Band function with Epeak = 15 and 150 keV, respectively. Both lines assume a canonical values of alpha = -1 and beta = -2.5.
Mask shadow pattern
IMX = 1.422897493336409E-02, IMY = -9.054389744997844E-03
Spacecraft aspect plot
Bright source in the pre-burst/pre-slew/post-slew images
Pre-burst image of 15-350 keV band
Time interval of the image:
-239.000000 -31.000000

# RAcent  DECcent POSerr Theta    Phi  PeakCts   SNR AngSep     Name
#  [deg]    [deg]    ['] [deg]  [deg]                   [']
254.4573  35.3424 1798.5  56.2    0.2  -0.0039  -0.0    0.0	Her X-1
217.6885  12.4208    2.6  42.1   51.3   1.9539   4.4 ------	UNKNOWN
242.9656  32.0034    2.9  49.4    9.6   1.3726   4.0 ------	UNKNOWN
176.4351  78.7044    3.3  38.7  -71.1   1.2200   3.5 ------	UNKNOWN
Pre-slew background subtracted image of 15-350 keV band
Time interval of the image:
-31.000000 73.300600

# RAcent  DECcent POSerr Theta    Phi  PeakCts   SNR AngSep     Name
#  [deg]    [deg]    ['] [deg]  [deg]                   [']
254.5182  35.3614    4.7  56.3    0.2   1.3725   2.4    3.2	Her X-1
209.7209   7.7480    2.3  41.0   65.0   2.1529   5.1 ------	UNKNOWN
135.1876   2.5694    2.2  56.2  170.9   3.1040   5.3 ------	UNKNOWN
254.0483  32.8781    2.0  57.1    3.0   3.8686   5.7 ------	UNKNOWN
161.2271  27.3658    2.5  21.1  169.5   0.4567   4.6 ------	UNKNOWN
182.7519  39.8992    1.3   1.0   32.5   0.9187   9.0 ------	UNKNOWN
215.4759  51.1450    1.9  25.9  -16.1   0.6630   6.1 ------	UNKNOWN
262.5296  45.2343    2.2  57.2  -13.7   2.4576   5.3 ------	UNKNOWN
Post-slew image of 15-350 keV band
Time interval of the image:
95.100610 963.052400

# RAcent  DECcent POSerr Theta    Phi  PeakCts   SNR AngSep     Name
#  [deg]    [deg]    ['] [deg]  [deg]                   [']
254.5011  35.4243    5.9  55.4    9.2   4.2309   1.9    5.4	Her X-1
217.7200  43.6390    2.4  26.2    9.4   1.7860   4.7 ------	UNKNOWN
124.0158  62.1392    4.7  41.1  -98.2   6.4589   2.5 ------	UNKNOWN