Analysis Summary
Notes:
- 1) No attempt has been made to eliminate the non-significant decimal places.
- 2) This batgrbproduct analysis is done using the HEASARC data.
- 3) This batgrbproduct analysis is using the flight position for the mask-weighting calculation.
======================================================================
BAT GRB EVENT DATA PROCESSING REPORT
Process Script Ver: batgrbproduct v2.46
Process Start Time: Sat May 9 19:28:51 EDT 2015
Host Name: bat1
Current Working Dir: /local/data/bat1/alien/Swift_3rdBATcatalog/event/batevent_reproc/trigger276321
======================================================================
Trigger: 00276321 Segment: 000
BAT Trigger Time: 198742695.424 [s; MET]
Trigger Stop: 198742697.472 [s; MET]
UTC: 2007-04-20T06:18:13.522060 [includes UTCF correction]
Where From?: TDRSS position message
BAT
RA: 121.252999205293 Dec: -45.5608340567608 [deg; J2000]
Catalogged Source?: NO
Point Source?: YES
GRB Indicated?: YES [ by BAT flight software ]
Image S/N Ratio: 10.94
Image Trigger?: NO
Rate S/N Ratio: 23.9374184071716 [ if not an image trigger ]
Image S/N Ratio: 10.94
Analysis Position: [ source = BAT ]
RA: 121.252999205293 Dec: -45.5608340567608 [deg; J2000]
Refined Position: [ source = BAT pre-slew burst ]
RA: 121.245009841409 Dec: -45.5633398546012 [deg; J2000]
{ 08h 04m 58.8s , -45d 33' 48.0" }
+/- 0.966693095300314 [arcmin] (estimated 90% radius based on SNR)
+/- 0.375880054179613 [arcmin] (formal 1-sigma fit error)
SNR: 31.9252746370189
Angular difference between the analysis and refined position is 0.367756 arcmin
Partial Coding Fraction: 0.08398438 [ including projection effects ]
Duration
T90: 77.0240000188351 +/- 5.46696844651107
Measured from: -23.2039999961853
to: 53.8200000226498 [s; relative to TRIGTIME]
T50: 19.3120000064373 +/- 1.82200331459623
Measured from: -5.5799999833107
to: 13.7320000231266 [s; relative to TRIGTIME]
Fluence
Peak Flux (peak 1 second)
Measured from: 1.4040000140667
to: 2.4040000140667 [s; relative to TRIGTIME]
Total Fluence
Measured from: -29.136000007391
to: 100.275999993086 [s; relative to TRIGTIME]
Band 1 Band 2 Band 3 Band 4
15-25 25-50 50-100 100-350 keV
Total 4.598422 7.582140 6.632324 1.688097
0.163760 0.181227 0.164579 0.133979 [error]
Peak 0.166879 0.287835 0.270190 0.099243
0.022818 0.028462 0.026255 0.019215 [error]
[ fluence units of on-axis counts / fully illuminated detector ]
======================================================================
====== Table of the duration information =============================
Value tstart tstop
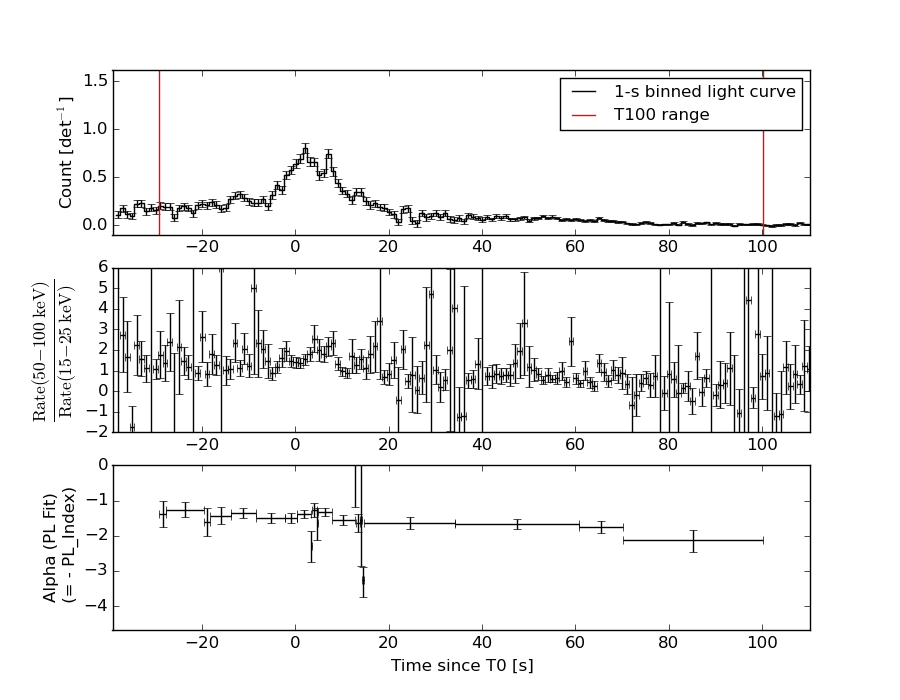
T100 129.412 -29.136 100.276
T90 77.024 -23.204 53.820
T50 19.312 -5.580 13.732
Peak 1.000 1.404 2.404
====== Spectral Analysis Summary =====================================
Model : spectral model: simple power-law (PL) and cutoff power-law (CPL)
Ph_index : photon index: E^{Ph_index}
Ph_90err : 90% error of the photon index
Epeak : Epeak in keV
Epeak_90err: 90% error of Epeak
Norm : normalization at 50 keV in both the PL model and CPL model
Nomr_90err : 90% error of the normalization
chi2 : Chi-Squared
dof : degree of freedo
=== Time-averaged spectral analysis ===
(Best model with acceptable fit: CPL)
Model Ph_index Ph_90err_low Ph_90err_hi Epeak Epeak_90err_low Epeak_90err_hi Norm Nomr_90err_low Norm_90err_hi chi2 dof
PL -1.507 -0.051 0.051 - - - 1.18e-02 -3.33e-04 3.32e-04 53.740 57
CPL -1.132 -0.207 0.217 130.335 -28.096 87.445 1.74e-02 -3.28e-03 4.25e-03 43.910 56
=== 1-s peak spectral analysis ===
(Best model with acceptable fit: PL)
Model Ph_index Ph_90err_low Ph_90err_hi Epeak Epeak_90err_low Epeak_90err_hi Norm Nomr_90err_low Norm_90err_hi chi2 dof
PL -1.395 -0.169 0.169 - - - 5.80e-02 -5.87e-03 5.86e-03 50.820 57
CPL -1.009 -0.471 0.761 138.510 N/A N/A 8.89e-02 N/A N/A 49.850 56
=== Fluence/Peak Flux Summary ===
Model Band1 Band2 Band3 Band4 Band5 Total
15-25 25-50 50-100 100-350 15-150 15-350 keV
Fluence PL 1.96e-06 3.59e-06 5.05e-06 1.49e-05 1.45e-05 2.55e-05 erg/cm2
90%_error_low -1.08e-07 -1.19e-07 -1.69e-07 -1.10e-06 -4.22e-07 -1.19e-06 erg/cm2
90%_error_hi 1.11e-07 1.18e-07 1.69e-07 1.15e-06 4.23e-07 1.24e-06 erg/cm2
Peak flux PL 2.16e+00 2.31e+00 1.76e+00 2.18e+00 7.06e+00 8.42e+00 ph/cm2/s
90%_error_low -3.84e-01 -2.65e-01 -2.11e-01 -4.94e-01 -7.41e-01 -8.58e-01 ph/cm2/s
90%_error_hi 4.06e-01 2.62e-01 2.09e-01 5.70e-01 7.42e-01 8.62e-01 ph/cm2/s
Fluence CPL 1.78e-06 3.67e-06 5.24e-06 9.53e-06 1.42e-05 2.02e-05 erg/cm2
90%_error_low -1.39e-07 -1.29e-07 -1.99e-07 -1.96e-06 -4.51e-07 -1.99e-06 erg/cm2
90%_error_hi 1.43e-07 1.29e-07 2.01e-07 2.60e-06 4.50e-07 2.59e-06 erg/cm2
Peak flux CPL 1.99e+00 2.39e+00 1.84e+00 1.49e+00 6.97e+00 7.71e+00 ph/cm2/s
90%_error_low -4.74e-01 -2.97e-01 -2.53e-01 -7.04e-01 -7.60e-01 -1.08e+00 ph/cm2/s
90%_error_hi 4.78e-01 3.06e-01 2.59e-01 8.83e-01 7.60e-01 1.24e+00 ph/cm2/s
======================================================================
Image
Pre-slew 15.0-350.0 keV image (Event data)
#   RAcent    DECcent   POSerr    Theta     Phi              Peak Cts       SNR   Name
  121.2450   -45.5633   0.0060    48.2831   146.8139        17.2951050     31.925 TRIG_00276321

Foreground time interval of the image:
-29.136  23.677 (delta_t =  52.813 [sec])
Background time interval of the image:
-239.424 -29.136 (delta_t = 210.288 [sec])
Light Curves
Note: The mask-weighted lightcurves have units of either count/det or counts/sec/det, where a det is 0.4 x 0.4 = 0.16 sq cm.
Full-time range; 1 s binning
Other quick-look light curves:
- 64 ms binning (zoomed)
- 16 ms binning (zoomed)
- 8 ms binning (zoomed)
- 2 ms binning (zoomed)
- SN=5 or 10 s binning (full-time range)
- Raw light curve
Spectra
- 64 ms binning (zoomed)
- 16 ms binning (zoomed)
- 8 ms binning (zoomed)
- 2 ms binning (zoomed)
- SN=5 or 10 s binning (full-time range)
- Raw light curve
Spectra
Notes:
- 1) The fitting includes the systematic errors.
- 2) When the burst includes telescope slew time periods, the fitting uses an average response file made from multiple 5-s response files through out the slew time plus single time preiod for the non-slew times, and weighted by the total counts in the corresponding time period using addrmf. An average response file is needed becuase a spectral fit using the pre-slew DRM will introduce some errors in both a spectral shape and a normalization if the PHA file contains a lot of the slew/post-slew time interval.
- 3) For fits to more complicated models (e.g. a power-law over a cutoff power-law), the BAT team has decided to require a chi-square improvement of more than 6 for each extra dof.
Time averaged spectrum fit using the average DRM
Power-law model
Time interval is from  -29.136 sec. to  100.276 sec.

Spectral model in power-law:
------------------------------------------------------------
Parameters  : value       lower 90%   higher 90%
Photon index: -1.50698     ( -0.0509578   0.0509565 )
Norm@50keV  : 1.17873E-02    ( -0.000332415   0.000332411 )
------------------------------------------------------------
#Fit statistic : Chi-Squared =          53.74 using 59 PHA bins.
# Reduced chi-squared =         0.9428 for     57 degrees of freedom
# Null hypothesis probability =   5.981293e-01

Photon flux (15-150 keV)    in 129.4 sec: 1.47433 ( -0.04657  0.04672 ) ph/cm2/s
Energy fluence (15-150 keV)             : 1.44549e-05 ( -4.22087e-07  4.22763e-07 ) ergs/cm2
Cutoff power-law model
Time interval is from  -29.136 sec. to  100.276 sec.
Spectral model in the cutoff power-law:
------------------------------------------------------------
Parameters  : value       lower 90%   higher 90%
Photon index: -1.13231     ( -0.207276   0.216844 )
Epeak [keV] : 130.335      ( -28.0953 87.4448 )
Norm@50keV  : 1.73864E-02    ( -0.0032848   0.00424935 )
------------------------------------------------------------
#Fit statistic : Chi-Squared =          43.91 using 59 PHA bins.
# Reduced chi-squared =         0.7841 for     56 degrees of freedom
# Null hypothesis probability =   8.795263e-01

Photon flux (15-150 keV)    in 129.4 sec: 1.43706 ( -0.05026  0.05049 ) ph/cm2/s
Energy fluence (15-150 keV)             : 1.41838e-05 ( -4.51145e-07  4.49912e-07 ) ergs/cm2
1-s peak spectrum fit
Power-law model
Time interval is from    1.404 sec. to    2.404 sec.

Spectral model in power-law:
------------------------------------------------------------
Parameters  : value       lower 90%   higher 90%
Photon index: -1.39511     ( -0.169455   0.169085 )
Norm@50keV  : 5.80484E-02    ( -0.00587169   0.0058638 )
------------------------------------------------------------
#Fit statistic : Chi-Squared =          50.82 using 59 PHA bins.
# Reduced chi-squared =         0.8916 for     57 degrees of freedom
# Null hypothesis probability =   7.047841e-01

Photon flux (15-150 keV)    in 1 sec: 7.06154 ( -0.74067  0.74225 ) ph/cm2/s
Energy fluence (15-150 keV)             : 5.61539e-07 ( -6.13317e-08  6.15642e-08 ) ergs/cm2
Cutoff power-law model

Time interval is from    1.404 sec. to    2.404 sec.
Spectral model in the cutoff power-law:
------------------------------------------------------------
Parameters  : value       lower 90%   higher 90%
Photon index: -1.0093     ( -0.471311   0.760931 )
Epeak [keV] : 138.510      (   )
Norm@50keV  : 8.88551E-02    (     )
------------------------------------------------------------
#Fit statistic : Chi-Squared =          49.85 using 59 PHA bins.
# Reduced chi-squared =         0.8903 for     56 degrees of freedom
# Null hypothesis probability =   7.053055e-01

Photon flux (15-150 keV)    in 1 sec: 6.96672 ( -0.76005  0.76018 ) ph/cm2/s
Energy fluence (15-150 keV)             : 5.52548e-07 ( -6.44467e-08  6.3905e-08 ) ergs/cm2
Time-resolved spectra
Distribution
T90 vs. Hardness ratio plot
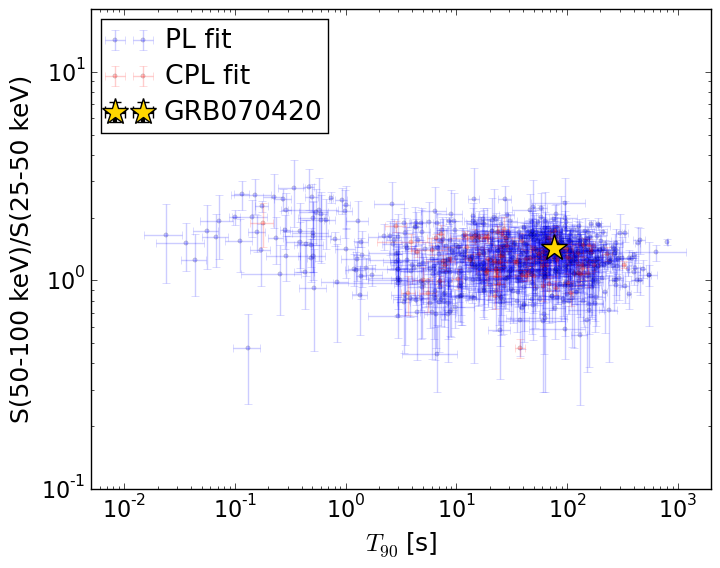
T90                                   = 77.024 sec.
Hardness ratio (energy fluence ratio) = 1.42833506066
S(15-50 keV) vs. S(50-150 keV) plot
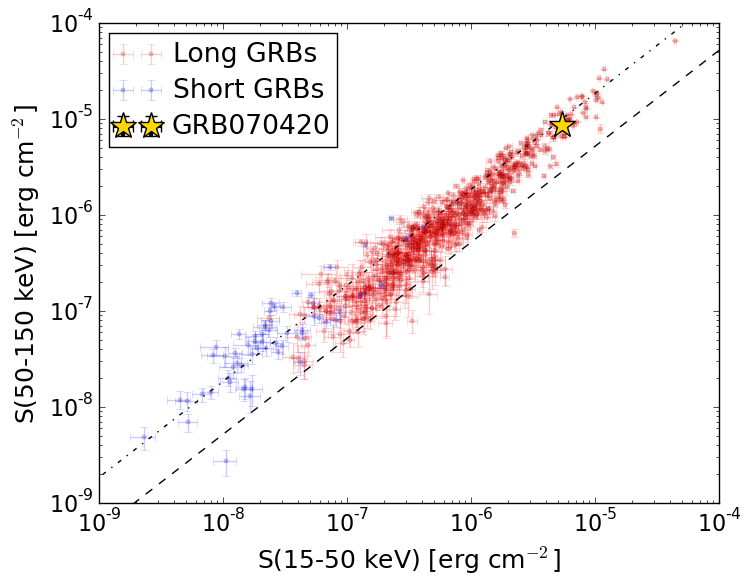
S(15-50 keV)  = 5.450371e-06
S(50-150 keV) = 8.733409e-06
The dash-dotted line and the dashed line traces the fluences calculated from the Band function with Epeak = 15 and 150 keV, respectively. Both lines assume a canonical values of alpha = -1 and beta = -2.5.
Mask shadow pattern
IMX = -9.387541668664886E-01, IMY = -6.139774823812880E-01
Spacecraft aspect plot
Bright source in the pre-burst/pre-slew/post-slew images
Pre-burst image of 15-350 keV band
Time interval of the image:
-239.424000 -29.136000

# RAcent  DECcent POSerr Theta    Phi  PeakCts   SNR AngSep     Name
#  [deg]    [deg]    ['] [deg]  [deg]                   [']
 83.6244  22.0166    0.3  31.1  -66.2   8.3941  36.7    0.5	Crab
142.0229  30.1576    2.5  43.9   25.1   1.4176   4.7 ------	UNKNOWN
113.1446 -12.5408    2.3  14.8  137.1   0.7075   5.0 ------	UNKNOWN
 85.5940 -49.7674    2.8  54.2  177.0   2.2606   4.1 ------	UNKNOWN
 67.9574 -24.4639    2.4  45.9 -146.7   1.6338   4.8 ------	UNKNOWN
 63.7116  -3.4825    3.3  43.8 -116.3   2.2696   3.5 ------	UNKNOWN
 77.6108  41.4706    3.2  48.4  -49.9   2.5549   3.6 ------	UNKNOWN
 69.0037  17.3697    2.9  41.0  -84.5   2.7205   3.9 ------	UNKNOWN
Pre-slew background subtracted image of 15-350 keV band
Time interval of the image:
-29.136000 23.676600

# RAcent  DECcent POSerr Theta    Phi  PeakCts   SNR AngSep     Name
#  [deg]    [deg]    ['] [deg]  [deg]                   [']
 83.6178  22.0160    7.6  31.1  -66.2   0.1715   1.5    0.9	Crab
121.2450 -45.5634    0.4  48.3  146.8  17.2891  31.9 ------	UNKNOWN
107.9475  -0.6480    2.4   1.9  139.9   0.4187   4.7 ------	UNKNOWN
 66.9577 -42.2312    2.4  56.6 -165.1   1.8282   4.8 ------	UNKNOWN
 60.6744 -15.1875    2.2  48.9 -131.5   1.8230   5.3 ------	UNKNOWN
 61.9379 -10.0652    3.0  46.5 -125.2   1.3584   3.8 ------	UNKNOWN
 62.5896  -7.2607    2.3  45.4 -121.5   1.7427   5.1 ------	UNKNOWN
Post-slew image of 15-350 keV band
Time interval of the image:
87.876580 962.606000

# RAcent  DECcent POSerr Theta    Phi  PeakCts   SNR AngSep     Name
#  [deg]    [deg]    ['] [deg]  [deg]                   [']
135.5317 -40.5605    0.5  11.6   64.0   8.6361  22.3    0.4	Vela X-1
170.2031 -60.6321    4.1  32.1  130.3   1.6949   2.8    3.4	Cen X-3
186.6571 -62.8135    3.0  39.8  134.0   3.6663   3.8    2.6	GX 301-2
202.3188 -64.5201    2.9  46.3  138.5   6.1138   4.1 ------	UNKNOWN
204.7562 -70.7743    1.9  45.6  147.2   7.6893   6.2 ------	UNKNOWN
120.2109 -23.8568    4.4  21.7   -8.0   0.9473   2.6 ------	UNKNOWN
108.0531 -66.5327    2.4  22.1 -171.6   1.9276   4.8 ------	UNKNOWN
102.3352  -5.8633    3.8  42.9  -33.7   2.0915   3.0 ------	UNKNOWN
 75.5074 -26.2478    3.2  41.0  -83.5   8.5032   3.6 ------	UNKNOWN