Analysis Summary
Notes:
- 1) No attempt has been made to eliminate the non-significant decimal places.
- 2) This batgrbproduct analysis is done using the HEASARC data.
- 3) This batgrbproduct analysis is using the flight position for the mask-weighting calculation.
======================================================================
                  BAT GRB EVENT DATA PROCESSING REPORT
    Process Script Ver: batgrbproduct v2.46
    Process Start Time: Mon Jan 20 10:15:36 EST 2014
             Host Name: batevent1
   Current Working Dir: /local/data/batevent/batevent_reproc/trigger277356
======================================================================

  Trigger: 00277356      Segment: 000

  BAT Trigger Time: 199355470.848   [s; MET]
      Trigger Stop: 199355471.872   [s; MET]
               UTC: 2007-04-27T08:31:08.930660    [includes UTCF correction]
       Where From?: TDRSS position message

  BAT
    RA: 28.8618505141047   Dec: -27.6329554026753  [deg; J2000]

     Catalogged Source?: NO
     Point Source?:      YES
     GRB Indicated?:     YES    [ by BAT flight software ]
     Image S/N Ratio:    8.85
     Image Trigger?:     NO
     Rate S/N Ratio:     11.7898261225516  [ if not an image trigger ]
     Image S/N Ratio:    8.85

  Analysis Position:   [ source = BAT ]
    RA: 28.8618505141047   Dec: -27.6329554026753  [deg; J2000]

  Refined Position:   [ source = BAT pre-slew burst ]
    RA: 28.8777179976176   Dec: -27.6052179084872  [deg; J2000]
        { 01h 55m 30.7s , -27d 36' 18.8" }
         +/- 0.790441294511867 [arcmin] (estimated 90% radius based on SNR)
         +/- 0.255605754152814 [arcmin] (formal 1-sigma fit error)
    SNR: 42.5616956449078

  Angular difference between the analysis and refined position is 1.865831 arcmin

  Partial Coding Fraction: 1    [ including projection effects ]

  Duration
     T90: 11.080000013113 +/- 0.972084349357335
        Measured from: 0.640000015497208
                   to: 11.7200000286102     [s; relative to TRIGTIME]
     T50: 5.69999998807907 +/- 0.545134811791544
        Measured from: 3.18400001525879
                   to: 8.88400000333786     [s; relative to TRIGTIME]


  Fluence
     Peak Flux  (peak 1 second)
        Measured from: 6.80000001192093
                   to: 7.80000001192093     [s; relative to TRIGTIME]
     Total Fluence
        Measured from: -0.179999977350235
                   to: 13.688000023365     [s; relative to TRIGTIME]

             Band 1     Band 2     Band 3     Band 4
              15-25      25-50     50-100    100-350     keV
 Total     0.537560   0.568346   0.275411   0.042834
           0.018129   0.018940   0.016252   0.013665 [error]
 Peak      0.057763   0.067630   0.030867   0.005396
           0.005109   0.005421   0.004602   0.003780 [error]

     [ fluence units of on-axis counts / fully illuminated detector ]

======================================================================


====== Table of the duration information =============================

        Value   tstart    tstop
T100   13.868   -0.180   13.688
T90    11.080    0.640   11.720
T50     5.700    3.184    8.884
Peak    1.000    6.800    7.800


====== Spectral Analysis Summary =====================================

Model      : spectral model: simple power-law (PL) and cutoff power-law (CPL)
Ph_index   : photon index: E^{Ph_index}
Ph_90err   : 90% error of the photon index
Epeak      : Epeak in keV
Epeak_90err: 90% error of Epeak
Norm       : normalization at 50 keV in both the PL model and CPL model
Nomr_90err : 90% error of the normalization
chi2       : Chi-Squared
dof        : degree of freedo

=== Time-averaged spectral analysis ===
(Best model with acceptable fit: PL)

Model Ph_index Ph_90err_low Ph_90err_hi  Epeak  Epeak_90err_low  Epeak_90err_hi  Norm       Nomr_90err_low    Norm_90err_hi    chi2    dof
PL      -2.034    -0.087      0.086       -           -               -         5.71e-03     -2.96e-04          2.94e-04      57.800   57
CPL     -1.512    -0.355      0.393       40.035     -12.242         9.196      1.12e-02     -4.02e-03          7.28e-03      51.200   56


=== 1-s peak spectral analysis ===
(Best model with acceptable fit: PL)

Model Ph_index Ph_90err_low Ph_90err_hi  Epeak  Epeak_90err_low  Epeak_90err_hi  Norm       Nomr_90err_low    Norm_90err_hi    chi2    dof
PL      -1.925     -0.181     0.173       -           -               -         9.12e-03     -1.11e-03          1.09e-03      43.210   57
CPL     -1.045     -0.789     1.013       44.065     -10.985        36.708      3.00e-02     -3.00e-02          9.10e-02      39.520   56


=== Fluence/Peak Flux Summary ===

              Model    Band1     Band2     Band3     Band4     Band5     Total
                       15-25     25-50    50-100    100-350    15-150    15-350    keV
Fluence         PL   1.67e-07  2.22e-07  2.17e-07  3.80e-07  7.31e-07  9.87e-07   erg/cm2
      90%_error_low -1.14e-08 -9.59e-09 -1.57e-08 -5.35e-08 -3.55e-08 -6.93e-08   erg/cm2
      90%_error_hi   1.16e-08  9.59e-09  1.58e-08  5.93e-08  3.57e-08  7.36e-08   erg/cm2
Peak flux       PL   5.65e-01  4.43e-01  2.33e-01  1.78e-01  1.32e+00  1.42e+00   ph/cm2/s
      90%_error_low -7.62e-02 -4.24e-02 -3.68e-02 -4.85e-02 -1.26e-01 -1.38e-01   ph/cm2/s
      90%_error_hi   7.81e-02  4.24e-02  3.74e-02  5.87e-02  1.26e-01  1.39e-01   ph/cm2/s

Fluence        CPL    N/A      N/A      N/A      N/A      N/A      N/A      erg/cm2
      90%_error_low -1.14e-08 -9.59e-09 -1.57e-08 -5.35e-08 -3.55e-08 -6.93e-08   erg/cm2
      90%_error_hi   1.16e-08  9.59e-09  1.58e-08  5.93e-08  3.57e-08  7.36e-08   erg/cm2
Peak flux      CPL   5.24e-01  4.90e-01  2.25e-01  5.58e-02  1.28e+00  1.30e+00   ph/cm2/s
      90%_error_low -8.69e-02 -5.94e-02 -4.71e-02 -3.85e-02 -1.31e-01 -1.39e-01   ph/cm2/s
      90%_error_hi   8.71e-02  6.24e-02  4.32e-02  1.00e-01  1.31e-01  1.53e-01   ph/cm2/s

======================================================================
Image
Pre-slew 15.0-350.0 keV image (Event data)
#   RAcent    DECcent   POSerr    Theta     Phi              Peak Cts       SNR   Name
   28.8777   -27.6052   0.0045    14.8252   -27.8000         1.4579100     42.562 TRIG_00277356

Foreground time interval of the image:
 -0.180  13.688 (delta_t =  13.868 [sec])
Background time interval of the image:
-239.848  -0.180 (delta_t = 239.668 [sec])
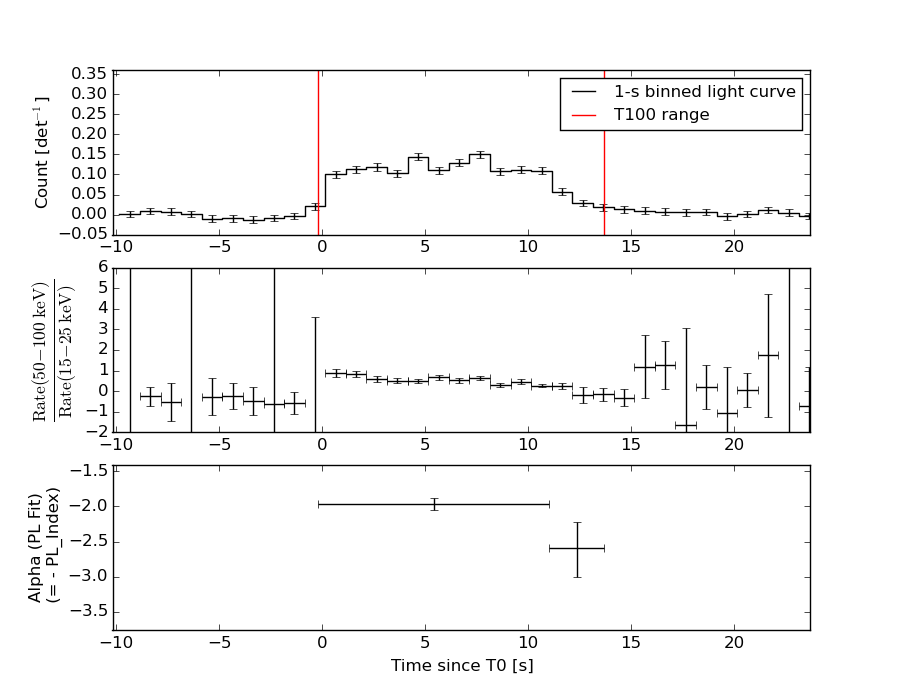
Light Curves
Note: The mask-weighted lightcurves have units of either count/det or counts/sec/det, where a det is 0.4 x 0.4 = 0.16 sq cm.
Full-time range; 1 s binning
Other quick-look light curves:
- 64 ms binning (zoomed)
- 16 ms binning (zoomed)
- 8 ms binning (zoomed)
- 2 ms binning (zoomed)
- SN=5 or 10 s binning (full-time range)
- Raw light curve
Spectra
- 64 ms binning (zoomed)
- 16 ms binning (zoomed)
- 8 ms binning (zoomed)
- 2 ms binning (zoomed)
- SN=5 or 10 s binning (full-time range)
- Raw light curve
Spectra
Notes:
- 1) The fitting includes the systematic errors.
- 2) When the burst includes telescope slew time periods, the fitting uses an average response file made from multiple 5-s response files through out the slew time plus single time preiod for the non-slew times, and weighted by the total counts in the corresponding time period using addrmf. An average response file is needed becuase a spectral fit using the pre-slew DRM will introduce some errors in both a spectral shape and a normalization if the PHA file contains a lot of the slew/post-slew time interval.
- 3) For fits to more complicated models (e.g. a power-law over a cutoff power-law), the BAT team has decided to require a chi-square improvement of more than 6 for each extra dof.
Time averaged spectrum fit using the average DRM
Power-law model
Time interval is from   -0.180 sec. to   13.688 sec.

Spectral model in power-law:
------------------------------------------------------------
Parameters  : value       lower 90%   higher 90%
Photon index: -2.03359     ( -0.0871251   0.0856606 )
Norm@50keV  : 5.70601E-03    ( -0.000296124   0.000293604 )
------------------------------------------------------------
#Fit statistic : Chi-Squared =          57.80 using 59 PHA bins.
# Reduced chi-squared =          1.014 for     57 degrees of freedom
# Null hypothesis probability =   4.454705e-01

Photon flux (15-150 keV)    in 13.87 sec: 0.869460 ( -0.038942  0.039014 ) ph/cm2/s
Energy fluence (15-150 keV)             : 7.31452e-07 ( -3.54729e-08  3.57437e-08 ) ergs/cm2
Cutoff power-law model
Time interval is from   -0.180 sec. to   13.688 sec.
Spectral model in the cutoff power-law:
------------------------------------------------------------
Parameters  : value       lower 90%   higher 90%
Photon index: -1.51159     ( -0.355108   0.392629 )
Epeak [keV] : 40.0347      ( -12.2418 9.19579 )
Norm@50keV  : 1.11692E-02    ( -0.00402097   0.00727845 )
------------------------------------------------------------
#Fit statistic : Chi-Squared =          51.20 using 59 PHA bins.
# Reduced chi-squared =         0.9143 for     56 degrees of freedom
# Null hypothesis probability =   6.567911e-01

Photon flux (15-150 keV)    in 13.87 sec: 0.842548 ( -0.042667  0.042713 ) ph/cm2/s
Energy fluence (15-150 keV)             : 0 ( 0  0 ) ergs/cm2
1-s peak spectrum fit
Power-law model
Time interval is from    6.800 sec. to    7.800 sec.

Spectral model in power-law:
------------------------------------------------------------
Parameters  : value       lower 90%   higher 90%
Photon index: -1.92549     ( -0.181261   0.172683 )
Norm@50keV  : 9.11579E-03    ( -0.0011069   0.00108567 )
------------------------------------------------------------
#Fit statistic : Chi-Squared =          43.21 using 59 PHA bins.
# Reduced chi-squared =         0.7580 for     57 degrees of freedom
# Null hypothesis probability =   9.114864e-01

Photon flux (15-150 keV)    in 1 sec: 1.32269 ( -0.12641  0.12641 ) ph/cm2/s
Energy fluence (15-150 keV)             : 8.38513e-08 ( -9.79364e-09  1.00021e-08 ) ergs/cm2
Cutoff power-law model
Time interval is from    6.800 sec. to    7.800 sec.
Spectral model in the cutoff power-law:
------------------------------------------------------------
Parameters  : value       lower 90%   higher 90%
Photon index: -1.04536     ( -0.788997   1.01315 )
Epeak [keV] : 44.0653      ( -10.985 36.7077 )
Norm@50keV  : 2.99893E-02    ( -0.0299901   0.0910337 )
------------------------------------------------------------
#Fit statistic : Chi-Squared =          39.52 using 59 PHA bins.
# Reduced chi-squared =         0.7056 for     56 degrees of freedom
# Null hypothesis probability =   9.534204e-01

Photon flux (15-150 keV)    in 1 sec: 1.28201 ( -0.13093  0.1313 ) ph/cm2/s
Energy fluence (15-150 keV)             : 7.62272e-08 ( -1.10148e-08  1.18554e-08 ) ergs/cm2
Time-resolved spectra
Distribution
T90 vs. Hardness ratio plot
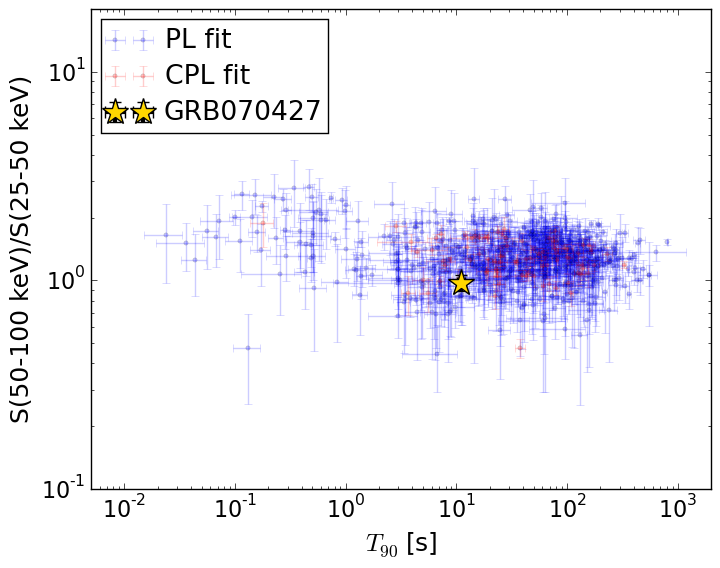
T90                                   = 11.08 sec.
Hardness ratio (energy fluence ratio) = 0.977035163809
S(15-50 keV) vs. S(50-150 keV) plot
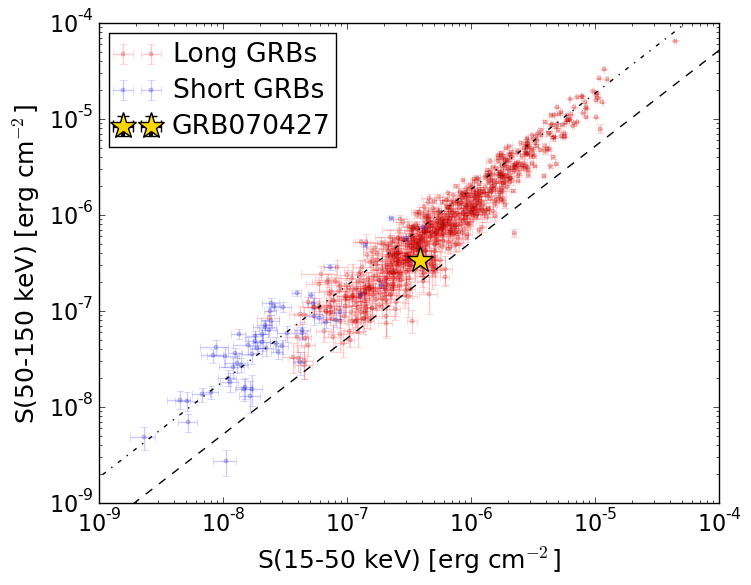
S(15-50 keV)  = 3.895139e-07
S(50-150 keV) = 3.4194e-07
The dash-dotted line and the dashed line traces the fluences calculated from the Band function with Epeak = 15 and 150 keV, respectively. Both lines assume a canonical values of alpha = -1 and beta = -2.5.
Mask shadow pattern
IMX = 2.341320456674236E-01, IMY = 1.234435913118846E-01
Spacecraft aspect plot
Bright source in the pre-burst/pre-slew/post-slew images
Pre-burst image of 15-350 keV band
Time interval of the image:
-239.848000 -0.180000

# RAcent  DECcent POSerr Theta    Phi  PeakCts   SNR AngSep     Name
#  [deg]    [deg]    ['] [deg]  [deg]                   [']
 30.9837 -64.1733    3.0  34.9   58.2   1.1925   3.8 ------	UNKNOWN
 33.0087 -17.2165    2.2  23.4  -49.8   0.8398   5.3 ------	UNKNOWN
 56.1165  -1.8399    3.1  50.7  -44.4   3.2386   3.7 ------	UNKNOWN
Pre-slew background subtracted image of 15-350 keV band
Time interval of the image:
-0.180000 13.688000

# RAcent  DECcent POSerr Theta    Phi  PeakCts   SNR AngSep     Name
#  [deg]    [deg]    ['] [deg]  [deg]                   [']
327.4157 -42.1454    3.2  37.2  132.3   0.2655   3.6 ------	UNKNOWN
333.4571 -30.5571    2.1  33.2  153.1   0.2729   5.4 ------	UNKNOWN
 28.8777 -27.6052    0.3  14.8  -27.8   1.4580  42.6 ------	UNKNOWN
Post-slew image of 15-350 keV band
Time interval of the image:
400.252580 962.170200

# RAcent  DECcent POSerr Theta    Phi  PeakCts   SNR AngSep     Name
#  [deg]    [deg]    ['] [deg]  [deg]                   [']
135.5117 -40.5469    3.1  46.3  156.6   3.1759   3.7    0.9	Vela X-1
148.4035  27.7680    3.2  26.2    9.8   1.0327   3.6 ------	UNKNOWN
 94.3564 -20.9690    2.9  46.7 -147.2   2.8067   3.9 ------	UNKNOWN