Analysis Summary
Notes:
- 1) No attempt has been made to eliminate the non-significant decimal places.
- 2) This batgrbproduct analysis is done using the HEASARC data.
- 3) This batgrbproduct analysis is using the flight position for the mask-weighting calculation.
======================================================================
                  BAT GRB EVENT DATA PROCESSING REPORT
    Process Script Ver: batgrbproduct v2.46
    Process Start Time: Mon Jan 20 10:06:39 EST 2014
             Host Name: batevent1
   Current Working Dir: /local/data/batevent/batevent_reproc/trigger277582
======================================================================

  Trigger: 00277582      Segment: 000

  BAT Trigger Time: 199508946.368   [s; MET]
      Trigger Stop: 199508946.752   [s; MET]
               UTC: 2007-04-29T03:09:04.446800    [includes UTCF correction]
       Where From?: TDRSS position message

  BAT
    RA: 328.024078768624   Dec: -38.8438832424751  [deg; J2000]

     Catalogged Source?: NO
     Point Source?:      YES
     GRB Indicated?:     YES    [ by BAT flight software ]
     Image S/N Ratio:    8
     Image Trigger?:     NO
     Rate S/N Ratio:     18.3575597506858  [ if not an image trigger ]
     Image S/N Ratio:    8

  Analysis Position:   [ source = BAT ]
    RA: 328.024078768624   Dec: -38.8438832424751  [deg; J2000]

  Refined Position:   [ source = BAT pre-slew burst ]
    RA: 328.020664983542   Dec: -38.8516608361705  [deg; J2000]
        { 21h 52m 05.0s , -38d 51' 06.0" }
         +/- 1.86738401901006 [arcmin] (estimated 90% radius based on SNR)
         +/- 0.815503421875004 [arcmin] (formal 1-sigma fit error)
    SNR: 12.4635498350436

  Angular difference between the analysis and refined position is 0.493168 arcmin

  Partial Coding Fraction: 0.6640625    [ including projection effects ]

  Duration
     T90: 0.488000005483627 +/- 0.0430813393540356
        Measured from: -0.196000009775162
                   to: 0.291999995708466     [s; relative to TRIGTIME]
     T50: 0.364000022411346 +/- 0.055569781312264
        Measured from: -0.136000007390976
                   to: 0.22800001502037     [s; relative to TRIGTIME]


  Fluence
     Peak Flux  (peak 1 second)
        Measured from: -0.437999993562698
                   to: 0.562000006437302     [s; relative to TRIGTIME]
     Total Fluence
        Measured from: -0.208000004291534
                   to: 0.328000009059906     [s; relative to TRIGTIME]

             Band 1     Band 2     Band 3     Band 4
              15-25      25-50     50-100    100-350     keV
 Total     0.034408   0.043151   0.028294   0.003328
           0.004792   0.005206   0.004487   0.003449 [error]
 Peak      0.046337   0.051856   0.028457   0.005098
           0.006318   0.006574   0.005682   0.004481 [error]

     [ fluence units of on-axis counts / fully illuminated detector ]

======================================================================


====== Table of the duration information =============================

        Value   tstart    tstop
T100    0.536   -0.208    0.328
T90     0.488   -0.196    0.292
T50     0.364   -0.136    0.228
Peak    1.000   -0.438    0.562


====== Spectral Analysis Summary =====================================

Model      : spectral model: simple power-law (PL) and cutoff power-law (CPL)
Ph_index   : photon index: E^{Ph_index}
Ph_90err   : 90% error of the photon index
Epeak      : Epeak in keV
Epeak_90err: 90% error of Epeak
Norm       : normalization at 50 keV in both the PL model and CPL model
Nomr_90err : 90% error of the normalization
chi2       : Chi-Squared
dof        : degree of freedo

=== Time-averaged spectral analysis ===
(Best model with acceptable fit: PL)

Model Ph_index Ph_90err_low Ph_90err_hi  Epeak  Epeak_90err_low  Epeak_90err_hi  Norm       Nomr_90err_low    Norm_90err_hi    chi2    dof
PL      -1.645    -0.227      0.220       -           -               -         1.31e-02     -1.91e-03          1.88e-03      65.180   57
CPL     -1.099    -0.721      1.245       72.852     -25.966       -72.852      2.65e-02     -1.50e-02          1.11e-01      64.240   56


=== 1-s peak spectral analysis ===
(Best model with acceptable fit: PL)

Model Ph_index Ph_90err_low Ph_90err_hi  Epeak  Epeak_90err_low  Epeak_90err_hi  Norm       Nomr_90err_low    Norm_90err_hi    chi2    dof
PL      -1.836     -0.249     0.236       -           -               -         7.90e-03     -1.35e-03          1.32e-03      64.600   57
CPL     -0.371     -1.308     1.916       43.586      -8.997        43.149      6.03e-02     -6.03e-02          8.74e-01      60.860   56


=== Fluence/Peak Flux Summary ===

              Model    Band1     Band2     Band3     Band4     Band5     Total
                       15-25     25-50    50-100    100-350    15-150    15-350    keV
Fluence         PL   1.03e-08  1.72e-08  2.21e-08  5.66e-08  6.52e-08  1.06e-07   erg/cm2
      90%_error_low -2.01e-09 -2.29e-09 -4.21e-09 -1.92e-08 -1.00e-08 -2.38e-08   erg/cm2
      90%_error_hi   2.07e-09  2.29e-09  4.22e-09  2.47e-08  1.02e-08  2.82e-08   erg/cm2
Peak flux       PL   4.50e-01  3.71e-01  2.08e-01  1.72e-01  1.10e+00  1.20e+00   ph/cm2/s
      90%_error_low -8.79e-02 -5.25e-02 -4.50e-02 -6.15e-02 -1.56e-01 -1.73e-01   ph/cm2/s
      90%_error_hi   9.07e-02  5.25e-02  4.57e-02  7.96e-02  1.56e-01  1.74e-01   ph/cm2/s

Fluence        CPL   9.77e-09  1.86e-08  2.21e-08  2.27e-08  6.18e-08  7.32e-08   erg/cm2
      90%_error_low -2.24e-09 -3.14e-09 -4.97e-09 -1.80e-08 -1.18e-08 -2.19e-08   erg/cm2
      90%_error_hi   2.25e-09  3.48e-09  4.61e-09  4.03e-08  1.18e-08  5.73e-08   erg/cm2
Peak flux      CPL   4.08e-01  4.41e-01  1.90e-01  2.75e-02  1.06e+00  1.07e+00   ph/cm2/s
      90%_error_low -1.01e-01 -8.12e-02 -6.98e-02 -2.75e-02 -1.59e-01 -1.62e-01   ph/cm2/s
      90%_error_hi   1.01e-01  8.63e-02  5.92e-02  1.09e-01  1.60e-01  1.72e-01   ph/cm2/s

======================================================================
Image
Pre-slew 15.0-350.0 keV image (Event data)
#   RAcent    DECcent   POSerr    Theta     Phi              Peak Cts       SNR   Name
  328.0207   -38.8517   0.0154    25.3780   -58.7521         0.1124605     12.464 TRIG_00277582

Foreground time interval of the image:
 -0.208   0.328 (delta_t =   0.536 [sec])
Background time interval of the image:
-165.267  -0.208 (delta_t = 165.059 [sec])
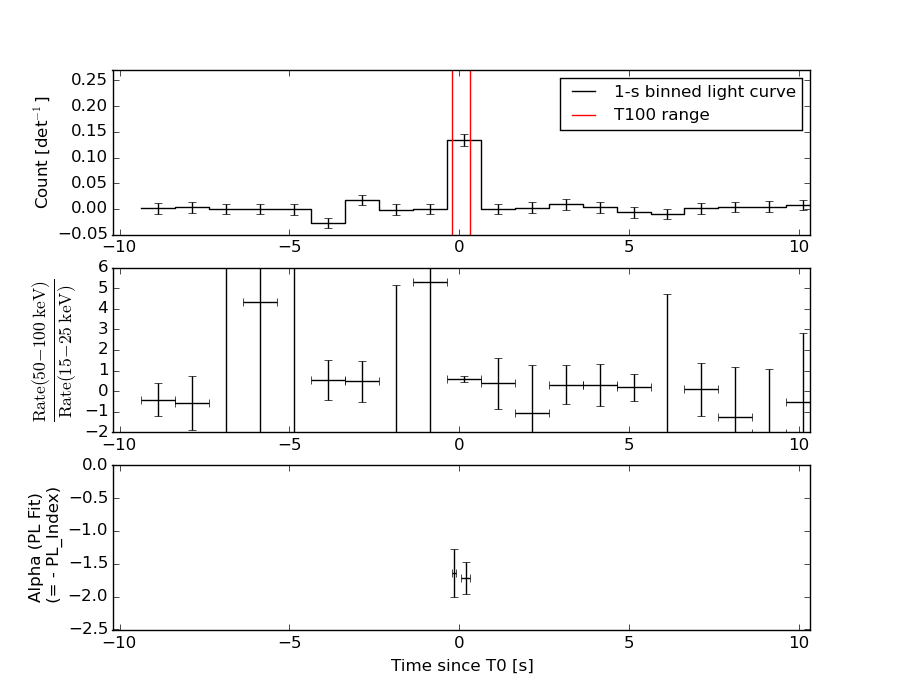
Light Curves
Note: The mask-weighted lightcurves have units of either count/det or counts/sec/det, where a det is 0.4 x 0.4 = 0.16 sq cm.
Full-time range; 1 s binning
Other quick-look light curves:
- 64 ms binning (zoomed)
- 16 ms binning (zoomed)
- 8 ms binning (zoomed)
- 2 ms binning (zoomed)
- SN=5 or 10 s binning (full-time range)
- Raw light curve
Spectra
- 64 ms binning (zoomed)
- 16 ms binning (zoomed)
- 8 ms binning (zoomed)
- 2 ms binning (zoomed)
- SN=5 or 10 s binning (full-time range)
- Raw light curve
Spectra
Notes:
- 1) The fitting includes the systematic errors.
- 2) When the burst includes telescope slew time periods, the fitting uses an average response file made from multiple 5-s response files through out the slew time plus single time preiod for the non-slew times, and weighted by the total counts in the corresponding time period using addrmf. An average response file is needed becuase a spectral fit using the pre-slew DRM will introduce some errors in both a spectral shape and a normalization if the PHA file contains a lot of the slew/post-slew time interval.
- 3) For fits to more complicated models (e.g. a power-law over a cutoff power-law), the BAT team has decided to require a chi-square improvement of more than 6 for each extra dof.
Time averaged spectrum fit using the average DRM
Power-law model

Time interval is from   -0.208 sec. to    0.328 sec.

Spectral model in power-law:
------------------------------------------------------------
Parameters  : value       lower 90%   higher 90%
Photon index: -1.64518     ( -0.227075   0.220136 )
Norm@50keV  : 1.30708E-02    ( -0.00190965   0.00187761 )
------------------------------------------------------------
#Fit statistic : Chi-Squared =          65.18 using 59 PHA bins.
# Reduced chi-squared =          1.144 for     57 degrees of freedom
# Null hypothesis probability =   2.135354e-01

Photon flux (15-150 keV)    in 0.536 sec: 1.70409 ( -0.22621  0.22628 ) ph/cm2/s
Energy fluence (15-150 keV)             : 6.52012e-08 ( -1.00386e-08  1.01942e-08 ) ergs/cm2
Cutoff power-law model
Time interval is from   -0.208 sec. to    0.328 sec.
Spectral model in the cutoff power-law:
------------------------------------------------------------
Parameters  : value       lower 90%   higher 90%
Photon index: -1.09883     ( -0.721405   1.24466 )
Epeak [keV] : 72.8519      ( -25.8901 -72.7758 )
Norm@50keV  : 2.65474E-02    ( -0.0150449   0.110482 )
------------------------------------------------------------
#Fit statistic : Chi-Squared =          64.24 using 59 PHA bins.
# Reduced chi-squared =          1.147 for     56 degrees of freedom
# Null hypothesis probability =   2.101635e-01

Photon flux (15-150 keV)    in 0.536 sec: 1.67856 ( -0.23207  0.23113 ) ph/cm2/s
Energy fluence (15-150 keV)             : 6.17585e-08 ( -1.18269e-08  1.1797e-08 ) ergs/cm2
1-s peak spectrum fit
Power-law model
Time interval is from   -0.438 sec. to    0.562 sec.

Spectral model in power-law:
------------------------------------------------------------
Parameters  : value       lower 90%   higher 90%
Photon index: -1.83598     ( -0.248678   0.235974 )
Norm@50keV  : 7.90359E-03    ( -0.00134905   0.00131953 )
------------------------------------------------------------
#Fit statistic : Chi-Squared =          64.60 using 59 PHA bins.
# Reduced chi-squared =          1.133 for     57 degrees of freedom
# Null hypothesis probability =   2.283204e-01

Photon flux (15-150 keV)    in 1 sec: 1.10472 ( -0.156276  0.15629 ) ph/cm2/s
Energy fluence (15-150 keV)             : 7.27009e-08 ( -1.22768e-08  1.25875e-08 ) ergs/cm2
Cutoff power-law model
Time interval is from   -0.438 sec. to    0.562 sec.
Spectral model in the cutoff power-law:
------------------------------------------------------------
Parameters  : value       lower 90%   higher 90%
Photon index: -0.370597     ( -1.30859   1.91545 )
Epeak [keV] : 43.5858      ( -8.99171 43.1545 )
Norm@50keV  : 6.03227E-02    ( -0.0604063   0.873754 )
------------------------------------------------------------
#Fit statistic : Chi-Squared =          60.86 using 59 PHA bins.
# Reduced chi-squared =          1.087 for     56 degrees of freedom
# Null hypothesis probability =   3.051910e-01

Photon flux (15-150 keV)    in 1 sec: 1.06252 ( -0.159315  0.16044 ) ph/cm2/s
Energy fluence (15-150 keV)             : 6.22874e-08 ( -1.26579e-08  1.51409e-08 ) ergs/cm2
Time-resolved spectra
Distribution
T90 vs. Hardness ratio plot
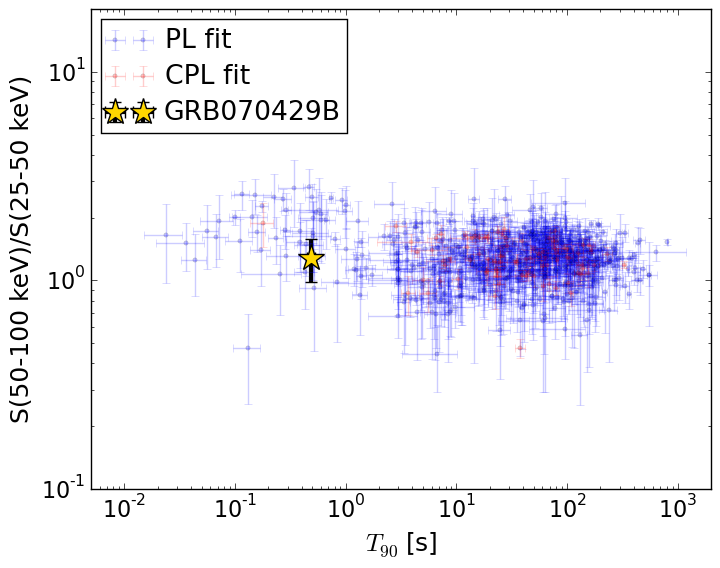
T90                                   = 0.488 sec.
Hardness ratio (energy fluence ratio) = 1.27888055292
S(15-50 keV) vs. S(50-150 keV) plot
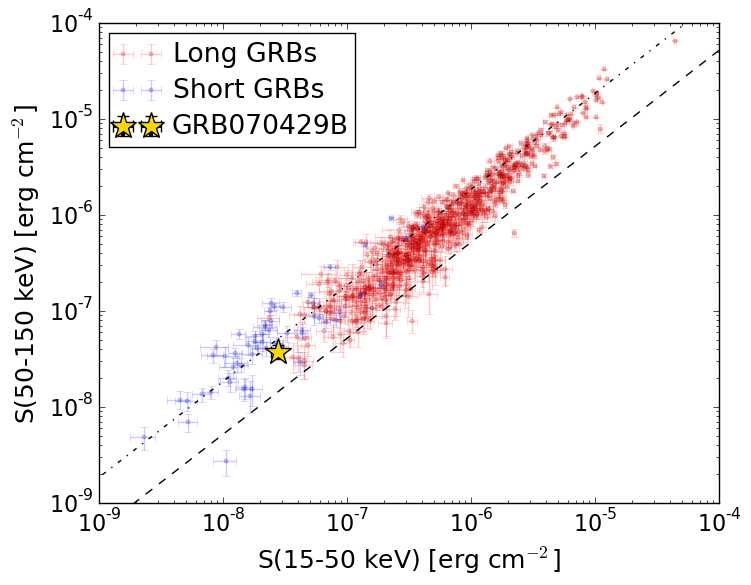
S(15-50 keV)  = 2.749696e-08
S(50-150 keV) = 3.770251e-08
The dash-dotted line and the dashed line traces the fluences calculated from the Band function with Epeak = 15 and 150 keV, respectively. Both lines assume a canonical values of alpha = -1 and beta = -2.5.
Mask shadow pattern
IMX = 2.460721638085664E-01, IMY = 4.055484913668132E-01
Spacecraft aspect plot
Bright source in the pre-burst/pre-slew/post-slew images
Pre-burst image of 15-350 keV band
Time interval of the image:
-165.267410 -0.208000

# RAcent  DECcent POSerr Theta    Phi  PeakCts   SNR AngSep     Name
#  [deg]    [deg]    ['] [deg]  [deg]                   [']
256.0689 -37.9349   26.4  34.1   76.8   0.1231   0.4    6.7	4U 1700-377
256.5123 -36.5752    9.1  33.9   79.3  -0.3721  -1.3    9.9	GX 349+2
262.9840 -24.8244    6.9  31.2  103.0   0.4306   1.7    4.9	GX 1+4
264.8647 -44.3334   10.2  28.1   63.3   0.2180   1.1    8.7	4U 1735-44
268.4520  -1.3481   42.3  41.5  140.5  -0.1072  -0.3    8.0	SW J1753.5-0127
270.2889 -25.0590    2.3  25.0  108.0   0.8914   4.9    1.2	GX 5-1
270.4493 -25.8900    0.0  24.6  106.3   0.2653   1.5   11.9	GRS 1758-258
273.9518 -14.0761   13.9  28.3  132.8   0.1556   0.8    3.9	GX 17+2
275.9067 -30.3910    3.3  18.6   98.4   0.5155   3.5    1.7	H1820-303
285.2024 -25.0392    3.8  13.2  128.9  -0.3666  -3.0   11.5	HT1900.1-2455
288.8156  10.9389    1.1  44.2  175.5   2.5021  10.0    1.1	GRS 1915+105
262.9668 -33.7142    3.9  29.0   85.8   0.6536   3.0    7.3	GX 354-0
356.6698 -41.5522    4.3  47.1  -53.2   2.2084   2.7 ------	UNKNOWN
331.0474   0.1642    3.1  45.3 -121.3   2.8143   3.8 ------	UNKNOWN
Pre-slew background subtracted image of 15-350 keV band
Time interval of the image:
-0.208000 0.328000

# RAcent  DECcent POSerr Theta    Phi  PeakCts   SNR AngSep     Name
#  [deg]    [deg]    ['] [deg]  [deg]                   [']
255.8322 -37.7221    7.3  34.4   77.2   0.0228   1.6   10.4	4U 1700-377
256.5819 -36.5655    8.9  33.8   79.3   0.0182   1.3   11.1	GX 349+2
263.1805 -24.7243   11.9  31.1  103.3   0.0114   1.0    9.4	GX 1+4
264.7550 -44.3921  686.3  28.2   63.3   0.0002   0.0    3.5	4U 1735-44
268.2335  -1.4745    7.3  41.5  140.2  -0.0292  -1.6    8.2	SW J1753.5-0127
270.1013 -25.2058    0.0  25.1  107.5  -0.0129  -1.4   12.5	GX 5-1
270.4860 -25.6166    0.0  24.6  107.0  -0.0097  -1.1   12.5	GRS 1758-258
274.0813 -13.9940   13.3  28.3  133.1  -0.0084  -0.9    5.1	GX 17+2
276.0909 -30.4638 2700.0  18.5   98.3   0.0000   0.0   10.4	H1820-303
285.0681 -25.0117    7.2  13.3  128.7   0.0120   1.6    5.7	HT1900.1-2455
288.9120  10.9038    5.5  44.1  175.6   0.0277   2.1    7.1	GRS 1915+105
263.0197 -33.9745    4.2  28.9   85.3   0.0290   2.8    8.5	GX 354-0
272.2113  -0.9007    2.4  39.6  145.6   0.0685   4.8 ------	UNKNOWN
292.7366  11.9320    2.3  44.6 -178.9   0.0667   5.1 ------	UNKNOWN
328.0207 -38.8517    0.9  25.4  -58.8   0.1125  12.5 ------	UNKNOWN
308.1343  24.8955    1.9  58.2 -160.8   0.2572   6.0 ------	UNKNOWN
Post-slew image of 15-350 keV band
Time interval of the image:
228.332590 962.654100

# RAcent  DECcent POSerr Theta    Phi  PeakCts   SNR AngSep     Name
#  [deg]    [deg]    ['] [deg]  [deg]                   [']
285.0202 -25.0517   11.4  38.6  123.0  -0.8540  -1.0    7.9	HT1900.1-2455
284.4977 -29.7187    2.7  36.7  115.9   3.2554   4.2 ------	UNKNOWN
293.9803 -71.5944    2.5  37.0   42.1   2.5632   4.6 ------	UNKNOWN
308.4216 -65.0131    2.6  28.5   42.3   1.6906   4.5 ------	UNKNOWN
 58.4027 -70.7947    2.8  53.8    1.0   4.2481   4.1 ------	UNKNOWN
  8.9490 -18.1822    3.6  41.0  -83.4   5.9665   3.2 ------	UNKNOWN