Analysis Summary
Notes:
- 1) No attempt has been made to eliminate the non-significant decimal places.
- 2) This batgrbproduct analysis is done using the HEASARC data.
- 3) This batgrbproduct analysis is using the flight position for the mask-weighting calculation.
======================================================================
BAT GRB EVENT DATA PROCESSING REPORT
Process Script Ver: batgrbproduct v2.46
Process Start Time: Mon Jan 20 09:57:50 EST 2014
Host Name: batevent1
Current Working Dir: /local/data/batevent/batevent_reproc/trigger278854
======================================================================
Trigger: 00278854 Segment: 000
BAT Trigger Time: 200290699.776 [s; MET]
Trigger Stop: 200290700.8 [s; MET]
UTC: 2007-05-08T04:18:17.835440 [includes UTCF correction]
Where From?: TDRSS position message
BAT
RA: 312.782826014256 Dec: -78.3681172291522 [deg; J2000]
Catalogged Source?: NO
Point Source?: YES
GRB Indicated?: YES [ by BAT flight software ]
Image S/N Ratio: 19.9
Image Trigger?: NO
Rate S/N Ratio: 51.0392006206994 [ if not an image trigger ]
Image S/N Ratio: 19.9
Analysis Position: [ source = BAT ]
RA: 312.782826014256 Dec: -78.3681172291522 [deg; J2000]
Refined Position: [ source = BAT pre-slew burst ]
RA: 312.813523041667 Dec: -78.3818522566903 [deg; J2000]
{ 20h 51m 15.2s , -78d 22' 54.7" }
+/- 0.440186828747394 [arcmin] (estimated 90% radius based on SNR)
+/- 0.130979377609992 [arcmin] (formal 1-sigma fit error)
SNR: 98.2218970683203
Angular difference between the analysis and refined position is 0.903818 arcmin
Partial Coding Fraction: 0.625 [ including projection effects ]
Duration
T90: 20.9000000059605 +/- 0.73174858089084
Measured from: -0.412000000476837
to: 20.4880000054836 [s; relative to TRIGTIME]
T50: 7.61600002646446 +/- 0.141534440139191
Measured from: 5.93999999761581
to: 13.5560000240803 [s; relative to TRIGTIME]
Fluence
Peak Flux (peak 1 second)
Measured from: 10.8480000197887
to: 11.8480000197887 [s; relative to TRIGTIME]
Total Fluence
Measured from: -15.6200000047684
to: 33.1159999966621 [s; relative to TRIGTIME]
Band 1 Band 2 Band 3 Band 4
15-25 25-50 50-100 100-350 keV
Total 6.829320 10.468429 9.247947 2.570325
0.059669 0.065461 0.061655 0.043730 [error]
Peak 0.540443 1.034408 1.118052 0.334792
0.013159 0.017115 0.018281 0.011873 [error]
[ fluence units of on-axis counts / fully illuminated detector ]
======================================================================
====== Table of the duration information =============================
Value tstart tstop
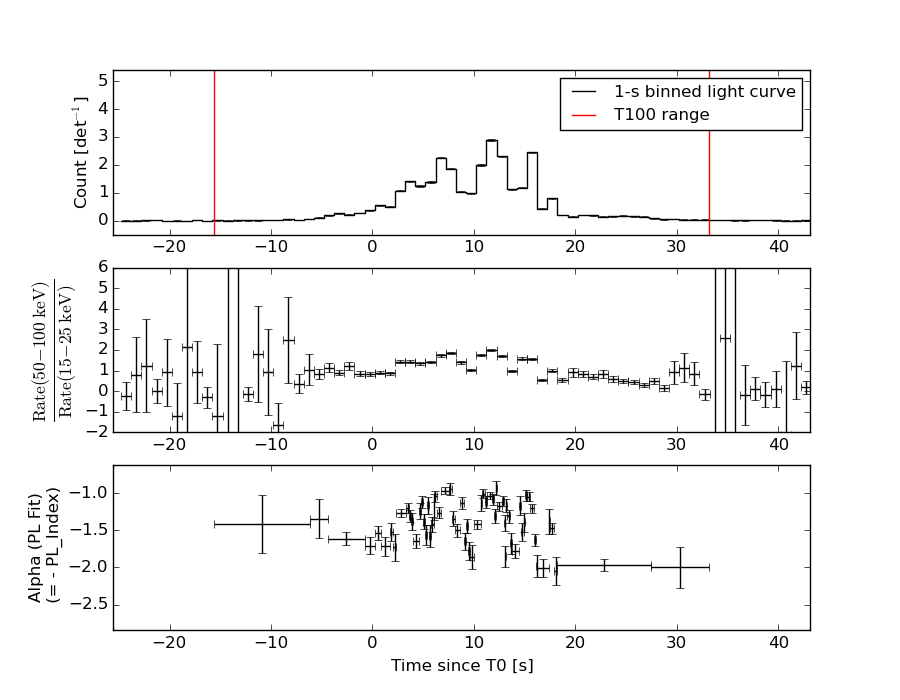
T100 48.736 -15.620 33.116
T90 20.900 -0.412 20.488
T50 7.616 5.940 13.556
Peak 1.000 10.848 11.848
====== Spectral Analysis Summary =====================================
Model : spectral model: simple power-law (PL) and cutoff power-law (CPL)
Ph_index : photon index: E^{Ph_index}
Ph_90err : 90% error of the photon index
Epeak : Epeak in keV
Epeak_90err: 90% error of Epeak
Norm : normalization at 50 keV in both the PL model and CPL model
Nomr_90err : 90% error of the normalization
chi2 : Chi-Squared
dof : degree of freedo
=== Time-averaged spectral analysis ===
(Best model with acceptable fit: PL)
Model Ph_index Ph_90err_low Ph_90err_hi Epeak Epeak_90err_low Epeak_90err_hi Norm Nomr_90err_low Norm_90err_hi chi2 dof
PL -1.336 -0.024 0.024 - - - 4.20e-02 -5.71e-04 5.70e-04 34.050 57
CPL -1.220 -0.096 0.098 443.852 -170.782 1549.098 4.65e-02 -3.67e-03 4.05e-03 29.840 56
=== 1-s peak spectral analysis ===
(Best model with acceptable fit: CPL)
Model Ph_index Ph_90err_low Ph_90err_hi Epeak Epeak_90err_low Epeak_90err_hi Norm Nomr_90err_low Norm_90err_hi chi2 dof
PL -1.059 -0.037 0.037 - - - 2.14e-01 -4.49e-03 4.49e-03 77.780 57
CPL -0.679 -0.153 0.158 213.491 -44.398 97.788 3.07e-01 -4.07e-02 4.82e-02 58.940 56
=== Fluence/Peak Flux Summary ===
Model Band1 Band2 Band3 Band4 Band5 Total
15-25 25-50 50-100 100-350 15-150 15-350 keV
Fluence PL 2.24e-06 4.55e-06 7.22e-06 2.54e-05 2.01e-05 3.94e-05 erg/cm2
90%_error_low -6.75e-08 -8.23e-08 -9.21e-08 -7.59e-07 -2.48e-07 -7.67e-07 erg/cm2
90%_error_hi 6.85e-08 8.24e-08 9.20e-08 7.75e-07 2.48e-07 7.78e-07 erg/cm2
Peak flux PL 2.10e-03 2.60e-02 2.18e-01 2.51e+01 9.63e-01 1.72e+01 ph/cm2/s
90%_error_low N/A N/A N/A N/A N/A N/A ph/cm2/s
90%_error_hi N/A N/A N/A N/A N/A N/A ph/cm2/s
Fluence CPL 2.15e-06 4.55e-06 7.32e-06 2.27e-05 2.00e-05 3.67e-05 erg/cm2
90%_error_low -9.76e-08 -8.35e-08 -1.23e-07 -2.03e-06 -2.54e-07 -2.03e-06 erg/cm2
90%_error_hi 9.95e-08 8.33e-08 1.24e-07 2.27e-06 2.55e-07 2.27e-06 erg/cm2
Peak flux CPL 5.13e+00 7.62e+00 7.62e+00 8.99e+00 2.42e+01 2.94e+01 ph/cm2/s
90%_error_low -3.41e-01 -2.13e-01 -2.11e-01 -1.04e+00 -5.64e-01 -1.22e+00 ph/cm2/s
90%_error_hi 3.50e-01 2.13e-01 2.12e-01 1.22e+00 5.66e-01 1.37e+00 ph/cm2/s
======================================================================
Image
Pre-slew 15.0-350.0 keV image (Event data)
#   RAcent    DECcent   POSerr    Theta     Phi              Peak Cts       SNR   Name
  312.8135   -78.3819   0.0020    28.2572  -126.9372        20.2641644     98.222 TRIG_00278854

Foreground time interval of the image:
-15.620  12.725 (delta_t =  28.345 [sec])
Background time interval of the image:
-239.776 -15.620 (delta_t = 224.156 [sec])
Light Curves
Note: The mask-weighted lightcurves have units of either count/det or counts/sec/det, where a det is 0.4 x 0.4 = 0.16 sq cm.
Full-time range; 1 s binning
Other quick-look light curves:
- 64 ms binning (zoomed)
- 16 ms binning (zoomed)
- 8 ms binning (zoomed)
- 2 ms binning (zoomed)
- SN=5 or 10 s binning (full-time range)
- Raw light curve
Spectra
- 64 ms binning (zoomed)
- 16 ms binning (zoomed)
- 8 ms binning (zoomed)
- 2 ms binning (zoomed)
- SN=5 or 10 s binning (full-time range)
- Raw light curve
Spectra
Notes:
- 1) The fitting includes the systematic errors.
- 2) When the burst includes telescope slew time periods, the fitting uses an average response file made from multiple 5-s response files through out the slew time plus single time preiod for the non-slew times, and weighted by the total counts in the corresponding time period using addrmf. An average response file is needed becuase a spectral fit using the pre-slew DRM will introduce some errors in both a spectral shape and a normalization if the PHA file contains a lot of the slew/post-slew time interval.
- 3) For fits to more complicated models (e.g. a power-law over a cutoff power-law), the BAT team has decided to require a chi-square improvement of more than 6 for each extra dof.
Time averaged spectrum fit using the average DRM
Power-law model
Time interval is from  -15.620 sec. to   33.116 sec.

Spectral model in power-law:
------------------------------------------------------------
Parameters  : value       lower 90%   higher 90%
Photon index: -1.33558     ( -0.0235742   0.0236716 )
Norm@50keV  : 4.19919E-02    ( -0.000571091   0.000569807 )
------------------------------------------------------------
#Fit statistic : Chi-Squared =          34.05 using 59 PHA bins.
# Reduced chi-squared =         0.5974 for     57 degrees of freedom
# Null hypothesis probability =   9.932111e-01

Photon flux (15-150 keV)    in 48.74 sec: 5.04410 ( -0.08119  0.0815 ) ph/cm2/s
Energy fluence (15-150 keV)             : 2.00574e-05 ( -2.47844e-07  2.47682e-07 ) ergs/cm2
Cutoff power-law model
Time interval is from  -15.620 sec. to   33.116 sec.
Spectral model in the cutoff power-law:
------------------------------------------------------------
Parameters  : value       lower 90%   higher 90%
Photon index: -1.22023     ( -0.0955631   0.0975875 )
Epeak [keV] : 443.852      ( -170.732 1549.15 )
Norm@50keV  : 4.64582E-02    ( -0.00366781   0.00404599 )
------------------------------------------------------------
#Fit statistic : Chi-Squared =          29.84 using 59 PHA bins.
# Reduced chi-squared =         0.5329 for     56 degrees of freedom
# Null hypothesis probability =   9.984080e-01

Photon flux (15-150 keV)    in 48.74 sec: 3.07257 (    ) ph/cm2/s
Energy fluence (15-150 keV)             : 1.99851e-05 ( -2.5422e-07  2.5471e-07 ) ergs/cm2
1-s peak spectrum fit
Power-law model
Time interval is from   10.848 sec. to   11.848 sec.

Spectral model in power-law:
------------------------------------------------------------
Parameters  : value       lower 90%   higher 90%
Photon index: -1.05891     ( -0.0365548   0.0366613 )
Norm@50keV  : 0.213810    ( -0.00449256   0.00448763 )
------------------------------------------------------------
#Fit statistic : Chi-Squared =          77.78 using 59 PHA bins.
# Reduced chi-squared =          1.365 for     57 degrees of freedom
# Null hypothesis probability =   3.506968e-02

Photon flux (15-150 keV)    in 1 sec: 0.962643 (    ) ph/cm2/s
Energy fluence (15-150 keV)             : 2.26584e-06 ( -4.91243e-08  4.9208e-08 ) ergs/cm2
Cutoff power-law model
Time interval is from   10.848 sec. to   11.848 sec.
Spectral model in the cutoff power-law:
------------------------------------------------------------
Parameters  : value       lower 90%   higher 90%
Photon index: -0.678584     ( -0.152616   0.157576 )
Epeak [keV] : 213.491      ( -44.398 97.7885 )
Norm@50keV  : 0.307298    ( -0.0406574   0.0482327 )
------------------------------------------------------------
#Fit statistic : Chi-Squared =          58.94 using 59 PHA bins.
# Reduced chi-squared =          1.053 for     56 degrees of freedom
# Null hypothesis probability =   3.684315e-01

Photon flux (15-150 keV)    in 1 sec: 24.2483 ( -0.5641  0.5662 ) ph/cm2/s
Energy fluence (15-150 keV)             : 2.24161e-06 ( -5.07733e-08  5.06823e-08 ) ergs/cm2
Time-resolved spectra
Distribution
T90 vs. Hardness ratio plot
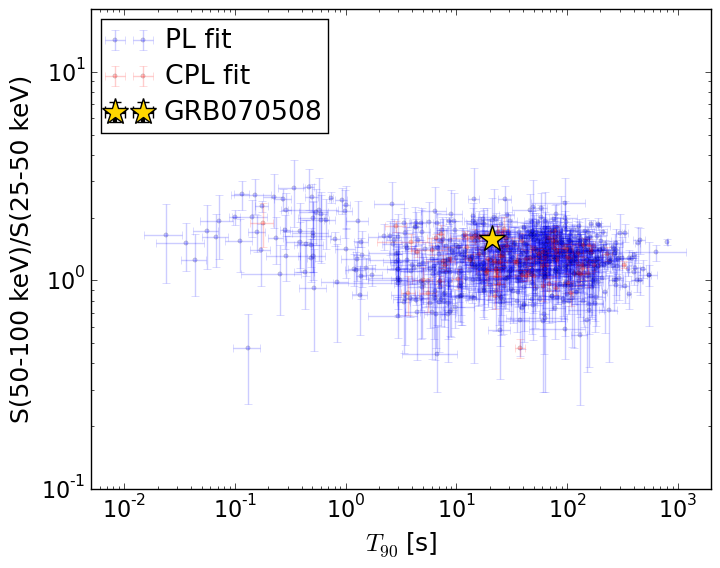
T90                                   = 20.9 sec.
Hardness ratio (energy fluence ratio) = 1.58500248819
S(15-50 keV) vs. S(50-150 keV) plot
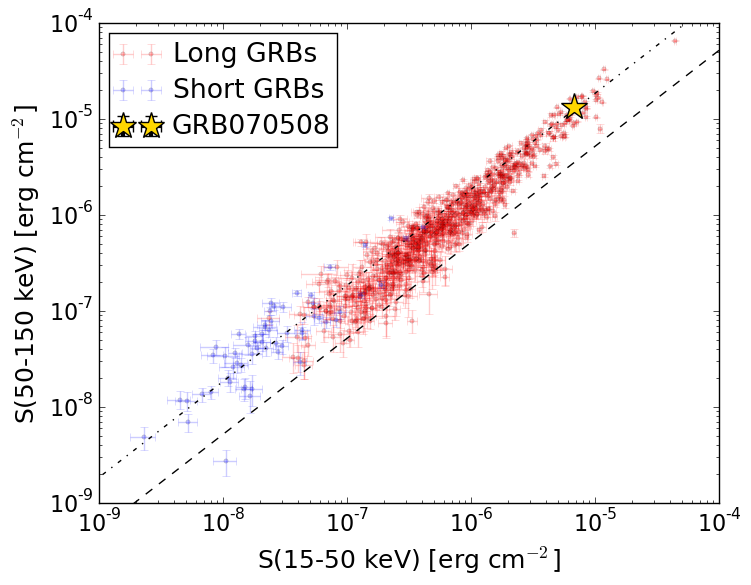
S(15-50 keV)  = 6.794108e-06
S(50-150 keV) = 1.3263416e-05
The dash-dotted line and the dashed line traces the fluences calculated from the Band function with Epeak = 15 and 150 keV, respectively. Both lines assume a canonical values of alpha = -1 and beta = -2.5.
Mask shadow pattern
IMX = -3.229942853789712E-01, IMY = 4.296065986230516E-01
Spacecraft aspect plot
Bright source in the pre-burst/pre-slew/post-slew images
Pre-burst image of 15-350 keV band
Time interval of the image:
-239.776000 -15.620000

# RAcent  DECcent POSerr Theta    Phi  PeakCts   SNR AngSep     Name
#  [deg]    [deg]    ['] [deg]  [deg]                   [']
135.5723 -40.6710   12.7  52.5  -29.2   0.6469   0.9    7.3	Vela X-1
170.5922 -60.5774    9.3  23.3  -26.5   0.2140   1.2    8.6	Cen X-3
186.3294 -62.8007    3.3  15.6  -22.5   0.5970   3.5    9.2	GX 301-2
255.9836 -37.8398    0.6  33.3  132.3   5.8716  19.9    0.3	4U 1700-377
256.6186 -36.4836   10.3  34.7  132.1   0.3620   1.1    9.6	GX 349+2
264.6840 -44.5161    6.1  30.9  149.4   0.4583   1.9    4.7	4U 1735-44
270.0995 -25.7182    4.3  49.4  140.7   2.2709   2.7   11.1	GRS 1758-258
275.9492 -30.3801    3.8  47.6  149.7   1.9779   3.1    1.5	H1820-303
263.0936 -33.7801    3.1  39.5  137.9   1.6295   3.7    6.2	GX 354-0
100.8568 -72.1306    4.3  37.9  -76.4   1.2753   2.7 ------	UNKNOWN
Pre-slew background subtracted image of 15-350 keV band
Time interval of the image:
-15.620000 12.724600

# RAcent  DECcent POSerr Theta    Phi  PeakCts   SNR AngSep     Name
#  [deg]    [deg]    ['] [deg]  [deg]                   [']
135.5914 -40.6457    6.9  52.5  -29.1  -1.0249  -1.7    6.2	Vela X-1
170.0785 -60.5235    9.7  23.5  -26.7   0.2166   1.2    9.2	Cen X-3
186.8264 -62.8329   19.0  15.4  -22.3  -0.1002  -0.6    6.0	GX 301-2
255.8773 -38.0027    0.0  33.1  132.3  -0.0912  -0.3   10.8	4U 1700-377
256.3619 -36.3702    7.9  34.7  131.7  -0.4337  -1.5    4.8	GX 349+2
264.5414 -44.4878    7.5  30.9  149.2   0.3119   1.5    8.9	4U 1735-44
270.2711 -25.6254    7.0  49.6  140.8  -1.1831  -1.6    7.3	GRS 1758-258
275.7591 -30.2970   15.3  47.6  149.4   0.3745   0.8    9.6	H1820-303
262.8141 -33.7397   18.1  39.4  137.6  -0.2155  -0.6   10.4	GX 354-0
177.3180 -34.1619    2.3  40.3   14.7   1.2938   5.1 ------	UNKNOWN
312.8135 -78.3818    0.1  28.3 -126.9  20.2619  98.1 ------	UNKNOWN
 25.2160 -84.9394    2.3  30.6 -104.6   1.3437   5.1 ------	UNKNOWN
351.3965 -64.4088    2.2  46.1 -129.2   3.9482   5.4 ------	UNKNOWN
Post-slew image of 15-350 keV band
Time interval of the image:
64.924600 962.284200

# RAcent  DECcent POSerr Theta    Phi  PeakCts   SNR AngSep     Name
#  [deg]    [deg]    ['] [deg]  [deg]                   [']
170.5075 -60.5390    4.6  39.3   30.0   2.0439   2.5    7.6	Cen X-3
186.5919 -62.7351    3.6  35.3   41.4   2.3722   3.2    2.8	GX 301-2
264.6533 -44.4970   16.1  38.5  123.1   0.8682   0.7    4.8	4U 1735-44
223.7676 -74.4239    2.9  19.2   56.4   1.8542   4.0 ------	UNKNOWN
312.7271 -78.3658    2.4   0.0  115.0   2.1635   4.8 ------	UNKNOWN
 39.5171 -71.9148    4.1  20.8  -59.0   1.3135   2.8 ------	UNKNOWN
 67.6217 -48.7465    5.1  47.1  -53.1   6.6921   2.3 ------	UNKNOWN