Analysis Summary
Notes:
- 1) No attempt has been made to eliminate the non-significant decimal places.
- 2) This batgrbproduct analysis is done using the HEASARC data.
- 3) This batgrbproduct analysis is using the flight position for the mask-weighting calculation.
======================================================================
BAT GRB EVENT DATA PROCESSING REPORT
Process Script Ver: batgrbproduct v2.46
Process Start Time: Mon Jan 20 09:48:20 EST 2014
Host Name: batevent1
Current Working Dir: /local/data/batevent/batevent_reproc/trigger279494
======================================================================
Trigger: 00279494 Segment: 000
BAT Trigger Time: 201093660.352 [s; MET]
Trigger Stop: 201093663.424 [s; MET]
UTC: 2007-05-17T11:20:58.391320 [includes UTCF correction]
Where From?: TDRSS position message
BAT
RA: 277.579460915099 Dec: -62.3326989655416 [deg; J2000]
Catalogged Source?: NO
Point Source?: YES
GRB Indicated?: YES [ by BAT flight software ]
Image S/N Ratio: 8
Image Trigger?: NO
Rate S/N Ratio: 11.2694276695846 [ if not an image trigger ]
Image S/N Ratio: 8
Analysis Position: [ source = BAT ]
RA: 277.579460915099 Dec: -62.3326989655416 [deg; J2000]
Refined Position: [ source = BAT pre-slew burst ]
RA: 277.561816884082 Dec: -62.3057749272213 [deg; J2000]
{ 18h 30m 14.8s , -62d 18' 20.8" }
+/- 1.91741640538169 [arcmin] (estimated 90% radius based on SNR)
+/- 0.597992521740332 [arcmin] (formal 1-sigma fit error)
SNR: 12.0015614472974
Angular difference between the analysis and refined position is 1.688641 arcmin
Partial Coding Fraction: 0.671875 [ including projection effects ]
Duration
T90: 7.82400000095367 +/- 1.63497403007117
Measured from: 0.939999997615814
to: 8.76399999856949 [s; relative to TRIGTIME]
T50: 3.99600002169609 +/- 0.995021597520976
Measured from: 1.89599999785423
to: 5.89200001955032 [s; relative to TRIGTIME]
Fluence
Peak Flux (peak 1 second)
Measured from: 1.36399999260902
to: 2.36399999260902 [s; relative to TRIGTIME]
Total Fluence
Measured from: 0.648000001907349
to: 9.17599999904633 [s; relative to TRIGTIME]
Band 1 Band 2 Band 3 Band 4
15-25 25-50 50-100 100-350 keV
Total 0.152655 0.151012 0.086244 0.009892
0.019997 0.019085 0.016110 0.013979 [error]
Peak 0.045281 0.035517 0.029055 0.002773
0.006988 0.006757 0.005644 0.004940 [error]
[ fluence units of on-axis counts / fully illuminated detector ]
======================================================================
====== Table of the duration information =============================
Value tstart tstop
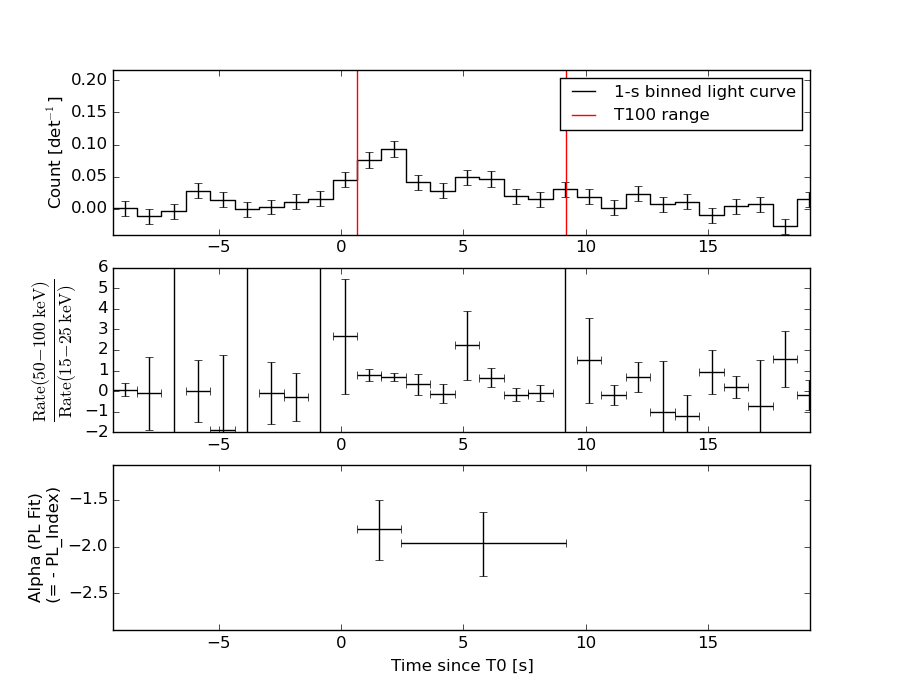
T100 8.528 0.648 9.176
T90 7.824 0.940 8.764
T50 3.996 1.896 5.892
Peak 1.000 1.364 2.364
====== Spectral Analysis Summary =====================================
Model : spectral model: simple power-law (PL) and cutoff power-law (CPL)
Ph_index : photon index: E^{Ph_index}
Ph_90err : 90% error of the photon index
Epeak : Epeak in keV
Epeak_90err: 90% error of Epeak
Norm : normalization at 50 keV in both the PL model and CPL model
Nomr_90err : 90% error of the normalization
chi2 : Chi-Squared
dof : degree of freedo
=== Time-averaged spectral analysis ===
(Best model with acceptable fit: N/A)
Model Ph_index Ph_90err_low Ph_90err_hi Epeak Epeak_90err_low Epeak_90err_hi Norm Nomr_90err_low Norm_90err_hi chi2 dof
PL -1.908 -0.255 0.242 - - - 2.79e-03 -4.60e-04 4.49e-04 73.080 57
CPL -1.180 -0.911 1.332 46.357 N/A N/A 7.40e-03 N/A N/A 71.630 56
=== 1-s peak spectral analysis ===
(Best model with acceptable fit: PL)
Model Ph_index Ph_90err_low Ph_90err_hi Epeak Epeak_90err_low Epeak_90err_hi Norm Nomr_90err_low Norm_90err_hi chi2 dof
PL -1.804 -0.331 0.313 - - - 6.65e-03 -1.36e-03 1.32e-03 62.960 57
CPL -1.556 -0.780 1.323 80.967 N/A N/A 9.11e-03 N/A N/A 62.810 56
=== Fluence/Peak Flux Summary ===
Model Band1 Band2 Band3 Band4 Band5 Total
15-25 25-50 50-100 100-350 15-150 15-350 keV
Fluence PL 4.46e-08 6.39e-08 6.82e-08 1.35e-07 2.19e-07 3.11e-07 erg/cm2
90%_error_low -8.58e-09 -8.65e-09 -1.50e-08 -5.10e-08 -3.48e-08 -6.91e-08 erg/cm2
90%_error_hi 8.86e-09 8.65e-09 1.53e-08 6.89e-08 3.57e-08 8.28e-08 erg/cm2
Peak flux PL 3.67e-01 3.09e-01 1.77e-01 1.50e-01 9.18e-01 1.00e+00 ph/cm2/s
90%_error_low -9.57e-02 -5.41e-02 -4.65e-02 -6.56e-02 -1.61e-01 -1.76e-01 ph/cm2/s
90%_error_hi 1.01e-01 5.39e-02 4.67e-02 9.11e-02 1.61e-01 1.77e-01 ph/cm2/s
Fluence CPL 4.21e-08 6.97e-08 6.53e-08 3.97e-08 2.01e-07 2.17e-07 erg/cm2
90%_error_low -9.59e-09 -1.31e-08 -1.95e-08 N/A -3.92e-08 -5.29e-08 erg/cm2
90%_error_hi 9.61e-09 1.24e-08 1.74e-08 N/A 4.25e-08 1.21e-07 erg/cm2
Peak flux CPL 3.56e-01 3.18e-01 1.78e-01 1.08e-01 9.09e-01 9.59e-01 ph/cm2/s
90%_error_low -1.10e-01 -6.15e-02 -4.86e-02 -1.08e-01 -1.66e-01 -1.98e-01 ph/cm2/s
90%_error_hi 1.10e-01 6.90e-02 4.98e-02 8.68e-02 1.65e-01 2.12e-01 ph/cm2/s
======================================================================
Image
Pre-slew 15.0-350.0 keV image (Event data)

#   RAcent    DECcent   POSerr    Theta     Phi              Peak Cts       SNR   Name
  277.5618   -62.3058   0.0161    22.0118  -100.5814         0.4240162     12.002 TRIG_00279494

Foreground time interval of the image:
  0.648   9.176 (delta_t =   8.528 [sec])
Background time interval of the image:
-239.352   0.648 (delta_t = 240.000 [sec])
Light Curves
Note: The mask-weighted lightcurves have units of either count/det or counts/sec/det, where a det is 0.4 x 0.4 = 0.16 sq cm.
Full-time range; 1 s binning
Other quick-look light curves:
- 64 ms binning (zoomed)
- 16 ms binning (zoomed)
- 8 ms binning (zoomed)
- 2 ms binning (zoomed)
- SN=5 or 10 s binning (full-time range)
- Raw light curve
Spectra
- 64 ms binning (zoomed)
- 16 ms binning (zoomed)
- 8 ms binning (zoomed)
- 2 ms binning (zoomed)
- SN=5 or 10 s binning (full-time range)
- Raw light curve
Spectra
Notes:
- 1) The fitting includes the systematic errors.
- 2) When the burst includes telescope slew time periods, the fitting uses an average response file made from multiple 5-s response files through out the slew time plus single time preiod for the non-slew times, and weighted by the total counts in the corresponding time period using addrmf. An average response file is needed becuase a spectral fit using the pre-slew DRM will introduce some errors in both a spectral shape and a normalization if the PHA file contains a lot of the slew/post-slew time interval.
- 3) For fits to more complicated models (e.g. a power-law over a cutoff power-law), the BAT team has decided to require a chi-square improvement of more than 6 for each extra dof.
Time averaged spectrum fit using the average DRM
Power-law model

Time interval is from    0.648 sec. to    9.176 sec.

Spectral model in power-law:
------------------------------------------------------------
Parameters  : value       lower 90%   higher 90%
Photon index: -1.90761     ( -0.25493   0.242214 )
Norm@50keV  : 2.78739E-03    ( -0.000460336   0.000449233 )
------------------------------------------------------------
#Fit statistic : Chi-Squared =          73.08 using 59 PHA bins.
# Reduced chi-squared =          1.282 for     57 degrees of freedom
# Null hypothesis probability =   7.419871e-02

Photon flux (15-150 keV)    in 8.528 sec: 0.401343 ( -0.054515  0.054543 ) ph/cm2/s
Energy fluence (15-150 keV)             : 2.18598e-07 ( -3.4789e-08  3.5673e-08 ) ergs/cm2
Cutoff power-law model

Time interval is from    0.648 sec. to    9.176 sec.
Spectral model in the cutoff power-law:
------------------------------------------------------------
Parameters  : value       lower 90%   higher 90%
Photon index: -1.18031     ( -0.910739   1.33211 )
Epeak [keV] : 46.3573      (   )
Norm@50keV  : 7.39784E-03    (     )
------------------------------------------------------------
#Fit statistic : Chi-Squared =          71.63 using 59 PHA bins.
# Reduced chi-squared =          1.279 for     56 degrees of freedom
# Null hypothesis probability =   7.784088e-02

Photon flux (15-150 keV)    in 8.528 sec: 0.390248 ( -0.056558  0.056663 ) ph/cm2/s
Energy fluence (15-150 keV)             : 2.01483e-07 ( -3.91568e-08  4.25441e-08 ) ergs/cm2
1-s peak spectrum fit
Power-law model

Time interval is from    1.364 sec. to    2.364 sec.

Spectral model in power-law:
------------------------------------------------------------
Parameters  : value       lower 90%   higher 90%
Photon index: -1.80367     ( -0.330495   0.312665 )
Norm@50keV  : 6.65175E-03    ( -0.00136086   0.00131589 )
------------------------------------------------------------
#Fit statistic : Chi-Squared =          62.96 using 59 PHA bins.
# Reduced chi-squared =          1.105 for     57 degrees of freedom
# Null hypothesis probability =   2.735556e-01

Photon flux (15-150 keV)    in 1 sec: 0.917953 ( -0.16092  0.161087 ) ph/cm2/s
Energy fluence (15-150 keV)             : 6.12379e-08 ( -1.24413e-08  1.27601e-08 ) ergs/cm2
Cutoff power-law model

Time interval is from    1.364 sec. to    2.364 sec.
Spectral model in the cutoff power-law:
------------------------------------------------------------
Parameters  : value       lower 90%   higher 90%
Photon index: -1.55592     ( -0.780385   1.32302 )
Epeak [keV] : 80.9671      (   )
Norm@50keV  : 9.10709E-03    (     )
------------------------------------------------------------
#Fit statistic : Chi-Squared =          62.81 using 59 PHA bins.
# Reduced chi-squared =          1.122 for     56 degrees of freedom
# Null hypothesis probability =   2.476956e-01

Photon flux (15-150 keV)    in 1 sec: 0.909293 ( -0.165585  0.165187 ) ph/cm2/s
Energy fluence (15-150 keV)             : 5.98591e-08 ( -1.35453e-08  1.37379e-08 ) ergs/cm2
Time-resolved spectra
Distribution
T90 vs. Hardness ratio plot

T90                                   = N/A sec.
Hardness ratio (energy fluence ratio) = N/A
S(15-50 keV) vs. S(50-150 keV) plot

S(15-50 keV)  = N/A
S(50-150 keV) = N/A
The dash-dotted line and the dashed line traces the fluences calculated from the Band function with Epeak = 15 and 150 keV, respectively. Both lines assume a canonical values of alpha = -1 and beta = -2.5.
Mask shadow pattern

IMX = -7.423612127503768E-02, IMY = 3.973917185799377E-01
Spacecraft aspect plot

Bright source in the pre-burst/pre-slew/post-slew images
Pre-burst image of 15-350 keV band
Time interval of the image:
-239.352000 0.648000

# RAcent  DECcent POSerr Theta    Phi  PeakCts   SNR AngSep     Name
#  [deg]    [deg]    ['] [deg]  [deg]                   [']
170.2689 -60.6673   13.0  47.4  -26.8   0.3721   0.9    3.0	Cen X-3
186.6668 -62.7726    1.0  39.4  -27.1   3.6507  11.8    0.3	GX 301-2
244.9837 -15.6362    0.4  30.8   99.2  10.5566  27.6    0.3	Sco X-1
255.9556 -37.8404    1.0   8.6  134.6   2.0042  11.4    1.5	4U 1700-377
256.3954 -36.4878    3.8  10.0  133.8   0.5636   3.0    4.3	GX 349+2
262.9489 -24.9325    4.2  22.8  139.0   0.6111   2.7   11.7	GX 1+4
264.6676 -44.5447    4.9   9.2 -161.8   0.4696   2.4    6.5	4U 1735-44
268.4258  -1.5451    9.2  46.7  135.2  -1.0778  -1.3    6.5	SW J1753.5-0127
270.2792 -25.1727    1.9  25.5  153.9   1.3769   6.1    5.6	GX 5-1
270.2210 -25.7541    3.7  25.0  154.5   0.6867   3.2    4.5	GRS 1758-258
273.9549 -13.9452    6.1  37.0  149.5   0.7124   1.9    6.2	GX 17+2
275.9517 -30.3839    2.3  24.4  170.9   1.0010   5.1    1.7	H1820-303
285.1063 -25.0305    6.7  33.8  175.5  -0.4013  -1.7    7.6	HT1900.1-2455
263.0010 -33.8058    1.3  14.8  151.3   1.6084   8.6    1.8	GX 354-0
195.9004 -51.5203    2.3  36.4   -7.7   1.2973   5.0 ------	UNKNOWN
149.2169 -71.5517    2.6  50.7  -44.4   5.0537   4.4 ------	UNKNOWN
324.0901 -46.9736    2.6  48.0 -129.0   4.2905   4.4 ------	UNKNOWN
Pre-slew background subtracted image of 15-350 keV band
Time interval of the image:
0.648000 9.176000

# RAcent  DECcent POSerr Theta    Phi  PeakCts   SNR AngSep     Name
#  [deg]    [deg]    ['] [deg]  [deg]                   [']
170.2759 -60.7079    3.0  47.4  -26.9   0.2296   3.8    5.2	Cen X-3
186.3725 -62.7093    4.2  39.6  -27.1   0.1242   2.7    8.6	GX 301-2
244.9166 -15.5025    6.9  30.9   99.1  -0.0875  -1.7    9.0	Sco X-1
255.9822 -37.9348    6.6   8.6  134.9  -0.0506  -1.8    5.4	4U 1700-377
256.3304 -36.4783    8.1  10.0  133.5   0.0411   1.4    6.1	GX 349+2
262.9469 -24.9334    0.0  22.8  139.0  -0.0498  -1.6   11.8	GX 1+4
264.6447 -44.3409   35.3   9.2 -163.1   0.0090   0.3    7.8	4U 1735-44
268.3294  -1.4107    5.7  46.8  135.0  -0.2925  -2.0    3.4	SW J1753.5-0127
270.0857 -25.0246    7.4  25.5  153.4  -0.0552  -1.6   11.3	GX 5-1
270.2505 -25.9327    0.0  24.8  154.8   0.0696   2.1   11.7	GRS 1758-258
273.9994 -14.0215    5.3  37.0  149.7  -0.1108  -2.2    1.0	GX 17+2
275.9777 -30.1822    5.0  24.5  170.6  -0.0732  -2.3   11.4	H1820-303
284.9320 -24.9581   14.3  33.8  175.2  -0.0302  -0.8    6.1	HT1900.1-2455
262.8868 -33.8446    7.1  14.7  151.0  -0.0447  -1.6    5.1	GX 354-0
287.5058  -4.3830    2.6  51.8  159.8   0.5571   4.4 ------	UNKNOWN
221.0013 -52.2546    2.4  21.0   -6.8   0.1353   4.8 ------	UNKNOWN
277.5618 -62.3058    1.0  22.0 -100.6   0.4240  12.0 ------	UNKNOWN
Post-slew image of 15-350 keV band
Time interval of the image:
88.948600 962.701900

# RAcent  DECcent POSerr Theta    Phi  PeakCts   SNR AngSep     Name
#  [deg]    [deg]    ['] [deg]  [deg]                   [']
170.6898 -60.6550   11.6  45.1    6.8  -0.9252  -1.0   11.2	Cen X-3
186.6463 -62.7722    0.4  38.4   12.8  18.3016  25.6    0.3	GX 301-2
255.9866 -37.8441    1.1  27.8  106.9   7.3086  10.2    0.0	4U 1700-377
256.4354 -36.4231   20.4  29.0  108.6   0.4336   0.6    0.0	GX 349+2
262.8650 -24.7929    7.6  38.8  123.8   1.9474   1.5    8.3	GX 1+4
264.7858 -44.2888   32.6  19.5  117.0   0.1781   0.4    9.8	4U 1735-44
270.2842 -25.0791    3.9  37.6  134.5   3.5945   3.0    0.0	GX 5-1
270.3023 -25.7432   25.0  36.9  134.4   0.5466   0.5    0.0	GRS 1758-258
274.0411 -14.1339    3.1  48.3  140.8   7.7577   3.7    6.2	GX 17+2
275.8493 -30.2342    6.7  32.1  142.6   1.4566   1.7    8.9	H1820-303
285.1135 -24.9908   10.0  37.7  156.6  -1.2769  -1.2    6.0	HT1900.1-2455
262.9389 -33.8488    1.9  30.0  120.5   4.2263   5.9    2.6	GX 354-0
318.4069 -11.0732    3.7  59.0 -166.2  13.2392   3.1 ------	UNKNOWN
336.7329 -27.2760    3.7  51.9 -138.7  11.4273   3.2 ------	UNKNOWN