Analysis Summary
Notes:
- 1) No attempt has been made to eliminate the non-significant decimal places.
- 2) This batgrbproduct analysis is done using the HEASARC data.
- 3) This batgrbproduct analysis is using the flight position for the mask-weighting calculation.
======================================================================
                  BAT GRB EVENT DATA PROCESSING REPORT
    Process Script Ver: batgrbproduct v2.46
    Process Start Time: Mon Jan 20 09:36:20 EST 2014
             Host Name: batevent1
   Current Working Dir: /local/data/batevent/batevent_reproc/trigger279817
======================================================================

  Trigger: 00279817      Segment: 000

  BAT Trigger Time: 201359112   [s; MET]
      Trigger Stop: 201359200   [s; MET]
               UTC: 2007-05-20T13:05:10.032620    [includes UTCF correction]
       Where From?: TDRSS position message

  BAT
    RA: 193.315762479148   Dec: 74.9932499437833  [deg; J2000]

     Catalogged Source?: NO
     Point Source?:      YES
     GRB Indicated?:     YES    [ by BAT flight software ]
     Image S/N Ratio:    7.99
     Image Trigger?:     YES
     Rate S/N Ratio:     0  [ if not an image trigger ]
     Image S/N Ratio:    7.99

  Analysis Position:   [ source = BAT ]
    RA: 193.315762479148   Dec: 74.9932499437833  [deg; J2000]

  Refined Position:   [ source = BAT pre-slew burst ]
    RA: 193.246676731048   Dec: 74.9823607272786  [deg; J2000]
        { 12h 52m 59.2s , +74d 58' 56.5" }
         +/- 2.29381524787782 [arcmin] (estimated 90% radius based on SNR)
         +/- 1.23342792493352 [arcmin] (formal 1-sigma fit error)
    SNR: 9.29041043723796

  Angular difference between the analysis and refined position is 1.256857 arcmin

  Partial Coding Fraction: 0.671875    [ including projection effects ]

  Duration
     T90: 48 +/- 22.6274169979695
        Measured from: 17
                   to: 65     [s; relative to TRIGTIME]
     T50: 16 +/- 22.6274169979695
        Measured from: 33
                   to: 49     [s; relative to TRIGTIME]


  Fluence
     Peak Flux  (peak 1 second)
        Measured from: 40.5
                   to: 41.5     [s; relative to TRIGTIME]
     Total Fluence
        Measured from: 17
                   to: 65     [s; relative to TRIGTIME]

             Band 1     Band 2     Band 3     Band 4
              15-25      25-50     50-100    100-350     keV
 Total     0.180775   0.253577   0.190244  -0.035764
           0.039642   0.040868   0.035558   0.030616 [error]
 Peak      0.010961   0.012986   0.001422   0.008705
           0.005768   0.005922   0.005222   0.004378 [error]

     [ fluence units of on-axis counts / fully illuminated detector ]

======================================================================


====== Table of the duration information =============================

        Value   tstart    tstop
T100   48.000   17.000   65.000
T90    48.000   17.000   65.000
T50    16.000   33.000   49.000
Peak    1.000   40.500   41.500


====== Spectral Analysis Summary =====================================

Model      : spectral model: simple power-law (PL) and cutoff power-law (CPL)
Ph_index   : photon index: E^{Ph_index}
Ph_90err   : 90% error of the photon index
Epeak      : Epeak in keV
Epeak_90err: 90% error of Epeak
Norm       : normalization at 50 keV in both the PL model and CPL model
Nomr_90err : 90% error of the normalization
chi2       : Chi-Squared
dof        : degree of freedo

=== Time-averaged spectral analysis ===
(Best model with acceptable fit: N/A)

Model Ph_index Ph_90err_low Ph_90err_hi  Epeak  Epeak_90err_low  Epeak_90err_hi  Norm       Nomr_90err_low    Norm_90err_hi    chi2    dof
PL      -1.687    -0.314      0.296       -           -               -         8.57e-04     -1.75e-04          1.71e-04      82.960   57
CPL     -0.286    -1.217      1.640       60.264     -15.095        68.505      4.45e-03     -4.45e-03          2.35e-02      78.940   56


=== 1-s peak spectral analysis ===
(Best model with acceptable fit: N/A)

Model Ph_index Ph_90err_low Ph_90err_hi  Epeak  Epeak_90err_low  Epeak_90err_hi  Norm       Nomr_90err_low    Norm_90err_hi    chi2    dof
PL      -2.395     -2.177     1.272       -           -               -         1.29e-03     -1.29e-03          1.32e-03      38.320   57
CPL     -1.868      N/A       N/A           7.552      N/A           N/A         3.02e-03        N/A               N/A         38.360   56


=== Fluence/Peak Flux Summary ===

              Model    Band1     Band2     Band3     Band4     Band5     Total
                       15-25     25-50    50-100    100-350    15-150    15-350    keV
Fluence         PL   6.26e-08  1.03e-07  1.27e-07  3.14e-07  3.81e-07  6.07e-07   erg/cm2
      90%_error_low -1.64e-08 -1.89e-08 -3.36e-08 -1.39e-07 -8.02e-08 -1.79e-07   erg/cm2
      90%_error_hi   1.74e-08  1.89e-08  3.39e-08  1.94e-07  8.21e-08  2.22e-07   erg/cm2
Peak flux       PL   1.27e-01  7.55e-02  2.87e-02  1.46e-02  2.39e-01  2.45e-01   ph/cm2/s
      90%_error_low -8.89e-02 -7.55e-02 -2.87e-02 -1.46e-02 -1.43e-01 -1.48e-01   ph/cm2/s
      90%_error_hi   9.20e-02  5.00e-02  4.45e-02  8.07e-02  1.44e-01  1.54e-01   ph/cm2/s

Fluence        CPL   5.01e-08  1.19e-07  1.39e-07  7.10e-08  3.57e-07  3.77e-07   erg/cm2
      90%_error_low -2.02e-08 -2.37e-08 -3.98e-08 -5.21e-08 -7.75e-08 -9.26e-08   erg/cm2
      90%_error_hi   2.07e-08  2.48e-08  4.07e-08  1.81e-07  8.29e-08  1.88e-07   erg/cm2
Peak flux      CPL   1.20e-01  6.02e-02  1.94e-02  9.58e-03  2.05e-01  2.13e-01   ph/cm2/s
      90%_error_low -1.01e-01 -6.02e-02 -1.94e-02     N/A   -2.05e-01     N/A     ph/cm2/s
      90%_error_hi   9.72e-02  1.12e-01  5.32e-02     N/A    1.75e-01     N/A     ph/cm2/s

======================================================================
Image
Pre-slew 15.0-350.0 keV image (Event data)
#   RAcent    DECcent   POSerr    Theta     Phi              Peak Cts       SNR   Name
  193.2467    74.9824   0.0208    30.0333  -139.1017         0.7066714      9.290 TRIG_00279817

Foreground time interval of the image:
 17.000  65.000 (delta_t =  48.000 [sec])
Background time interval of the image:
-239.000  17.000 (delta_t = 256.000 [sec])
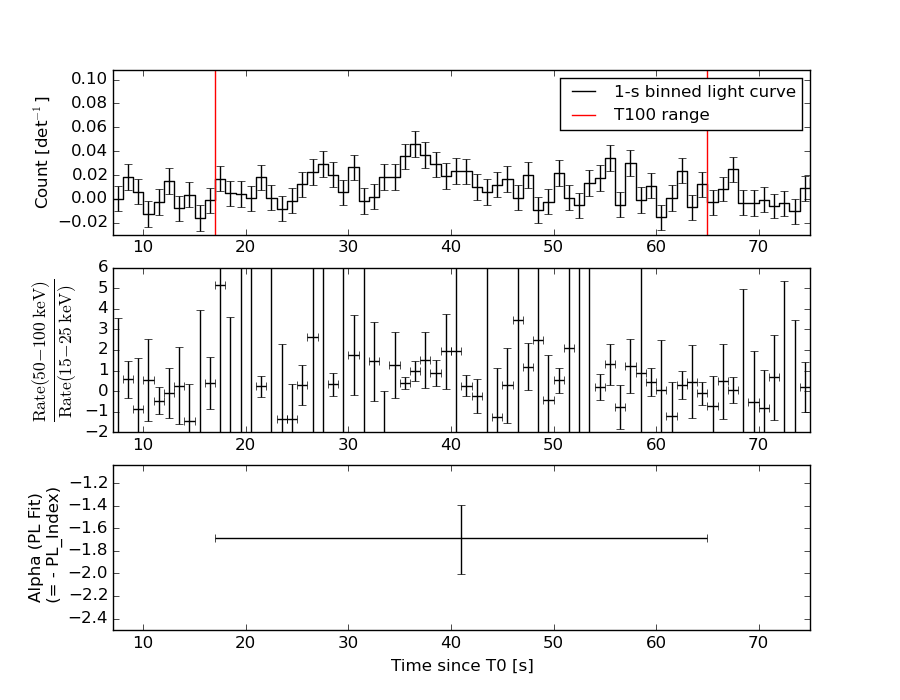
Light Curves
Note: The mask-weighted lightcurves have units of either count/det or counts/sec/det, where a det is 0.4 x 0.4 = 0.16 sq cm.
Full-time range; 1 s binning
Other quick-look light curves:
- 64 ms binning (zoomed)
- 16 ms binning (zoomed)
- 8 ms binning (zoomed)
- 2 ms binning (zoomed)
- SN=5 or 10 s binning (full-time range)
- Raw light curve
Spectra
- 64 ms binning (zoomed)
- 16 ms binning (zoomed)
- 8 ms binning (zoomed)
- 2 ms binning (zoomed)
- SN=5 or 10 s binning (full-time range)
- Raw light curve
Spectra
Notes:
- 1) The fitting includes the systematic errors.
- 2) When the burst includes telescope slew time periods, the fitting uses an average response file made from multiple 5-s response files through out the slew time plus single time preiod for the non-slew times, and weighted by the total counts in the corresponding time period using addrmf. An average response file is needed becuase a spectral fit using the pre-slew DRM will introduce some errors in both a spectral shape and a normalization if the PHA file contains a lot of the slew/post-slew time interval.
- 3) For fits to more complicated models (e.g. a power-law over a cutoff power-law), the BAT team has decided to require a chi-square improvement of more than 6 for each extra dof.
Time averaged spectrum fit using the average DRM
Power-law model
Time interval is from   17.000 sec. to   65.000 sec.

Spectral model in power-law:
------------------------------------------------------------
Parameters  : value       lower 90%   higher 90%
Photon index: -1.68686     ( -0.314407   0.296093 )
Norm@50keV  : 8.56514E-04    ( -0.000174809   0.00017127 )
------------------------------------------------------------
#Fit statistic : Chi-Squared =          82.96 using 59 PHA bins.
# Reduced chi-squared =          1.455 for     57 degrees of freedom
# Null hypothesis probability =   1.398058e-02

Photon flux (15-150 keV)    in 48 sec: 0.113241 ( -0.0208666  0.020884 ) ph/cm2/s
Energy fluence (15-150 keV)             : 3.81128e-07 ( -8.02152e-08  8.2128e-08 ) ergs/cm2
Cutoff power-law model
Time interval is from   17.000 sec. to   65.000 sec.
Spectral model in the cutoff power-law:
------------------------------------------------------------
Parameters  : value       lower 90%   higher 90%
Photon index: -0.2864     ( -1.21252   1.64508 )
Epeak [keV] : 60.2639      ( -15.1482 68.4521 )
Norm@50keV  : 4.45373E-03    ( -0.00443099   0.0235248 )
------------------------------------------------------------
#Fit statistic : Chi-Squared =          78.94 using 59 PHA bins.
# Reduced chi-squared =          1.410 for     56 degrees of freedom
# Null hypothesis probability =   2.338838e-02

Photon flux (15-150 keV)    in 48 sec: 0.108143 ( -0.0212538  0.021387 ) ph/cm2/s
Energy fluence (15-150 keV)             : 3.56715e-07 ( -7.74984e-08  8.28686e-08 ) ergs/cm2
1-s peak spectrum fit
Power-law model
Time interval is from   40.500 sec. to   41.500 sec.

Spectral model in power-law:
------------------------------------------------------------
Parameters  : value       lower 90%   higher 90%
Photon index: -2.39475     ( -2.17692   1.27189 )
Norm@50keV  : 1.29292E-03    ( -0.00129292   0.00131773 )
------------------------------------------------------------
#Fit statistic : Chi-Squared =          38.32 using 59 PHA bins.
# Reduced chi-squared =         0.6723 for     57 degrees of freedom
# Null hypothesis probability =   9.727926e-01

Photon flux (15-150 keV)    in 1 sec: 0.238518 ( -0.142601  0.143539 ) ph/cm2/s
Energy fluence (15-150 keV)             : 1.26e-08 ( -8.83123e-09  1.15413e-08 ) ergs/cm2
Cutoff power-law model
Time interval is from   40.500 sec. to   41.500 sec.
Spectral model in the cutoff power-law:
------------------------------------------------------------
Parameters  : value       lower 90%   higher 90%
Photon index: -1.86816     (       )
Epeak [keV] : 7.55164      (   )
Norm@50keV  : 3.02354E-03    (     )
------------------------------------------------------------
#Fit statistic : Chi-Squared =          38.36 using 59 PHA bins.
# Reduced chi-squared =         0.6851 for     56 degrees of freedom
# Null hypothesis probability =   9.654584e-01

Photon flux (15-150 keV)    in 1 sec: 0.204819 ( -0.204819  0.175445 ) ph/cm2/s
Energy fluence (15-150 keV)             : 9.94008e-09 ( 0  0 ) ergs/cm2
Time-resolved spectra
Distribution
T90 vs. Hardness ratio plot
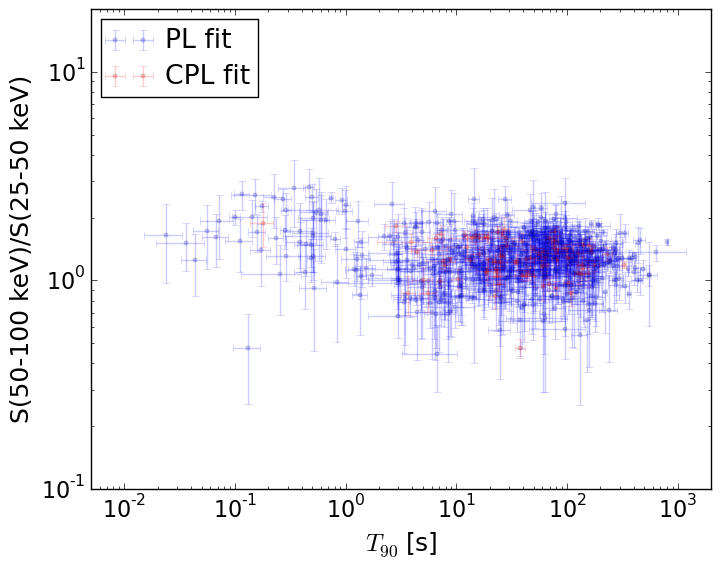
T90                                   = N/A sec.
Hardness ratio (energy fluence ratio) = N/A
S(15-50 keV) vs. S(50-150 keV) plot
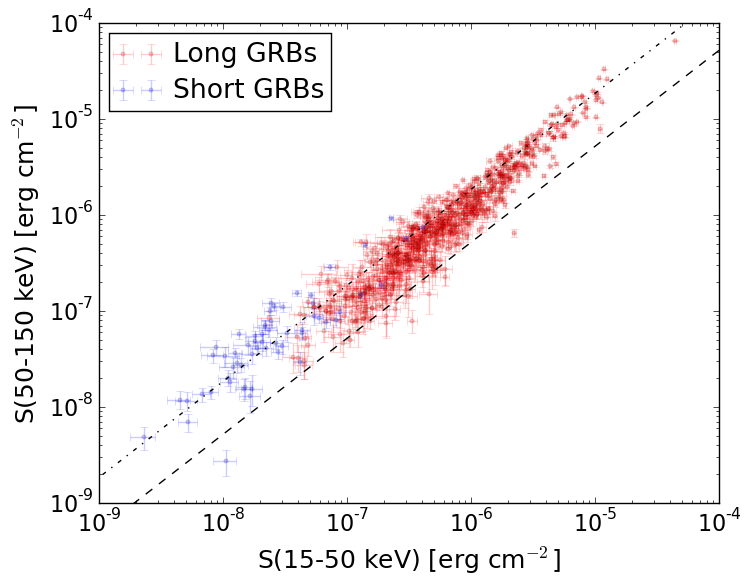
S(15-50 keV)  = N/A
S(50-150 keV) = N/A
The dash-dotted line and the dashed line traces the fluences calculated from the Band function with Epeak = 15 and 150 keV, respectively. Both lines assume a canonical values of alpha = -1 and beta = -2.5.
Mask shadow pattern
IMX = -4.369901669129268E-01, IMY = 3.785099723256006E-01
Spacecraft aspect plot
Bright source in the pre-burst/pre-slew/post-slew images
Pre-burst image of 15-350 keV band
Time interval of the image:
-239.000000 17.000000

# RAcent  DECcent POSerr Theta    Phi  PeakCts   SNR AngSep     Name
#  [deg]    [deg]    ['] [deg]  [deg]                   [']
254.4170  35.3298    0.8  20.0   67.3   2.7174  13.8    2.1	Her X-1
288.7710  10.9553    3.1  51.9   22.8   3.0028   3.8    1.7	GRS 1915+105
299.5847  35.1981    0.5  36.8   -8.3   5.6384  24.8    0.3	Cyg X-1
308.1722  40.8349    6.2  37.7  -22.8  -0.4460  -1.9    7.6	Cyg X-3
326.0246  38.4219    0.0  49.4  -33.8  -0.7433  -1.4    9.2	Cyg X-2
308.0445  37.6203    1.3  39.8  -18.9   2.1668   8.9 ------	UNKNOWN
Pre-slew background subtracted image of 15-350 keV band
Time interval of the image:
17.000000 65.000000

# RAcent  DECcent POSerr Theta    Phi  PeakCts   SNR AngSep     Name
#  [deg]    [deg]    ['] [deg]  [deg]                   [']
254.4705  35.1791   55.7  20.1   67.2   0.0163   0.2    9.8	Her X-1
288.9143  10.9140    9.1  52.0   22.7  -0.4247  -1.3    7.1	GRS 1915+105
299.5744  35.1551    3.0  36.8   -8.2  -0.3273  -3.8    2.9	Cyg X-1
308.0993  41.1117    4.1  37.5  -23.0  -0.2342  -2.8    9.6	Cyg X-3
326.1607  38.2053   11.9  49.7  -33.7  -0.1802  -1.0    7.0	Cyg X-2
171.4607  45.2101    2.3  50.6 -176.9   0.8019   5.1 ------	UNKNOWN
308.4216  38.8659    2.6  39.2  -20.6   0.3988   4.5 ------	UNKNOWN
193.2466  74.9823    1.3  30.0 -139.1   0.7063   9.3 ------	UNKNOWN
335.5364  62.0106    2.5  40.0  -65.9   0.7912   4.7 ------	UNKNOWN
108.8526  77.3601    2.4  45.6 -122.2   1.3191   4.8 ------	UNKNOWN
Post-slew image of 15-350 keV band
Time interval of the image:
147.500590 244.900600

# RAcent  DECcent POSerr Theta    Phi  PeakCts   SNR AngSep     Name
#  [deg]    [deg]    ['] [deg]  [deg]                   [']
 46.7524  66.4354    3.5  37.0  -70.5   0.6918   3.3 ------	UNKNOWN
108.4683  41.7005    2.9  48.7 -130.7   1.7743   4.0 ------	UNKNOWN