Analysis Summary
Notes:
- 1) No attempt has been made to eliminate the non-significant decimal places.
- 2) This batgrbproduct analysis is done using the HEASARC data.
- 3) This batgrbproduct analysis is using the flight position for the mask-weighting calculation.
======================================================================
                  BAT GRB EVENT DATA PROCESSING REPORT
    Process Script Ver: batgrbproduct v2.46
    Process Start Time: Mon Jan 20 09:27:18 EST 2014
             Host Name: batevent1
   Current Working Dir: /local/data/batevent/batevent_reproc/trigger279935
======================================================================

  Trigger: 00279935      Segment: 000

  BAT Trigger Time: 201423072.832   [s; MET]
      Trigger Stop: 201423073.856   [s; MET]
               UTC: 2007-05-21T06:51:10.863020    [includes UTCF correction]
       Where From?: TDRSS position message

  BAT
    RA: 242.669598820125   Dec: 30.2408523533459  [deg; J2000]

     Catalogged Source?: NO
     Point Source?:      YES
     GRB Indicated?:     YES    [ by BAT flight software ]
     Image S/N Ratio:    11.46
     Image Trigger?:     NO
     Rate S/N Ratio:     25.5538646783613  [ if not an image trigger ]
     Image S/N Ratio:    11.46

  Analysis Position:   [ source = BAT ]
    RA: 242.669598820125   Dec: 30.2408523533459  [deg; J2000]

  Refined Position:   [ source = BAT pre-slew burst ]
    RA: 242.663128504037   Dec: 30.2616873733373  [deg; J2000]
        { 16h 10m 39.2s , +30d 15' 42.1" }
         +/- 1.10630735693076 [arcmin] (estimated 90% radius based on SNR)
         +/- 0.392349514877535 [arcmin] (formal 1-sigma fit error)
    SNR: 26.3292607206725

  Angular difference between the analysis and refined position is 1.294301 arcmin

  Partial Coding Fraction: 0.4726562    [ including projection effects ]

  Duration
     T90: 38.6279999911785 +/- 2.37669014048489
        Measured from: -1.9879999756813
                   to: 36.6400000154972     [s; relative to TRIGTIME]
     T50: 14.6159999966621 +/- 0.304236752863469
        Measured from: 16.3320000171661
                   to: 30.9480000138283     [s; relative to TRIGTIME]


  Fluence
     Peak Flux  (peak 1 second)
        Measured from: 30.4840000271797
                   to: 31.4840000271797     [s; relative to TRIGTIME]
     Total Fluence
        Measured from: -14.5399999916553
                   to: 49.7320000231266     [s; relative to TRIGTIME]

             Band 1     Band 2     Band 3     Band 4
              15-25      25-50     50-100    100-350     keV
 Total     2.757974   4.511302   3.903460   1.105302
           0.059164   0.064072   0.059540   0.048861 [error]
 Peak      0.139071   0.301113   0.306334   0.095467
           0.008459   0.010411   0.010611   0.007460 [error]

     [ fluence units of on-axis counts / fully illuminated detector ]

======================================================================


====== Table of the duration information =============================

        Value   tstart    tstop
T100   64.272  -14.540   49.732
T90    38.628   -1.988   36.640
T50    14.616   16.332   30.948
Peak    1.000   30.484   31.484


====== Spectral Analysis Summary =====================================

Model      : spectral model: simple power-law (PL) and cutoff power-law (CPL)
Ph_index   : photon index: E^{Ph_index}
Ph_90err   : 90% error of the photon index
Epeak      : Epeak in keV
Epeak_90err: 90% error of Epeak
Norm       : normalization at 50 keV in both the PL model and CPL model
Nomr_90err : 90% error of the normalization
chi2       : Chi-Squared
dof        : degree of freedo

=== Time-averaged spectral analysis ===
(Best model with acceptable fit: PL)

Model Ph_index Ph_90err_low Ph_90err_hi  Epeak  Epeak_90err_low  Epeak_90err_hi  Norm       Nomr_90err_low    Norm_90err_hi    chi2    dof
PL      -1.328    -0.037      0.037       -           -               -         1.30e-02     -2.53e-04          2.53e-04      44.690   57
CPL     -1.108    -0.147      0.152      237.680     -72.892       332.072      1.62e-02     -2.14e-03          2.55e-03      38.130   56


=== 1-s peak spectral analysis ===
(Best model with acceptable fit: N/A)

Model Ph_index Ph_90err_low Ph_90err_hi  Epeak  Epeak_90err_low  Epeak_90err_hi  Norm       Nomr_90err_low    Norm_90err_hi    chi2    dof
PL      -0.994     -0.065     0.066       -           -               -         5.71e-02     -2.20e-03          2.20e-03      76.880   57
CPL     -0.528     -0.264     0.280      184.342     -47.820       155.299      9.16e-02     -2.10e-02          2.89e-02      67.390   56


=== Fluence/Peak Flux Summary ===

              Model    Band1     Band2     Band3     Band4     Band5     Total
                       15-25     25-50    50-100    100-350    15-150    15-350    keV
Fluence         PL   9.09e-07  1.86e-06  2.96e-06  1.05e-05  8.21e-06  1.62e-05   erg/cm2
      90%_error_low -3.79e-08 -4.51e-08 -6.48e-08 -5.35e-07 -1.64e-07 -5.60e-07   erg/cm2
      90%_error_hi   3.86e-08  4.51e-08  6.46e-08  5.55e-07  1.64e-07  5.77e-07   erg/cm2
Peak flux       PL   6.36e-04  7.85e-03  8.85e-02  7.95e+00  4.00e-01  7.97e+00   ph/cm2/s
      90%_error_low     N/A       N/A       N/A       N/A       N/A       N/A     ph/cm2/s
      90%_error_hi      N/A       N/A       N/A       N/A       N/A       N/A     ph/cm2/s

Fluence        CPL   7.75e-07  1.02e-06  1.03e-06  2.45e-06  3.31e-06  4.82e-06   erg/cm2
      90%_error_low -7.02e-08 -8.79e-08 -3.93e-08 -1.38e-07 -2.32e-07 -3.00e-07   erg/cm2
      90%_error_hi   4.86e-08  4.57e-08  6.39e-08  1.47e-07  1.96e-07  3.84e-07   erg/cm2
Peak flux      CPL   1.28e+00  2.02e+00  2.10e+00  2.34e+00  6.47e+00  7.75e+00   ph/cm2/s
      90%_error_low -1.40e-01 -1.02e-01 -1.05e-01 -4.81e-01 -2.64e-01 -5.49e-01   ph/cm2/s
      90%_error_hi   1.45e-01  1.02e-01  1.06e-01  6.38e-01  2.64e-01  6.74e-01   ph/cm2/s

======================================================================
Image
Pre-slew 15.0-350.0 keV image (Event data)
#   RAcent    DECcent   POSerr    Theta     Phi              Peak Cts       SNR   Name
  242.6631    30.2617   0.0073    26.3703    91.6197         2.3953797     26.329 TRIG_00279935

Foreground time interval of the image:
-14.540  13.069 (delta_t =  27.609 [sec])
Background time interval of the image:
-98.531 -14.540 (delta_t =  83.991 [sec])
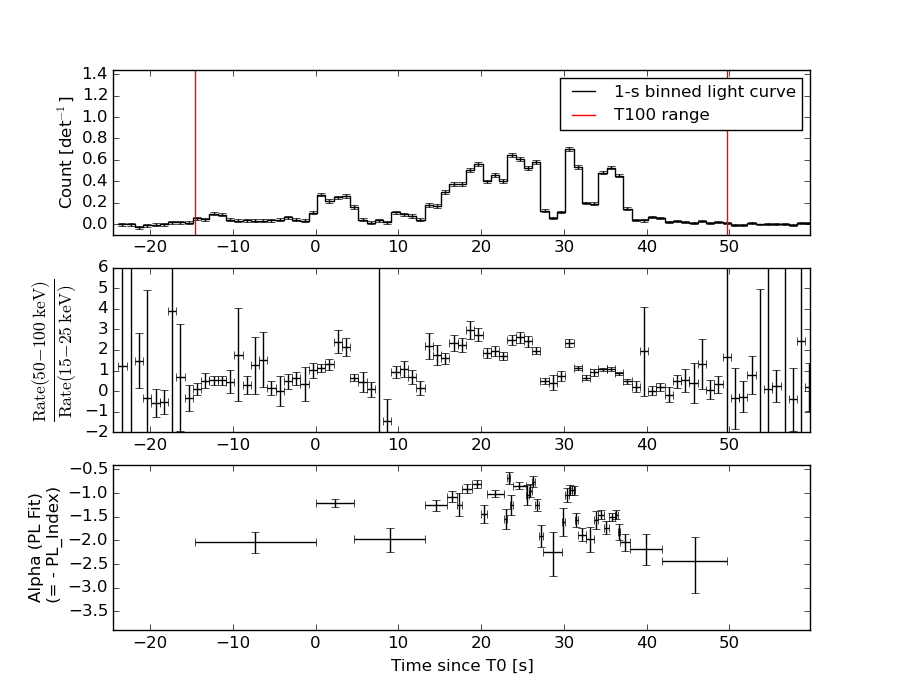
Light Curves
Note: The mask-weighted lightcurves have units of either count/det or counts/sec/det, where a det is 0.4 x 0.4 = 0.16 sq cm.
Full-time range; 1 s binning
Other quick-look light curves:
- 64 ms binning (zoomed)
- 16 ms binning (zoomed)
- 8 ms binning (zoomed)
- 2 ms binning (zoomed)
- SN=5 or 10 s binning (full-time range)
- Raw light curve
Spectra
- 64 ms binning (zoomed)
- 16 ms binning (zoomed)
- 8 ms binning (zoomed)
- 2 ms binning (zoomed)
- SN=5 or 10 s binning (full-time range)
- Raw light curve
Spectra
Notes:
- 1) The fitting includes the systematic errors.
- 2) When the burst includes telescope slew time periods, the fitting uses an average response file made from multiple 5-s response files through out the slew time plus single time preiod for the non-slew times, and weighted by the total counts in the corresponding time period using addrmf. An average response file is needed becuase a spectral fit using the pre-slew DRM will introduce some errors in both a spectral shape and a normalization if the PHA file contains a lot of the slew/post-slew time interval.
- 3) For fits to more complicated models (e.g. a power-law over a cutoff power-law), the BAT team has decided to require a chi-square improvement of more than 6 for each extra dof.
Time averaged spectrum fit using the average DRM
Power-law model
Time interval is from  -14.540 sec. to   49.732 sec.

Spectral model in power-law:
------------------------------------------------------------
Parameters  : value       lower 90%   higher 90%
Photon index: -1.32799     ( -0.0365993   0.036685 )
Norm@50keV  : 1.30047E-02    ( -0.000253416   0.000253279 )
------------------------------------------------------------
#Fit statistic : Chi-Squared =          44.69 using 59 PHA bins.
# Reduced chi-squared =         0.7841 for     57 degrees of freedom
# Null hypothesis probability =   8.818563e-01

Photon flux (15-150 keV)    in 64.27 sec: 1.55979 ( -0.03403  0.03413 ) ph/cm2/s
Energy fluence (15-150 keV)             : 8.20535e-06 ( -1.63643e-07  1.6374e-07 ) ergs/cm2
Cutoff power-law model
Time interval is from  -14.540 sec. to   49.732 sec.
Spectral model in the cutoff power-law:
------------------------------------------------------------
Parameters  : value       lower 90%   higher 90%
Photon index: -1.10835     ( -0.147153   0.152038 )
Epeak [keV] : 237.680      ( -72.8928 332.071 )
Norm@50keV  : 1.61597E-02    ( -0.00213879   0.00254565 )
------------------------------------------------------------
#Fit statistic : Chi-Squared =          38.13 using 59 PHA bins.
# Reduced chi-squared =         0.6809 for     56 degrees of freedom
# Null hypothesis probability =   9.675692e-01

Photon flux (15-150 keV)    in 64.27 sec: 1.53391 ( -0.03767  0.03785 ) ph/cm2/s
Energy fluence (15-150 keV)             : 3.31191e-06 ( -2.31998e-07  1.9616e-07 ) ergs/cm2
1-s peak spectrum fit
Power-law model
Time interval is from   30.484 sec. to   31.484 sec.

Spectral model in power-law:
------------------------------------------------------------
Parameters  : value       lower 90%   higher 90%
Photon index: -0.994289     ( -0.0651752   0.0656374 )
Norm@50keV  : 5.71265E-02    ( -0.00220235   0.00220021 )
------------------------------------------------------------
#Fit statistic : Chi-Squared =          76.88 using 59 PHA bins.
# Reduced chi-squared =          1.349 for     57 degrees of freedom
# Null hypothesis probability =   4.076938e-02

Photon flux (15-150 keV)    in 1 sec: 0.399891 (    ) ph/cm2/s
Energy fluence (15-150 keV)             : 6.19056e-07 ( -2.57756e-08  2.58256e-08 ) ergs/cm2
Cutoff power-law model
Time interval is from   30.484 sec. to   31.484 sec.
Spectral model in the cutoff power-law:
------------------------------------------------------------
Parameters  : value       lower 90%   higher 90%
Photon index: -0.528335     ( -0.263866   0.279998 )
Epeak [keV] : 184.342      ( -47.8206 155.298 )
Norm@50keV  : 9.16130E-02    ( -0.0209739   0.0288954 )
------------------------------------------------------------
#Fit statistic : Chi-Squared =          67.39 using 59 PHA bins.
# Reduced chi-squared =          1.203 for     56 degrees of freedom
# Null hypothesis probability =   1.416438e-01

Photon flux (15-150 keV)    in 1 sec: 6.46699 ( -0.26396  0.26417 ) ph/cm2/s
Energy fluence (15-150 keV)             : 8.71064e-08 ( -2.16036e-08  1.8022e-08 ) ergs/cm2
Time-resolved spectra
Distribution
T90 vs. Hardness ratio plot
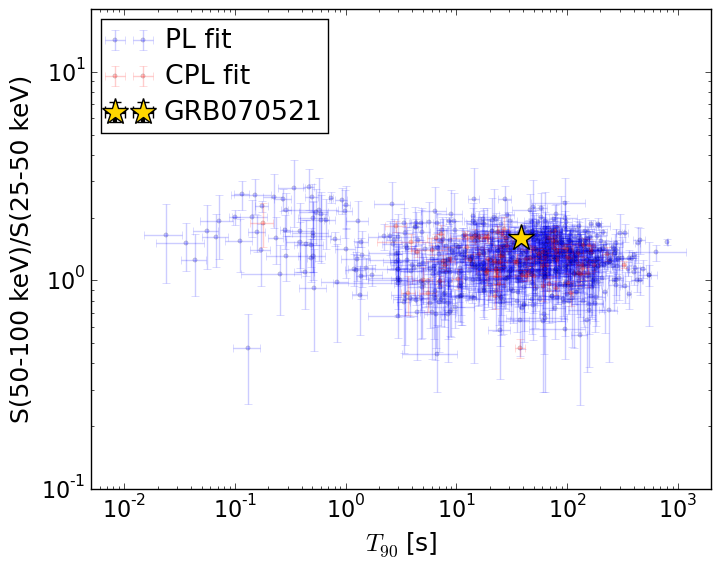
T90                                   = 38.628 sec.
Hardness ratio (energy fluence ratio) = 1.59334540509
S(15-50 keV) vs. S(50-150 keV) plot
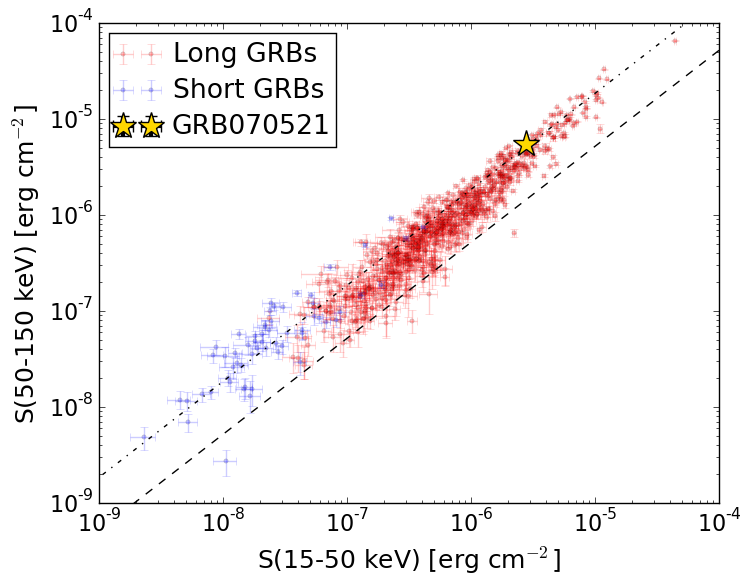
S(15-50 keV)  = 2.763568e-06
S(50-150 keV) = 5.441727e-06
The dash-dotted line and the dashed line traces the fluences calculated from the Band function with Epeak = 15 and 150 keV, respectively. Both lines assume a canonical values of alpha = -1 and beta = -2.5.
Mask shadow pattern
IMX = -1.401252644377248E-02, IMY = -4.955604407870279E-01
Spacecraft aspect plot
Bright source in the pre-burst/pre-slew/post-slew images
Pre-burst image of 15-350 keV band
Time interval of the image:
-98.531400 -14.540000

# RAcent  DECcent POSerr Theta    Phi  PeakCts   SNR AngSep     Name
#  [deg]    [deg]    ['] [deg]  [deg]                   [']
254.4832  35.3455    1.1  20.0   68.1   1.1322  10.3    1.3	Her X-1
288.7943  10.9310    7.1  52.0   23.7   0.7202   1.6    0.9	GRS 1915+105
299.5820  35.1989    0.8  36.8   -7.4   1.8444  15.1    0.4	Cyg X-1
307.9762  40.8732    8.3  37.6  -21.8   0.1696   1.4    7.7	Cyg X-3
326.2774  38.3494    8.0  49.6  -33.0   0.3693   1.4    5.2	Cyg X-2
308.0509  37.6397    1.3  39.8  -18.0   1.1597   8.9 ------	UNKNOWN
Pre-slew background subtracted image of 15-350 keV band
Time interval of the image:
-14.540000 13.068610

# RAcent  DECcent POSerr Theta    Phi  PeakCts   SNR AngSep     Name
#  [deg]    [deg]    ['] [deg]  [deg]                   [']
254.6751  35.3971   31.6  19.9   67.6  -0.0259  -0.4   11.1	Her X-1
289.0187  10.9385    0.0  52.1   23.4   0.3593   1.2   13.0	GRS 1915+105
299.5832  35.0719    3.2  36.9   -7.3   0.2885   3.6    7.8	Cyg X-1
308.0470  40.8011    7.4  37.7  -21.7   0.1240   1.6    9.5	Cyg X-3
326.1811  38.1769    8.5  49.7  -32.8   0.2145   1.4    8.7	Cyg X-2
242.6632  30.2617    0.4  26.4   91.6   2.3956  26.3 ------	UNKNOWN
327.5196  42.0487    2.5  47.8  -37.4   0.6532   4.6 ------	UNKNOWN
 95.7643  83.2490    2.4  41.0 -115.1   0.7617   4.8 ------	UNKNOWN
341.1297  59.2831    2.8  43.7  -63.8   0.9382   4.2 ------	UNKNOWN
Post-slew image of 15-350 keV band
Time interval of the image:
61.268590 602.298000

# RAcent  DECcent POSerr Theta    Phi  PeakCts   SNR AngSep     Name
#  [deg]    [deg]    ['] [deg]  [deg]                   [']
254.4796  35.3266    1.6  11.1  -36.2   5.5854   7.1    1.4	Her X-1
268.3025  -1.4776   26.9  40.0   41.8   0.8168   0.4    4.2	SW J1753.5-0127
288.8271  10.9728    1.9  46.9    8.1   9.9259   5.9    2.4	GRS 1915+105
299.6038  35.2129    1.8  47.5  -27.8  10.2975   6.5    0.9	Cyg X-1
308.1990  41.0714    6.0  53.1  -36.9  -7.1059  -1.9    8.2	Cyg X-3
253.2333  20.5321    3.1  13.6   37.2   3.2221   3.7 ------	UNKNOWN
180.1305  19.8951    3.2  56.9  179.1  20.1568   3.6 ------	UNKNOWN
300.0050  53.7266    2.9  47.0  -53.1  13.7363   4.0 ------	UNKNOWN