Analysis Summary
Notes:
- 1) No attempt has been made to eliminate the non-significant decimal places.
- 2) This batgrbproduct analysis is done using the HEASARC data.
- 3) This batgrbproduct analysis is using the flight position for the mask-weighting calculation.
======================================================================
                  BAT GRB EVENT DATA PROCESSING REPORT
    Process Script Ver: batgrbproduct v2.46
    Process Start Time: Mon Jan 20 09:07:22 EST 2014
             Host Name: batevent1
   Current Working Dir: /local/data/batevent/batevent_reproc/trigger282066
======================================================================

  Trigger: 00282066      Segment: 000

  BAT Trigger Time: 203308728   [s; MET]
      Trigger Stop: 203308792   [s; MET]
               UTC: 2007-06-12T02:38:45.983960    [includes UTCF correction]
       Where From?: TDRSS position message

  BAT
    RA: 121.385105116276   Dec: 37.2655808388602  [deg; J2000]

     Catalogged Source?: NO
     Point Source?:      YES
     GRB Indicated?:     YES    [ by BAT flight software ]
     Image S/N Ratio:    14.22
     Image Trigger?:     YES
     Rate S/N Ratio:     0  [ if not an image trigger ]
     Image S/N Ratio:    14.22

  Analysis Position:   [ source = BAT ]
    RA: 121.385105116276   Dec: 37.2655808388602  [deg; J2000]

  Refined Position:   [ source = BAT pre-slew burst ]
    RA: 121.352795420991   Dec: 37.2630472585902  [deg; J2000]
        { 08h 05m 24.7s , +37d 15' 47.0" }
         +/- 1.35590166812648 [arcmin] (estimated 90% radius based on SNR)
         +/- 0.570853445486668 [arcmin] (formal 1-sigma fit error)
    SNR: 19.6888775731175

  Angular difference between the analysis and refined position is 1.550293 arcmin

  Partial Coding Fraction: 0.1181641    [ including projection effects ]

  Duration
     T90: 365.27999997139 +/- 51.669698660941
        Measured from: 1.17599999904633
                   to: 366.455999970436     [s; relative to TRIGTIME]
     T50: 189.135999977589 +/- 11.7732523936028
        Measured from: 28.9359999895096
                   to: 218.071999967098     [s; relative to TRIGTIME]


  Fluence
     Peak Flux  (peak 1 second)
        Measured from: 2.62000000476837
                   to: 3.62000000476837     [s; relative to TRIGTIME]
     Total Fluence
        Measured from: -4.69600000977516
                   to: 417.863999992609     [s; relative to TRIGTIME]

             Band 1     Band 2     Band 3     Band 4
              15-25      25-50     50-100    100-350     keV
 Total     4.844858   6.293801   4.695318   1.048985
           0.273596   0.287619   0.254550   0.220689 [error]
 Peak      0.034218   0.035506   0.099015   0.032891
           0.014014   0.015233   0.015074   0.012221 [error]

     [ fluence units of on-axis counts / fully illuminated detector ]

======================================================================


====== Table of the duration information =============================

        Value   tstart    tstop
T100  422.560   -4.696  417.864
T90   365.280    1.176  366.456
T50   189.136   28.936  218.072
Peak    1.000    2.620    3.620


====== Spectral Analysis Summary =====================================

Model      : spectral model: simple power-law (PL) and cutoff power-law (CPL)
Ph_index   : photon index: E^{Ph_index}
Ph_90err   : 90% error of the photon index
Epeak      : Epeak in keV
Epeak_90err: 90% error of Epeak
Norm       : normalization at 50 keV in both the PL model and CPL model
Nomr_90err : 90% error of the normalization
chi2       : Chi-Squared
dof        : degree of freedo

=== Time-averaged spectral analysis ===
(Best model with acceptable fit: PL)

Model Ph_index Ph_90err_low Ph_90err_hi  Epeak  Epeak_90err_low  Epeak_90err_hi  Norm       Nomr_90err_low    Norm_90err_hi    chi2    dof
PL      -1.640    -0.092      0.092       -           -               -         2.75e-03     -1.46e-04          1.45e-04      47.690   57
CPL     -1.439    -0.248      0.357      137.695      N/A           N/A         3.49e-03        N/A               N/A         46.630   56


=== 1-s peak spectral analysis ===
(Best model with acceptable fit: PL)

Model Ph_index Ph_90err_low Ph_90err_hi  Epeak  Epeak_90err_low  Epeak_90err_hi  Norm       Nomr_90err_low    Norm_90err_hi    chi2    dof
PL      -0.617     -0.419     0.487       -           -               -         1.17e-02     -3.47e-03          3.25e-03      47.690   57
CPL      0.007     -1.026     3.970      233.589    -233.589      -233.589      1.89e-02     -1.02e-02          1.88e-01      47.430   56


=== Fluence/Peak Flux Summary ===

              Model    Band1     Band2     Band3     Band4     Band5     Total
                       15-25     25-50    50-100    100-350    15-150    15-350    keV
Fluence         PL   1.69e-06  2.86e-06  3.67e-06  9.46e-06  1.08e-05  1.77e-05   erg/cm2
      90%_error_low -1.48e-07 -1.54e-07 -2.54e-07 -1.33e-06 -6.06e-07 -1.54e-06   erg/cm2
      90%_error_hi   1.52e-07  1.53e-07  2.54e-07  1.47e-06  6.09e-07  1.65e-06   erg/cm2
Peak flux       PL   2.09e-01  3.57e-01  4.66e-01  1.23e+00  1.37e+00  2.26e+00   ph/cm2/s
      90%_error_low -1.11e-01 -1.37e-01 -1.04e-01 -5.01e-01 -3.45e-01 -5.50e-01   ph/cm2/s
      90%_error_hi   1.50e-01  1.40e-01  1.04e-01  7.19e-01  3.55e-01  6.25e-01   ph/cm2/s

Fluence        CPL   1.64e-06  2.92e-06  3.71e-06  6.90e-06  1.07e-05  1.52e-05   erg/cm2
      90%_error_low -1.73e-07 -1.82e-07 -2.66e-07 -2.71e-06 -6.70e-07 -2.77e-06   erg/cm2
      90%_error_hi   1.75e-07  1.85e-07  2.70e-07  3.04e-06  6.68e-07  3.20e-06   erg/cm2
Peak flux      CPL   1.58e-01  3.42e-01  5.00e-01  8.28e-01  1.33e+00  1.83e+00   ph/cm2/s
      90%_error_low -1.58e-01 -1.94e-01 -1.32e-01 -8.28e-01 -3.71e-01 -7.66e-01   ph/cm2/s
      90%_error_hi   1.91e-01  1.53e-01  1.63e-01  5.12e-01  3.74e-01  9.72e-01   ph/cm2/s

======================================================================
Image
Pre-slew 15.0-350.0 keV image (Event data)
#   RAcent    DECcent   POSerr    Theta     Phi              Peak Cts       SNR   Name
  121.3528    37.2630   0.0098    39.9715  -108.5032        19.3648902     19.689 TRIG_00282066

Foreground time interval of the image:
 -4.696 417.864 (delta_t = 422.560 [sec])
Background time interval of the image:
-239.000  -4.696 (delta_t = 234.304 [sec])
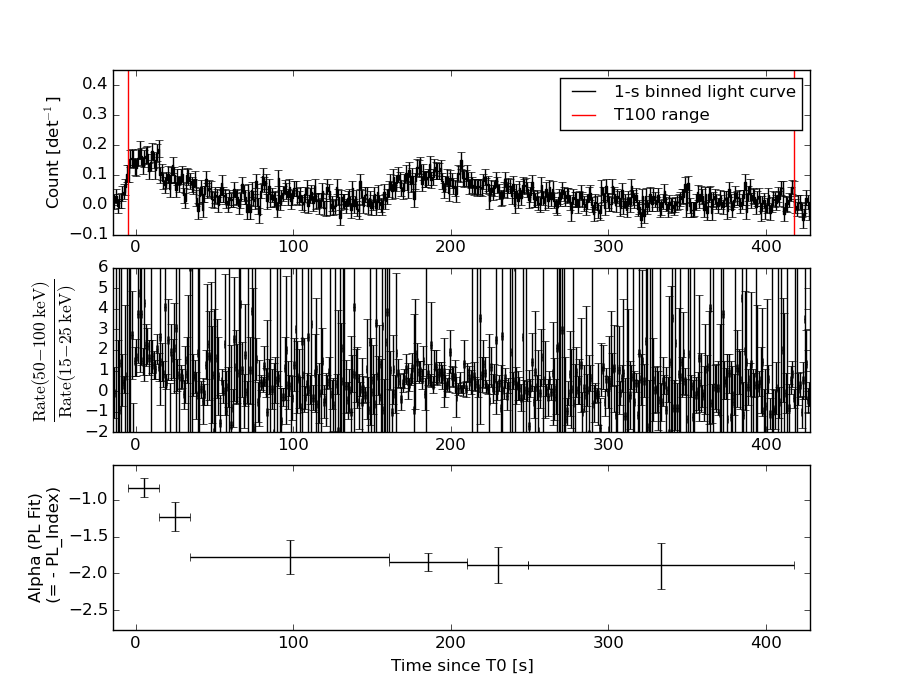
Light Curves
Note: The mask-weighted lightcurves have units of either count/det or counts/sec/det, where a det is 0.4 x 0.4 = 0.16 sq cm.
Full-time range; 1 s binning
Other quick-look light curves:
- 64 ms binning (zoomed)
- 16 ms binning (zoomed)
- 8 ms binning (zoomed)
- 2 ms binning (zoomed)
- SN=5 or 10 s binning (full-time range)
- Raw light curve
Spectra
- 64 ms binning (zoomed)
- 16 ms binning (zoomed)
- 8 ms binning (zoomed)
- 2 ms binning (zoomed)
- SN=5 or 10 s binning (full-time range)
- Raw light curve
Spectra
Notes:
- 1) The fitting includes the systematic errors.
- 2) When the burst includes telescope slew time periods, the fitting uses an average response file made from multiple 5-s response files through out the slew time plus single time preiod for the non-slew times, and weighted by the total counts in the corresponding time period using addrmf. An average response file is needed becuase a spectral fit using the pre-slew DRM will introduce some errors in both a spectral shape and a normalization if the PHA file contains a lot of the slew/post-slew time interval.
- 3) For fits to more complicated models (e.g. a power-law over a cutoff power-law), the BAT team has decided to require a chi-square improvement of more than 6 for each extra dof.
Time averaged spectrum fit using the average DRM
Power-law model

Time interval is from   -4.696 sec. to  417.864 sec.

Spectral model in power-law:
------------------------------------------------------------
Parameters  : value       lower 90%   higher 90%
Photon index: -1.63995     ( -0.0920371   0.0915319 )
Norm@50keV  : 2.75173E-03    ( -0.000145791   0.000145314 )
------------------------------------------------------------
#Fit statistic : Chi-Squared =          47.69 using 59 PHA bins.
# Reduced chi-squared =         0.8367 for     57 degrees of freedom
# Null hypothesis probability =   8.053735e-01

Photon flux (15-150 keV)    in 422.6 sec: 0.358141 ( -0.019173  0.019207 ) ph/cm2/s
Energy fluence (15-150 keV)             : 1.08278e-05 ( -6.06156e-07  6.09157e-07 ) ergs/cm2
Cutoff power-law model
Time interval is from   -4.696 sec. to  417.864 sec.
Spectral model in the cutoff power-law:
------------------------------------------------------------
Parameters  : value       lower 90%   higher 90%
Photon index: -1.43918     ( -0.248206   0.357111 )
Epeak [keV] : 137.695      (   )
Norm@50keV  : 3.48653E-03    (     )
------------------------------------------------------------
#Fit statistic : Chi-Squared =          46.63 using 59 PHA bins.
# Reduced chi-squared =         0.8327 for     56 degrees of freedom
# Null hypothesis probability =   8.095078e-01

Photon flux (15-150 keV)    in 422.6 sec: 0.354599 ( -0.02003  0.020037 ) ph/cm2/s
Energy fluence (15-150 keV)             : 1.06593e-05 ( -6.70383e-07  6.67535e-07 ) ergs/cm2
1-s peak spectrum fit
Power-law model
Time interval is from    2.620 sec. to    3.620 sec.

Spectral model in power-law:
------------------------------------------------------------
Parameters  : value       lower 90%   higher 90%
Photon index: -0.616839     ( -0.419424   0.486739 )
Norm@50keV  : 1.17333E-02    ( -0.00346556   0.00325317 )
------------------------------------------------------------
#Fit statistic : Chi-Squared =          47.69 using 59 PHA bins.
# Reduced chi-squared =         0.8367 for     57 degrees of freedom
# Null hypothesis probability =   8.053777e-01

Photon flux (15-150 keV)    in 1 sec: 1.36719 ( -0.34548  0.35455 ) ph/cm2/s
Energy fluence (15-150 keV)             : 1.48857e-07 ( -3.35754e-08  3.35578e-08 ) ergs/cm2
Cutoff power-law model
Time interval is from    2.620 sec. to    3.620 sec.
Spectral model in the cutoff power-law:
------------------------------------------------------------
Parameters  : value       lower 90%   higher 90%
Photon index: 0.00713306     ( -1.02599   3.9697 )
Epeak [keV] : 233.589      ( -233.555 -233.555 )
Norm@50keV  : 1.88625E-02    ( -0.0102109   0.188349 )
------------------------------------------------------------
#Fit statistic : Chi-Squared =          47.43 using 59 PHA bins.
# Reduced chi-squared =         0.8470 for     56 degrees of freedom
# Null hypothesis probability =   7.855527e-01

Photon flux (15-150 keV)    in 1 sec: 1.32627 ( -0.371039  0.37405 ) ph/cm2/s
Energy fluence (15-150 keV)             : 1.48515e-07 ( -3.42166e-08  3.38242e-08 ) ergs/cm2
Time-resolved spectra
Distribution
T90 vs. Hardness ratio plot
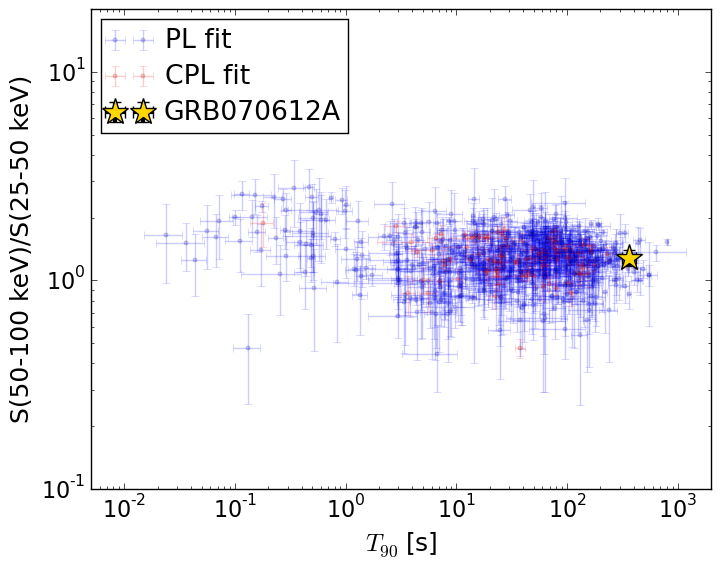
T90                                   = 365.28 sec.
Hardness ratio (energy fluence ratio) = 1.28351237445
S(15-50 keV) vs. S(50-150 keV) plot
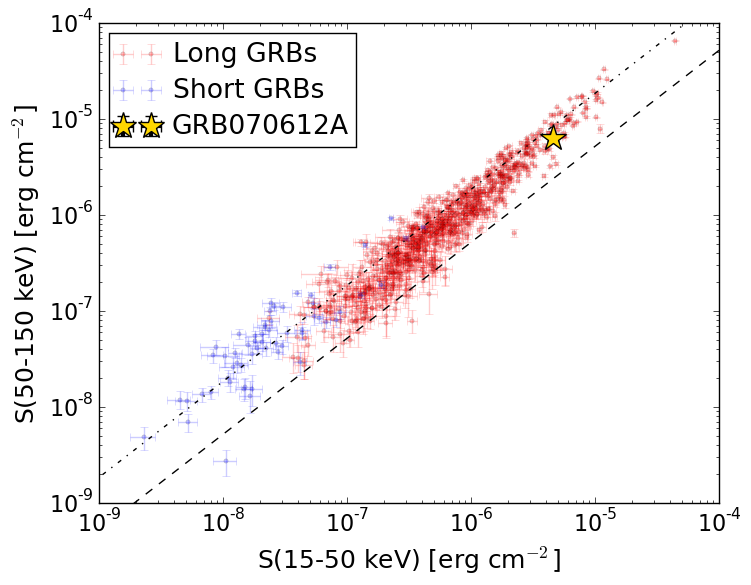
S(15-50 keV)  = 4.550775e-06
S(50-150 keV) = 6.27714e-06
The dash-dotted line and the dashed line traces the fluences calculated from the Band function with Epeak = 15 and 150 keV, respectively. Both lines assume a canonical values of alpha = -1 and beta = -2.5.
Mask shadow pattern

IMX = -2.660250002177185E-01, IMY = 7.949191657710479E-01
Spacecraft aspect plot
Bright source in the pre-burst/pre-slew/post-slew images
Pre-burst image of 15-350 keV band
Time interval of the image:
-239.000000 -4.696000

# RAcent  DECcent POSerr Theta    Phi  PeakCts   SNR AngSep     Name
#  [deg]    [deg]    ['] [deg]  [deg]                   [']
211.8144  28.4434    2.1  35.9   97.9   1.9517   5.5 ------	UNKNOWN
276.8477  63.6733    2.5  49.4   16.2   2.0630   4.6 ------	UNKNOWN
171.2249  -0.4899    2.9  52.6  166.2   2.3368   4.0 ------	UNKNOWN
201.8755  50.2013    2.7  16.8   66.8   0.7206   4.3 ------	UNKNOWN
114.8842  41.8789    3.8  41.1  -98.2   2.6255   3.1 ------	UNKNOWN
Pre-slew background subtracted image of 15-350 keV band
Time interval of the image:
-4.696000 417.864000

# RAcent  DECcent POSerr Theta    Phi  PeakCts   SNR AngSep     Name
#  [deg]    [deg]    ['] [deg]  [deg]                   [']
136.7430  43.0152    2.5  27.1 -112.7   1.9277   4.6 ------	UNKNOWN
 58.1749  70.2846    2.9  49.6  -42.0   5.1622   4.0 ------	UNKNOWN
121.3529  37.2631    0.6  40.0 -108.5  19.3673  19.7 ------	UNKNOWN
Post-slew image of 15-350 keV band
Time interval of the image:
910.300600 963.055700

# RAcent  DECcent POSerr Theta    Phi  PeakCts   SNR AngSep     Name
#  [deg]    [deg]    ['] [deg]  [deg]                   [']
170.3506 -60.5754   18.8  47.0  -52.4  -0.2213  -0.6    3.0	Cen X-3
186.4277 -62.8653    5.9  39.1  -51.8   0.2677   2.0    8.5	GX 301-2
244.9771 -15.6501    0.4  34.3   67.2   4.6936  28.4    0.6	Sco X-1
255.9520 -37.8573    2.4  10.9   87.1   0.3693   4.7    1.8	4U 1700-377
256.4036 -36.4965    4.0  12.3   88.6   0.2280   2.9    4.7	GX 349+2
262.9269 -24.7356    4.2  24.7  101.7   0.2965   2.7    4.5	GX 1+4
264.8191 -44.5973    7.5   7.6  145.4   0.1122   1.5    9.4	4U 1735-44
270.2761 -25.2221    4.8  26.2  116.9   0.2731   2.4    8.6	GX 5-1
270.4381 -25.7011    9.6  25.8  117.6   0.1491   1.4    7.7	GRS 1758-258
274.1325 -14.0146    6.5  38.0  115.7   0.4044   1.8    7.5	GX 17+2
275.7922 -30.5245    0.0  23.8  133.0  -0.1006  -1.0   11.7	H1820-303
284.9244 -25.0597   11.2  33.0  140.2   0.1384   1.0   10.3	HT1900.1-2455
262.9601 -33.9841    8.8  15.8  108.6   0.1061   1.3    9.1	GX 354-0
210.6532 -52.7964    1.9  28.2  -29.8   0.4834   6.2 ------	UNKNOWN
341.6461 -87.5355    2.9  41.1  -98.1   1.5453   3.9 ------	UNKNOWN