Analysis Summary
Notes:
- 1) No attempt has been made to eliminate the non-significant decimal places.
- 2) This batgrbproduct analysis is done using the HEASARC data.
- 3) This batgrbproduct analysis is using the flight position for the mask-weighting calculation.
======================================================================
BAT GRB EVENT DATA PROCESSING REPORT
Process Script Ver: batgrbproduct v2.46
Process Start Time: Mon Jan 20 08:56:35 EST 2014
Host Name: batevent1
Current Working Dir: /local/data/batevent/batevent_reproc/trigger282445
======================================================================
Trigger: 00282445 Segment: 000
BAT Trigger Time: 203704176 [s; MET]
Trigger Stop: 203704240 [s; MET]
UTC: 2007-06-16T16:29:33.974040 [includes UTCF correction]
Where From?: TDRSS position message
BAT
RA: 32.1553533187329 Dec: 56.9481781851878 [deg; J2000]
Catalogged Source?: NO
Point Source?: YES
GRB Indicated?: YES [ by BAT flight software ]
Image S/N Ratio: 8.92
Image Trigger?: YES
Rate S/N Ratio: 0 [ if not an image trigger ]
Image S/N Ratio: 8.92
Analysis Position: [ source = BAT ]
RA: 32.1553533187329 Dec: 56.9481781851878 [deg; J2000]
Refined Position: [ source = BAT pre-slew burst ]
RA: 32.0873325021319 Dec: 56.9553496039486 [deg; J2000]
{ 02h 08m 21.0s , +56d 57' 19.3" }
+/- 2.60161168691881 [arcmin] (estimated 90% radius based on SNR)
+/- 1.62368304149754 [arcmin] (formal 1-sigma fit error)
SNR: 7.76094926712883
Angular difference between the analysis and refined position is 2.266900 arcmin
Partial Coding Fraction: 0.609375 [ including projection effects ]
Duration
T90: 406.875999987125 +/- 17.313424148776
Measured from: 88.580000013113
to: 495.456000000238 [s; relative to TRIGTIME]
T50: 203.879999995232 +/- 5.36175794195104
Measured from: 160.780000001192
to: 364.659999996424 [s; relative to TRIGTIME]
Fluence
Peak Flux (peak 1 second)
Measured from: 139.743999987841
to: 140.743999987841 [s; relative to TRIGTIME]
Total Fluence
Measured from: -6.52799999713898
to: 602.395999997854 [s; relative to TRIGTIME]
Band 1 Band 2 Band 3 Band 4
15-25 25-50 50-100 100-350 keV
Total 9.610418 12.574998 9.055223 2.091862
0.125655 0.132345 0.120431 0.110638 [error]
Peak 0.060124 0.087236 0.081495 0.029505
0.005470 0.006057 0.005867 0.005000 [error]
[ fluence units of on-axis counts / fully illuminated detector ]
======================================================================
====== Table of the duration information =============================
Value tstart tstop
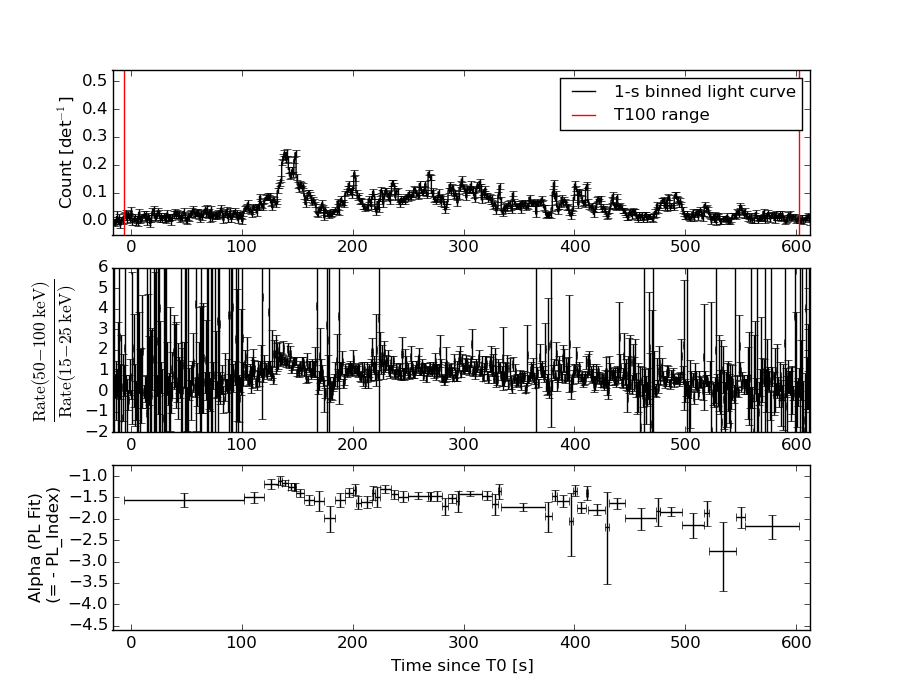
T100 608.924 -6.528 602.396
T90 406.876 88.580 495.456
T50 203.880 160.780 364.660
Peak 1.000 139.744 140.744
====== Spectral Analysis Summary =====================================
Model : spectral model: simple power-law (PL) and cutoff power-law (CPL)
Ph_index : photon index: E^{Ph_index}
Ph_90err : 90% error of the photon index
Epeak : Epeak in keV
Epeak_90err: 90% error of Epeak
Norm : normalization at 50 keV in both the PL model and CPL model
Nomr_90err : 90% error of the normalization
chi2 : Chi-Squared
dof : degree of freedo
=== Time-averaged spectral analysis ===
(Best model with acceptable fit: PL)
Model Ph_index Ph_90err_low Ph_90err_hi Epeak Epeak_90err_low Epeak_90err_hi Norm Nomr_90err_low Norm_90err_hi chi2 dof
PL -1.593 -0.035 0.035 - - - 3.45e-03 -5.94e-05 5.94e-05 35.680 57
CPL -1.471 -0.132 0.142 245.032 -101.298 -245.032 3.90e-03 -4.67e-04 5.88e-04 33.430 56
=== 1-s peak spectral analysis ===
(Best model with acceptable fit: PL)
Model Ph_index Ph_90err_low Ph_90err_hi Epeak Epeak_90err_low Epeak_90err_hi Norm Nomr_90err_low Norm_90err_hi chi2 dof
PL -1.206 -0.131 0.132 - - - 1.64e-02 -1.18e-03 1.18e-03 51.670 57
CPL -1.207 -0.127 0.137 9999.360 -9999.360 -9999.360 1.64e-02 -1.15e-03 5.82e-03 51.700 56
=== Fluence/Peak Flux Summary ===
Model Band1 Band2 Band3 Band4 Band5 Total
15-25 25-50 50-100 100-350 15-150 15-350 keV
Fluence PL 2.93e-06 5.08e-06 6.74e-06 1.82e-05 1.97e-05 3.30e-05 erg/cm2
90%_error_low -1.09e-07 -1.08e-07 -1.41e-07 -8.96e-07 -3.45e-07 -9.50e-07 erg/cm2
90%_error_hi 1.11e-07 1.07e-07 1.41e-07 9.29e-07 3.45e-07 9.73e-07 erg/cm2
Peak flux PL 5.08e-01 6.10e-01 5.28e-01 7.83e-01 1.92e+00 2.43e+00 ph/cm2/s
90%_error_low -6.90e-02 -5.05e-02 -4.67e-02 -1.40e-01 -1.40e-01 -1.90e-01 ph/cm2/s
90%_error_hi 7.18e-02 4.99e-02 4.62e-02 1.58e-01 1.40e-01 1.94e-01 ph/cm2/s
Fluence CPL 2.83e-06 5.10e-06 6.80e-06 1.56e-05 1.95e-05 3.03e-05 erg/cm2
90%_error_low -1.50e-07 -1.11e-07 -1.57e-07 -2.49e-06 -3.99e-07 -2.53e-06 erg/cm2
90%_error_hi 1.53e-07 1.11e-07 1.58e-07 2.68e-06 2.00e-07 2.89e-06 erg/cm2
Peak flux CPL 5.08e-01 6.10e-01 5.29e-01 7.79e-01 1.92e+00 2.43e+00 ph/cm2/s
90%_error_low N/A N/A N/A N/A -1.40e-01 N/A ph/cm2/s
90%_error_hi N/A N/A N/A N/A 1.40e-01 N/A ph/cm2/s
======================================================================
Image
Pre-slew 15.0-350.0 keV image (Event data)
#   RAcent    DECcent   POSerr    Theta     Phi              Peak Cts       SNR   Name
   32.0873    56.9553   0.0249    26.5741   -64.4708         1.1612474      7.761 TRIG_00282445

Foreground time interval of the image:
 -6.528  72.701 (delta_t =  79.229 [sec])
Background time interval of the image:
-72.099 -12.640 (delta_t =  59.459 [sec])
-12.000  -6.528 (delta_t =   5.472 [sec])
Light Curves
Note: The mask-weighted lightcurves have units of either count/det or counts/sec/det, where a det is 0.4 x 0.4 = 0.16 sq cm.
Full-time range; 1 s binning
Other quick-look light curves:
- 64 ms binning (zoomed)
- 16 ms binning (zoomed)
- 8 ms binning (zoomed)
- 2 ms binning (zoomed)
- SN=5 or 10 s binning (full-time range)
- Raw light curve
Spectra
- 64 ms binning (zoomed)
- 16 ms binning (zoomed)
- 8 ms binning (zoomed)
- 2 ms binning (zoomed)
- SN=5 or 10 s binning (full-time range)
- Raw light curve
Spectra
Notes:
- 1) The fitting includes the systematic errors.
- 2) When the burst includes telescope slew time periods, the fitting uses an average response file made from multiple 5-s response files through out the slew time plus single time preiod for the non-slew times, and weighted by the total counts in the corresponding time period using addrmf. An average response file is needed becuase a spectral fit using the pre-slew DRM will introduce some errors in both a spectral shape and a normalization if the PHA file contains a lot of the slew/post-slew time interval.
- 3) For fits to more complicated models (e.g. a power-law over a cutoff power-law), the BAT team has decided to require a chi-square improvement of more than 6 for each extra dof.
Time averaged spectrum fit using the average DRM
Power-law model
Time interval is from   -6.528 sec. to  602.396 sec.

Spectral model in power-law:
------------------------------------------------------------
Parameters  : value       lower 90%   higher 90%
Photon index: -1.59279     ( -0.0348039   0.0348116 )
Norm@50keV  : 3.45150E-03    ( -5.94145e-05   5.94104e-05 )
------------------------------------------------------------
#Fit statistic : Chi-Squared =          35.68 using 59 PHA bins.
# Reduced chi-squared =         0.6260 for     57 degrees of freedom
# Null hypothesis probability =   9.879358e-01

Photon flux (15-150 keV)    in 608.9 sec: 0.442563 ( -0.009135  0.009176 ) ph/cm2/s
Energy fluence (15-150 keV)             : 1.96746e-05 ( -3.44856e-07  3.45494e-07 ) ergs/cm2
Cutoff power-law model
Time interval is from   -6.528 sec. to  602.396 sec.
Spectral model in the cutoff power-law:
------------------------------------------------------------
Parameters  : value       lower 90%   higher 90%
Photon index: -1.47135     ( -0.13195   0.141823 )
Epeak [keV] : 245.032      ( -101.299 -245.033 )
Norm@50keV  : 3.90457E-03    ( -0.00046737   0.000587946 )
------------------------------------------------------------
#Fit statistic : Chi-Squared =          33.43 using 59 PHA bins.
# Reduced chi-squared =         0.5970 for     56 degrees of freedom
# Null hypothesis probability =   9.928183e-01

Photon flux (15-150 keV)    in 608.9 sec: 0.437264 ( -0.01077  0.010845 ) ph/cm2/s
Energy fluence (15-150 keV)             : 1.94942e-05 ( -3.994e-07  1.99854e-07 ) ergs/cm2
1-s peak spectrum fit
Power-law model
Time interval is from  139.744 sec. to  140.744 sec.

Spectral model in power-law:
------------------------------------------------------------
Parameters  : value       lower 90%   higher 90%
Photon index: -1.20597     ( -0.131122   0.131823 )
Norm@50keV  : 1.63617E-02    ( -0.00118001   0.00117857 )
------------------------------------------------------------
#Fit statistic : Chi-Squared =          51.67 using 59 PHA bins.
# Reduced chi-squared =         0.9064 for     57 degrees of freedom
# Null hypothesis probability =   6.747529e-01

Photon flux (15-150 keV)    in 1 sec: 1.92217 ( -0.13994  0.1401 ) ph/cm2/s
Energy fluence (15-150 keV)             : 1.65737e-07 ( -1.38012e-08  1.39183e-08 ) ergs/cm2
Cutoff power-law model
Time interval is from  139.744 sec. to  140.744 sec.
Spectral model in the cutoff power-law:
------------------------------------------------------------
Parameters  : value       lower 90%   higher 90%
Photon index: -1.20659     ( -0.127619   0.137102 )
Epeak [keV] : 9999.36      ( -9999.36 -9999.36 )
Norm@50keV  : 1.64048E-02    ( -0.00118035   0.00579167 )
------------------------------------------------------------
#Fit statistic : Chi-Squared =          51.70 using 59 PHA bins.
# Reduced chi-squared =         0.9232 for     56 degrees of freedom
# Null hypothesis probability =   6.382355e-01

Photon flux (15-150 keV)    in 1 sec: 1.92183 ( -0.14  0.14002 ) ph/cm2/s
Energy fluence (15-150 keV)             : 5.5437e-08 ( -4.48397e-09  4.2253e-09 ) ergs/cm2
Time-resolved spectra
Distribution
T90 vs. Hardness ratio plot
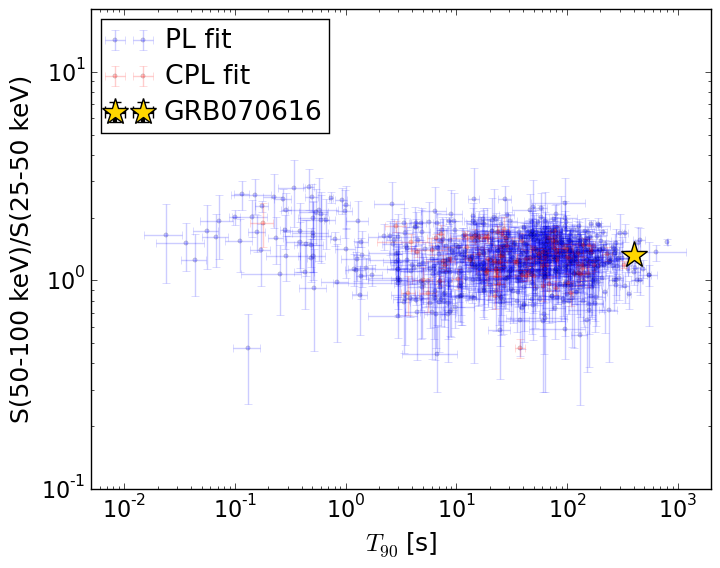
T90                                   = 406.876 sec.
Hardness ratio (energy fluence ratio) = 1.3261419525
S(15-50 keV) vs. S(50-150 keV) plot
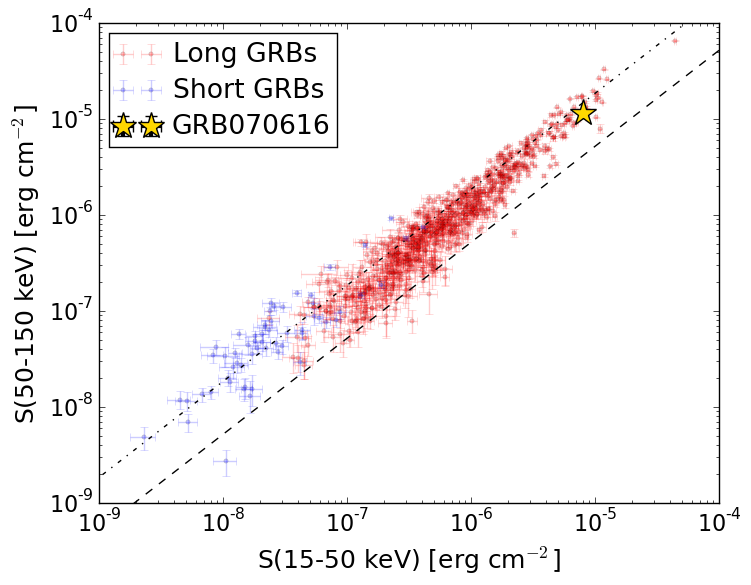
S(15-50 keV)  = 8.011601e-06
S(50-150 keV) = 1.1663172e-05
The dash-dotted line and the dashed line traces the fluences calculated from the Band function with Epeak = 15 and 150 keV, respectively. Both lines assume a canonical values of alpha = -1 and beta = -2.5.
Mask shadow pattern
IMX = 2.155705603579598E-01, IMY = 4.513608476810955E-01
Spacecraft aspect plot
Bright source in the pre-burst/pre-slew/post-slew images
Pre-burst image of 15-350 keV band
Time interval of the image:
-72.099400 -12.640000
-12.000000 -6.528000

# RAcent  DECcent POSerr Theta    Phi  PeakCts   SNR AngSep     Name
#  [deg]    [deg]    ['] [deg]  [deg]                   [']
299.6007  35.1865    1.7  38.3   84.5   2.0448   6.8    1.0	Cyg X-1
308.0093  41.0477    8.3  30.4   77.7   0.1848   1.4    7.3	Cyg X-3
326.2536  38.1960    5.2  29.3   48.8   0.2601   2.2    8.5	Cyg X-2
154.0719  63.2077    2.1  50.0 -147.3   1.1689   5.6 ------	UNKNOWN
Pre-slew background subtracted image of 15-350 keV band
Time interval of the image:
-6.528000 72.700590

# RAcent  DECcent POSerr Theta    Phi  PeakCts   SNR AngSep     Name
#  [deg]    [deg]    ['] [deg]  [deg]                   [']
299.5741  35.2888    7.0  38.2   84.6  -0.7692  -1.6    5.3	Cyg X-1
308.0897  40.8970    6.9  30.5   77.5   0.3451   1.7    3.5	Cyg X-3
326.2836  38.3905    5.6  29.1   48.8   0.3728   2.0    6.7	Cyg X-2
295.1181  47.8954    2.3  28.6  100.8   0.9758   5.0 ------	UNKNOWN
316.0377  42.8296    2.4  26.6   67.3   0.8345   4.9 ------	UNKNOWN
359.4151  77.4564    2.7  12.5 -126.9   0.4637   4.2 ------	UNKNOWN
 32.0873  56.9554    1.5  26.6  -64.5   1.1615   7.7 ------	UNKNOWN
 45.1369  47.9841    2.2  38.5  -64.8   1.3689   5.4 ------	UNKNOWN
Post-slew image of 15-350 keV band
Time interval of the image:
120.100590 963.083500

# RAcent  DECcent POSerr Theta    Phi  PeakCts   SNR AngSep     Name
#  [deg]    [deg]    ['] [deg]  [deg]                   [']
  4.5640  34.7136    2.5  29.0   32.7   2.6783   4.7 ------	UNKNOWN
 32.1455  56.9444    0.2   0.0  -93.1  31.7945  61.9 ------	UNKNOWN
 29.2831  22.8374    2.2  34.2  -14.3   2.7775   5.1 ------	UNKNOWN
156.9474  55.4774    4.1  59.1 -166.1  10.9257   2.8 ------	UNKNOWN
133.7938  60.4484    3.0  47.6 -158.1   3.8949   3.9 ------	UNKNOWN
 57.0172  13.9743    5.2  47.0  -53.0   8.2170   3.1 ------	UNKNOWN
 57.1927  13.8575    5.8  47.1  -53.1   8.5901   3.2 ------	UNKNOWN