Analysis Summary
Notes:
- 1) No attempt has been made to eliminate the non-significant decimal places.
- 2) This batgrbproduct analysis is done using the HEASARC data.
- 3) This batgrbproduct analysis is using the flight position for the mask-weighting calculation.
======================================================================
BAT GRB EVENT DATA PROCESSING REPORT
Process Script Ver: batgrbproduct v2.46
Process Start Time: Mon Jan 20 08:41:59 EST 2014
Host Name: batevent1
Current Working Dir: /local/data/batevent/batevent_reproc/trigger283791
======================================================================
Trigger: 00283791 Segment: 000
BAT Trigger Time: 205272360 [s; MET]
Trigger Stop: 205272424 [s; MET]
UTC: 2007-07-04T20:05:57.934440 [includes UTCF correction]
Where From?: TDRSS position message
BAT
RA: 354.72344217874 Dec: 66.2478751765386 [deg; J2000]
Catalogged Source?: NO
Point Source?: YES
GRB Indicated?: YES [ by BAT flight software ]
Image S/N Ratio: 16.12
Image Trigger?: YES
Rate S/N Ratio: 0 [ if not an image trigger ]
Image S/N Ratio: 16.12
Analysis Position: [ source = BAT ]
RA: 354.72344217874 Dec: 66.2478751765386 [deg; J2000]
Refined Position: [ source = BAT pre-slew burst ]
RA: 354.708150396136 Dec: 66.257712788269 [deg; J2000]
{ 23h 38m 50.0s , +66d 15' 27.8" }
+/- 1.59593398981933 [arcmin] (estimated 90% radius based on SNR)
+/- 0.79078868209694 [arcmin] (formal 1-sigma fit error)
SNR: 15.5990108274092
Angular difference between the analysis and refined position is 0.696362 arcmin
Partial Coding Fraction: 0.4257812 [ including projection effects ]
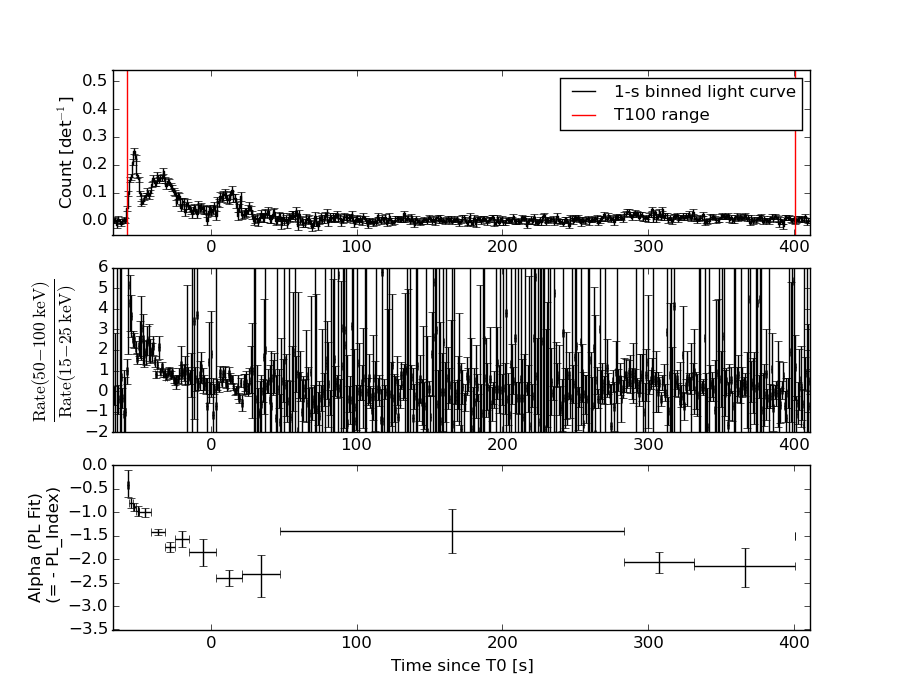
Duration
T90: 384.936000019312 +/- 27.4150108395262
Measured from: -53.6960000097752
to: 331.240000009537 [s; relative to TRIGTIME]
T50: 67.0560000240803 +/- 15.4787551254318
Measured from: -38.8560000061989
to: 28.2000000178814 [s; relative to TRIGTIME]
Fluence
Peak Flux (peak 1 second)
Measured from: -53.0999999940395
to: -52.0999999940395 [s; relative to TRIGTIME]
Total Fluence
Measured from: -57.3240000009537
to: 400.775999993086 [s; relative to TRIGTIME]
Band 1 Band 2 Band 3 Band 4
15-25 25-50 50-100 100-350 keV
Total 2.914171 3.681578 2.598209 0.686572
0.119704 0.124473 0.108583 0.092745 [error]
Peak 0.041225 0.087127 0.098112 0.029326
0.005165 0.005929 0.005765 0.004351 [error]
[ fluence units of on-axis counts / fully illuminated detector ]
======================================================================
====== Table of the duration information =============================
Value tstart tstop
T100 458.100 -57.324 400.776
T90 384.936 -53.696 331.240
T50 67.056 -38.856 28.200
Peak 1.000 -53.100 -52.100
====== Spectral Analysis Summary =====================================
Model : spectral model: simple power-law (PL) and cutoff power-law (CPL)
Ph_index : photon index: E^{Ph_index}
Ph_90err : 90% error of the photon index
Epeak : Epeak in keV
Epeak_90err: 90% error of Epeak
Norm : normalization at 50 keV in both the PL model and CPL model
Nomr_90err : 90% error of the normalization
chi2 : Chi-Squared
dof : degree of freedo
=== Time-averaged spectral analysis ===
(Best model with acceptable fit: PL)
Model Ph_index Ph_90err_low Ph_90err_hi Epeak Epeak_90err_low Epeak_90err_hi Norm Nomr_90err_low Norm_90err_hi chi2 dof
PL -1.646 -0.076 0.076 - - - 1.39e-03 -5.71e-05 5.69e-05 70.850 57
CPL -1.571 -0.148 0.259 264.288 -159.134 -264.288 1.51e-03 -1.75e-04 4.73e-04 71.010 56
=== 1-s peak spectral analysis ===
(Best model with acceptable fit: PL)
Model Ph_index Ph_90err_low Ph_90err_hi Epeak Epeak_90err_low Epeak_90err_hi Norm Nomr_90err_low Norm_90err_hi chi2 dof
PL -0.869 -0.116 0.118 - - - 1.74e-02 -1.20e-03 1.20e-03 67.100 57
CPL -0.475 -0.435 0.540 229.443 -99.277 -229.443 2.58e-02 -8.97e-03 1.75e-02 65.170 56
=== Fluence/Peak Flux Summary ===
Model Band1 Band2 Band3 Band4 Band5 Total
15-25 25-50 50-100 100-350 15-150 15-350 keV
Fluence PL 9.30e-07 1.56e-06 2.00e-06 5.13e-06 5.91e-06 9.62e-06 erg/cm2
90%_error_low -6.76e-08 -6.69e-08 -1.09e-07 -5.93e-07 -2.57e-07 -6.72e-07 erg/cm2
90%_error_hi 6.92e-08 6.67e-08 1.09e-07 6.45e-07 2.58e-07 7.13e-07 erg/cm2
Peak flux PL 3.93e-01 5.77e-01 6.32e-01 1.30e+00 2.00e+00 2.90e+00 ph/cm2/s
90%_error_low -5.54e-02 -5.12e-02 -4.44e-02 -1.89e-01 -1.37e-01 -2.18e-01 ph/cm2/s
90%_error_hi 5.84e-02 5.07e-02 4.42e-02 2.09e-01 1.37e-01 2.24e-01 ph/cm2/s
Fluence CPL 9.24e-07 1.57e-06 2.00e-06 4.83e-06 5.89e-06 9.33e-06 erg/cm2
90%_error_low -8.19e-08 -7.07e-08 -1.06e-07 -1.66e-06 -2.89e-07 -1.68e-06 erg/cm2
90%_error_hi 6.42e-08 7.63e-08 1.15e-07 4.45e-07 2.72e-07 5.26e-07 erg/cm2
Peak flux CPL 3.52e-01 5.87e-01 6.64e-01 8.91e-01 1.97e+00 2.50e+00 ph/cm2/s
90%_error_low -7.14e-02 -5.44e-02 -5.85e-02 -3.12e-01 -1.41e-01 -3.44e-01 ph/cm2/s
90%_error_hi 7.52e-02 5.49e-02 5.94e-02 4.76e-01 1.41e-01 5.02e-01 ph/cm2/s
======================================================================
Image
Pre-slew 15.0-350.0 keV image (Event data)
#   RAcent    DECcent   POSerr    Theta     Phi              Peak Cts       SNR   Name
  354.7082    66.2577   0.0123    42.4919   174.4289         2.2258866     15.599 TRIG_00283791

Foreground time interval of the image:
 -2.499  72.101 (delta_t =  74.600 [sec])
Background time interval of the image:
Light Curves
Note: The mask-weighted lightcurves have units of either count/det or counts/sec/det, where a det is 0.4 x 0.4 = 0.16 sq cm.
Full-time range; 1 s binning
Other quick-look light curves:
- 64 ms binning (zoomed)
- 16 ms binning (zoomed)
- 8 ms binning (zoomed)
- 2 ms binning (zoomed)
- SN=5 or 10 s binning (full-time range)
- Raw light curve
Spectra
- 64 ms binning (zoomed)
- 16 ms binning (zoomed)
- 8 ms binning (zoomed)
- 2 ms binning (zoomed)
- SN=5 or 10 s binning (full-time range)
- Raw light curve
Spectra
Notes:
- 1) The fitting includes the systematic errors.
- 2) When the burst includes telescope slew time periods, the fitting uses an average response file made from multiple 5-s response files through out the slew time plus single time preiod for the non-slew times, and weighted by the total counts in the corresponding time period using addrmf. An average response file is needed becuase a spectral fit using the pre-slew DRM will introduce some errors in both a spectral shape and a normalization if the PHA file contains a lot of the slew/post-slew time interval.
- 3) For fits to more complicated models (e.g. a power-law over a cutoff power-law), the BAT team has decided to require a chi-square improvement of more than 6 for each extra dof.
Time averaged spectrum fit using the average DRM
Power-law model

Time interval is from  -57.324 sec. to  400.776 sec.

Spectral model in power-law:
------------------------------------------------------------
Parameters  : value       lower 90%   higher 90%
Photon index: -1.64619     ( -0.0764155   0.0760207 )
Norm@50keV  : 1.38642E-03    ( -5.70808e-05   5.68578e-05 )
------------------------------------------------------------
#Fit statistic : Chi-Squared =          70.85 using 59 PHA bins.
# Reduced chi-squared =          1.243 for     57 degrees of freedom
# Null hypothesis probability =   1.026738e-01

Photon flux (15-150 keV)    in 458.1 sec: 0.180812 ( -0.007699  0.007728 ) ph/cm2/s
Energy fluence (15-150 keV)             : 5.9099e-06 ( -2.56885e-07  2.5804e-07 ) ergs/cm2
Cutoff power-law model

Time interval is from  -57.324 sec. to  400.776 sec.
Spectral model in the cutoff power-law:
------------------------------------------------------------
Parameters  : value       lower 90%   higher 90%
Photon index: -1.57136     ( -0.111465   0.295374 )
Epeak [keV] : 264.288      ( -421.204 -526.358 )
Norm@50keV  : 1.50895E-03    ( -0.000112974   0.000535557 )
------------------------------------------------------------
#Fit statistic : Chi-Squared =          71.01 using 59 PHA bins.
# Reduced chi-squared =          1.268 for     56 degrees of freedom
# Null hypothesis probability =   8.533757e-02

Photon flux (15-150 keV)    in 458.1 sec: 0.180369 ( -0.008321  0.008026 ) ph/cm2/s
Energy fluence (15-150 keV)             : 5.89185e-06 ( -2.88729e-07  2.71546e-07 ) ergs/cm2
1-s peak spectrum fit
Power-law model

Time interval is from  -53.100 sec. to  -52.100 sec.

Spectral model in power-law:
------------------------------------------------------------
Parameters  : value       lower 90%   higher 90%
Photon index: -0.868598     ( -0.115733   0.118438 )
Norm@50keV  : 1.74229E-02    ( -0.00120151   0.00119565 )
------------------------------------------------------------
#Fit statistic : Chi-Squared =          67.10 using 59 PHA bins.
# Reduced chi-squared =          1.177 for     57 degrees of freedom
# Null hypothesis probability =   1.692336e-01

Photon flux (15-150 keV)    in 1 sec: 1.99964 ( -0.1371  0.13729 ) ph/cm2/s
Energy fluence (15-150 keV)             : 1.97984e-07 ( -1.42075e-08  1.42574e-08 ) ergs/cm2
Cutoff power-law model
Time interval is from  -53.100 sec. to  -52.100 sec.
Spectral model in the cutoff power-law:
------------------------------------------------------------
Parameters  : value       lower 90%   higher 90%
Photon index: -0.474669     ( -0.435403   0.539604 )
Epeak [keV] : 229.443      ( -99.2942 -229.46 )
Norm@50keV  : 2.58043E-02    ( -0.00896663   0.0174982 )
------------------------------------------------------------
#Fit statistic : Chi-Squared =          65.17 using 59 PHA bins.
# Reduced chi-squared =          1.164 for     56 degrees of freedom
# Null hypothesis probability =   1.880417e-01

Photon flux (15-150 keV)    in 1 sec: 1.97299 ( -0.14108  0.14107 ) ph/cm2/s
Energy fluence (15-150 keV)             : 1.95016e-07 ( -1.50087e-08  1.48828e-08 ) ergs/cm2
Time-resolved spectra
Distribution
T90 vs. Hardness ratio plot

T90                                   = 384.936 sec.
Hardness ratio (energy fluence ratio) = 1.27796766897
S(15-50 keV) vs. S(50-150 keV) plot
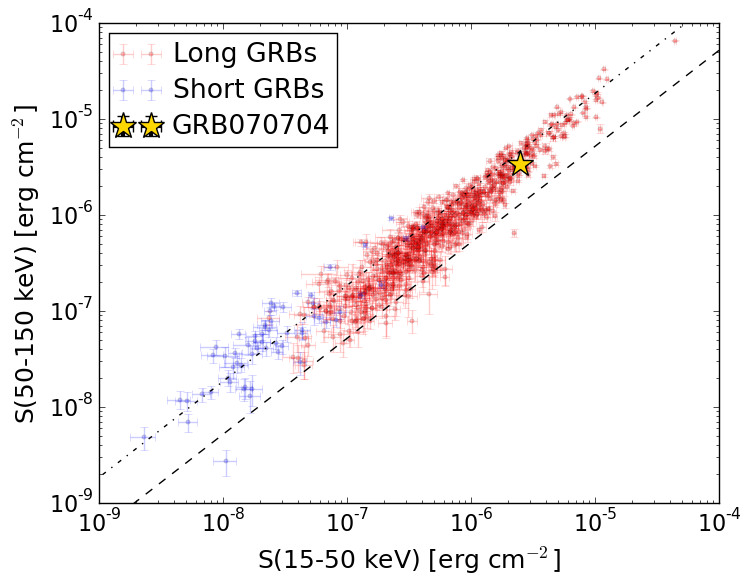
S(15-50 keV)  = 2.4941195e-06
S(50-150 keV) = 3.415829e-06
The dash-dotted line and the dashed line traces the fluences calculated from the Band function with Epeak = 15 and 150 keV, respectively. Both lines assume a canonical values of alpha = -1 and beta = -2.5.
Mask shadow pattern
IMX = -9.117435255017003E-01, IMY = -8.893280574872918E-02
Spacecraft aspect plot

Bright source in the pre-burst/pre-slew/post-slew images
Pre-burst image of 15-350 keV band
Time interval of the image:
Pre-slew background subtracted image of 15-350 keV band
Time interval of the image:
-2.499390 72.100600

# RAcent  DECcent POSerr Theta    Phi  PeakCts   SNR AngSep     Name
#  [deg]    [deg]    ['] [deg]  [deg]                   [']
 83.6302  21.9941    1.0  41.1  -68.0   3.0929  11.0    1.2	Crab
354.7083  66.2578    0.7  42.5  174.4   2.2269  15.6 ------	UNKNOWN
310.9041  83.3140    2.2  57.4 -169.1   1.9739   5.1 ------	UNKNOWN
114.5699  76.9668    2.4  55.2 -145.7   2.2600   4.9 ------	UNKNOWN
Post-slew image of 15-350 keV band
Time interval of the image:
139.100600 963.063000

# RAcent  DECcent POSerr Theta    Phi  PeakCts   SNR AngSep     Name
#  [deg]    [deg]    ['] [deg]  [deg]                   [']
308.1223  40.9837    2.1  36.0   95.2   5.2415   5.5    1.9	Cyg X-3
326.0539  38.4124    4.1  32.3   71.0   2.3676   2.8    7.8	Cyg X-2
354.6999  66.2193    2.2   0.0   84.3   2.0403   5.2 ------	UNKNOWN
206.5843  53.0761    3.0  58.3 -175.7  10.5488   3.9 ------	UNKNOWN
 96.1936  82.5660    3.3  26.2 -137.1   1.4276   3.5 ------	UNKNOWN
192.8901  53.9797    2.7  59.0 -166.1  11.6144   4.2 ------	UNKNOWN