Analysis Summary
Notes:
- 1) No attempt has been made to eliminate the non-significant decimal places.
- 2) This batgrbproduct analysis is done using the HEASARC data.
- 3) This batgrbproduct analysis is using the flight position for the mask-weighting calculation.
======================================================================
                  BAT GRB EVENT DATA PROCESSING REPORT
    Process Script Ver: batgrbproduct v2.46
    Process Start Time: Mon Jan 20 08:37:11 EST 2014
             Host Name: batevent1
   Current Working Dir: /local/data/batevent/batevent_reproc/trigger284850
======================================================================

  Trigger: 00284850      Segment: 000

  BAT Trigger Time: 206076032.704   [s; MET]
      Trigger Stop: 206076033.216   [s; MET]
               UTC: 2007-07-14T03:20:30.618220    [includes UTCF correction]
       Where From?: TDRSS position message

  BAT
    RA: 42.9432215418995   Dec: 30.235985840538  [deg; J2000]

     Catalogged Source?: NO
     Point Source?:      YES
     GRB Indicated?:     YES    [ by BAT flight software ]
     Image S/N Ratio:    12.37
     Image Trigger?:     NO
     Rate S/N Ratio:     24.454038521275  [ if not an image trigger ]
     Image S/N Ratio:    12.37

  Analysis Position:   [ source = BAT ]
    RA: 42.9432215418995   Dec: 30.235985840538  [deg; J2000]

  Refined Position:   [ source = BAT pre-slew burst ]
    RA: 42.9286259990656   Dec: 30.2398419545068  [deg; J2000]
        { 02h 51m 42.9s , +30d 14' 23.4" }
         +/- 1.2533164455008 [arcmin] (estimated 90% radius based on SNR)
         +/- 0.431665134042676 [arcmin] (formal 1-sigma fit error)
    SNR: 22.0308681298215

  Angular difference between the analysis and refined position is 0.791168 arcmin

  Partial Coding Fraction: 0.9609375    [ including projection effects ]

  Duration
     T90: 3 +/- 1.4142135623731
        Measured from: -0.703999996185303
                   to: 2.2960000038147     [s; relative to TRIGTIME]
     T50: 1 +/- 1
        Measured from: 0.296000003814697
                   to: 1.2960000038147     [s; relative to TRIGTIME]


  Fluence
     Peak Flux  (peak 1 second)
        Measured from: 0.296000003814697
                   to: 1.2960000038147     [s; relative to TRIGTIME]
     Total Fluence
        Measured from: -0.703999996185303
                   to: 2.2960000038147     [s; relative to TRIGTIME]

             Band 1     Band 2     Band 3     Band 4
              15-25      25-50     50-100    100-350     keV
 Total     0.186677   0.129387   0.033255   0.034524
           0.009777   0.009814   0.008531   0.008561 [error]
 Peak      0.113440   0.082213   0.018424   0.016212
           0.006271   0.006101   0.005059   0.005037 [error]

     [ fluence units of on-axis counts / fully illuminated detector ]

======================================================================


====== Table of the duration information =============================

        Value   tstart    tstop
T100    3.000   -0.704    2.296
T90     3.000   -0.704    2.296
T50     1.000    0.296    1.296
Peak    1.000    0.296    1.296


====== Spectral Analysis Summary =====================================

Model      : spectral model: simple power-law (PL) and cutoff power-law (CPL)
Ph_index   : photon index: E^{Ph_index}
Ph_90err   : 90% error of the photon index
Epeak      : Epeak in keV
Epeak_90err: 90% error of Epeak
Norm       : normalization at 50 keV in both the PL model and CPL model
Nomr_90err : 90% error of the normalization
chi2       : Chi-Squared
dof        : degree of freedo

=== Time-averaged spectral analysis ===
(Best model with acceptable fit: PL)

Model Ph_index Ph_90err_low Ph_90err_hi  Epeak  Epeak_90err_low  Epeak_90err_hi  Norm       Nomr_90err_low    Norm_90err_hi    chi2    dof
PL      -2.563    -0.207      0.195       -           -               -         5.07e-03     -7.33e-04          7.32e-04      48.090   57
CPL     -1.968     1.968      0.929        1.813      -1.361        -0.777      1.22e-02     -2.70e-03          2.16e-03      48.240   56


=== 1-s peak spectral analysis ===
(Best model with acceptable fit: PL)

Model Ph_index Ph_90err_low Ph_90err_hi  Epeak  Epeak_90err_low  Epeak_90err_hi  Norm       Nomr_90err_low    Norm_90err_hi    chi2    dof
PL      -2.576     -0.202     0.190       -           -               -         9.22e-03     -1.31e-03          1.31e-03      59.090   57
CPL     -1.732     -0.263     1.167       10.969      N/A           N/A         3.21e-02        N/A               N/A         56.860   56


=== Fluence/Peak Flux Summary ===

              Model    Band1     Band2     Band3     Band4     Band5     Total
                       15-25     25-50    50-100    100-350    15-150    15-350    keV
Fluence         PL   5.33e-08  5.17e-08  3.50e-08  3.71e-08  1.55e-07  1.77e-07   erg/cm2
      90%_error_low -5.84e-09 -4.89e-09 -6.79e-09 -1.22e-08 -1.55e-08 -2.22e-08   erg/cm2
      90%_error_hi   5.93e-09  4.81e-09  7.28e-09  1.61e-08  1.60e-08  2.51e-08   erg/cm2
Peak flux       PL   1.08e+00  5.80e-01  1.94e-01  8.45e-02  1.90e+00  1.94e+00   ph/cm2/s
      90%_error_low -1.21e-01 -5.31e-02 -3.59e-02 -2.58e-02 -1.60e-01 -1.62e-01   ph/cm2/s
      90%_error_hi   1.24e-01  5.25e-02  3.79e-02  3.29e-02  1.60e-01  1.62e-01   ph/cm2/s

Fluence        CPL    N/A      N/A      N/A      N/A      N/A      N/A      erg/cm2
      90%_error_low -5.84e-09 -4.89e-09 -6.79e-09 -1.22e-08 -1.55e-08 -2.22e-08   erg/cm2
      90%_error_hi   5.93e-09  4.81e-09  7.28e-09  1.61e-08  1.60e-08  2.51e-08   erg/cm2
Peak flux      CPL   1.03e+00  6.23e-01  1.66e-01  2.16e-02  1.84e+00  1.84e+00   ph/cm2/s
      90%_error_low -1.37e-01 -6.37e-02     N/A   -2.16e-02 -1.71e-01 -1.73e-01   ph/cm2/s
      90%_error_hi   1.30e-01  7.32e-02     N/A    3.35e-02  1.68e-01  1.71e-01   ph/cm2/s

======================================================================
Image
Pre-slew 15.0-350.0 keV image (Event data)
#   RAcent    DECcent   POSerr    Theta     Phi              Peak Cts       SNR   Name
   42.9286    30.2398   0.0087    12.6165    38.0430         0.3935835     22.031 TRIG_00284850

Foreground time interval of the image:
 -0.704   2.296 (delta_t =   3.000 [sec])
Background time interval of the image:
-239.704  -0.704 (delta_t = 239.000 [sec])
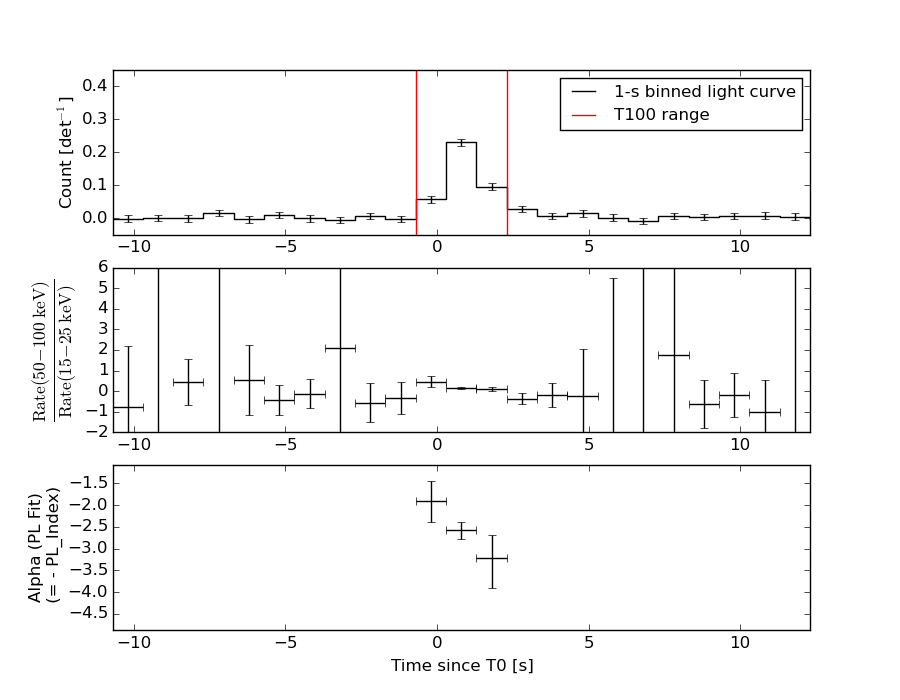
Light Curves
Note: The mask-weighted lightcurves have units of either count/det or counts/sec/det, where a det is 0.4 x 0.4 = 0.16 sq cm.
Full-time range; 1 s binning
Other quick-look light curves:
- 64 ms binning (zoomed)
- 16 ms binning (zoomed)
- 8 ms binning (zoomed)
- 2 ms binning (zoomed)
- SN=5 or 10 s binning (full-time range)
- Raw light curve
Spectra
- 64 ms binning (zoomed)
- 16 ms binning (zoomed)
- 8 ms binning (zoomed)
- 2 ms binning (zoomed)
- SN=5 or 10 s binning (full-time range)
- Raw light curve
Spectra
Notes:
- 1) The fitting includes the systematic errors.
- 2) When the burst includes telescope slew time periods, the fitting uses an average response file made from multiple 5-s response files through out the slew time plus single time preiod for the non-slew times, and weighted by the total counts in the corresponding time period using addrmf. An average response file is needed becuase a spectral fit using the pre-slew DRM will introduce some errors in both a spectral shape and a normalization if the PHA file contains a lot of the slew/post-slew time interval.
- 3) For fits to more complicated models (e.g. a power-law over a cutoff power-law), the BAT team has decided to require a chi-square improvement of more than 6 for each extra dof.
Time averaged spectrum fit using the average DRM
Power-law model
Time interval is from   -0.704 sec. to    2.296 sec.

Spectral model in power-law:
------------------------------------------------------------
Parameters  : value       lower 90%   higher 90%
Photon index: -2.56336     ( -0.207184   0.194866 )
Norm@50keV  : 5.07235E-03    ( -0.000733229   0.000731887 )
------------------------------------------------------------
#Fit statistic : Chi-Squared =          48.09 using 59 PHA bins.
# Reduced chi-squared =         0.8437 for     57 degrees of freedom
# Null hypothesis probability =   7.936561e-01

Photon flux (15-150 keV)    in 3 sec: 1.03657 ( -0.085616  0.08566 ) ph/cm2/s
Energy fluence (15-150 keV)             : 1.54946e-07 ( -1.55019e-08  1.59966e-08 ) ergs/cm2
Cutoff power-law model
Time interval is from   -0.704 sec. to    2.296 sec.
Spectral model in the cutoff power-law:
------------------------------------------------------------
Parameters  : value       lower 90%   higher 90%
Photon index: -1.98914     ( 1.98914   0.949356 )
Epeak [keV] : 0.653123      ( -0.20086 0.383844 )
Norm@50keV  : 1.18170E-02    ( -0.00227228   0.00259049 )
------------------------------------------------------------
#Fit statistic : Chi-Squared =          48.21 using 59 PHA bins.
# Reduced chi-squared =         0.8609 for     56 degrees of freedom
# Null hypothesis probability =   7.610638e-01

Photon flux (15-150 keV)    in 3 sec: 1.00872 ( -0.082315  0.08389 ) ph/cm2/s
Energy fluence (15-150 keV)             : 0 ( 0  0 ) ergs/cm2
1-s peak spectrum fit
Power-law model
Time interval is from    0.296 sec. to    1.296 sec.

Spectral model in power-law:
------------------------------------------------------------
Parameters  : value       lower 90%   higher 90%
Photon index: -2.57555     ( -0.202037   0.189818 )
Norm@50keV  : 9.22000E-03    ( -0.00131387   0.00130995 )
------------------------------------------------------------
#Fit statistic : Chi-Squared =          59.09 using 59 PHA bins.
# Reduced chi-squared =          1.037 for     57 degrees of freedom
# Null hypothesis probability =   3.991322e-01

Photon flux (15-150 keV)    in 1 sec: 1.89872 ( -0.16001  0.16008 ) ph/cm2/s
Energy fluence (15-150 keV)             : 9.42237e-08 ( -9.40141e-09  9.65584e-09 ) ergs/cm2
Cutoff power-law model
Time interval is from    0.296 sec. to    1.296 sec.
Spectral model in the cutoff power-law:
------------------------------------------------------------
Parameters  : value       lower 90%   higher 90%
Photon index: -1.73153     ( -0.262732   1.16724 )
Epeak [keV] : 10.9689      (   )
Norm@50keV  : 3.20696E-02    (     )
------------------------------------------------------------
#Fit statistic : Chi-Squared =          56.86 using 59 PHA bins.
# Reduced chi-squared =          1.015 for     56 degrees of freedom
# Null hypothesis probability =   4.426501e-01

Photon flux (15-150 keV)    in 1 sec: 1.83877 ( -0.17071  0.16833 ) ph/cm2/s
Energy fluence (15-150 keV)             : 0 ( 0  0 ) ergs/cm2
Time-resolved spectra
Distribution
T90 vs. Hardness ratio plot
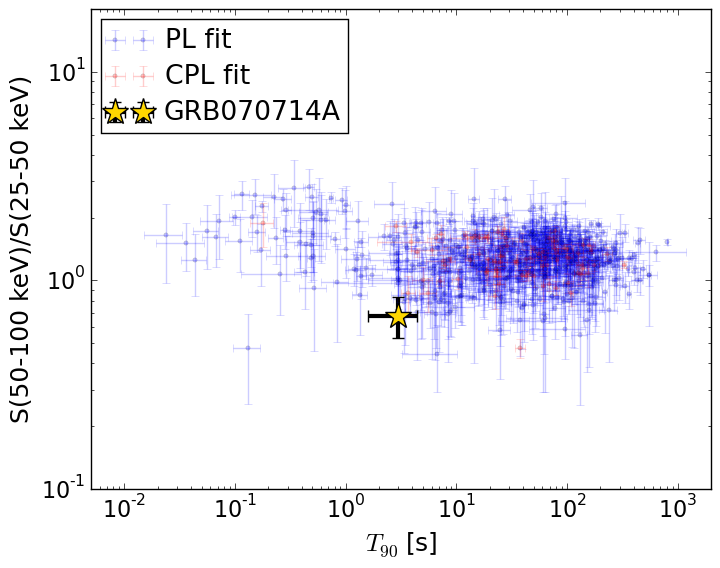
T90                                   = 3.0 sec.
Hardness ratio (energy fluence ratio) = 0.676768591343
S(15-50 keV) vs. S(50-150 keV) plot
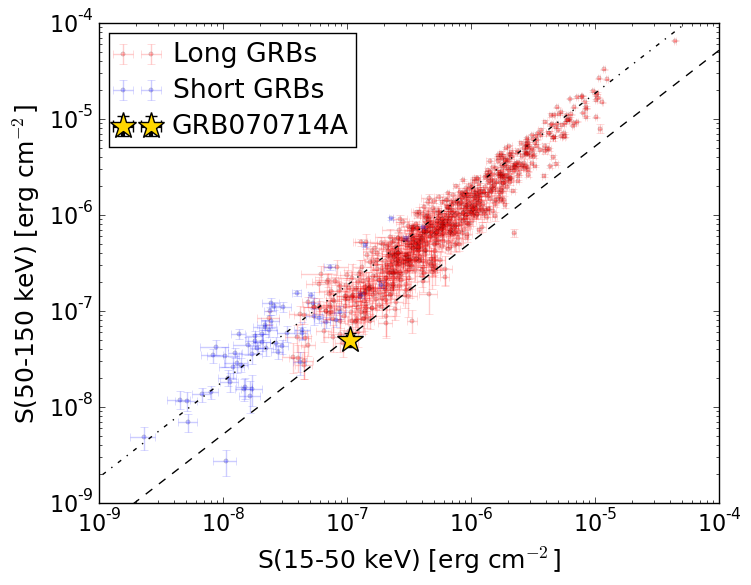
S(15-50 keV)  = 1.05012e-07
S(50-150 keV) = 4.993438e-08
The dash-dotted line and the dashed line traces the fluences calculated from the Band function with Epeak = 15 and 150 keV, respectively. Both lines assume a canonical values of alpha = -1 and beta = -2.5.
Mask shadow pattern
IMX = 1.762765355110585E-01, IMY = -1.379353324595018E-01
Spacecraft aspect plot
Bright source in the pre-burst/pre-slew/post-slew images
Pre-burst image of 15-350 keV band
Time interval of the image:
-239.704000 -0.704000

# RAcent  DECcent POSerr Theta    Phi  PeakCts   SNR AngSep     Name
#  [deg]    [deg]    ['] [deg]  [deg]                   [']
 83.6359  22.0094    0.4  34.3  -56.9   9.9819  31.7    0.3	Crab
 53.2480  -5.1179    2.3  46.7    4.5   1.9044   5.0 ------	UNKNOWN
 82.9727  -3.9722    3.0  54.5  -32.9   3.6210   3.9 ------	UNKNOWN
150.0692  68.7832    3.2  55.2 -145.4   4.0926   3.6 ------	UNKNOWN
 88.5889   4.2146    3.4  50.8  -44.5   3.4222   3.4 ------	UNKNOWN
 99.0382  29.4215    2.2  41.1  -80.2   4.2174   5.2 ------	UNKNOWN
 99.8681  30.9702    3.1  41.0  -82.8   2.9502   3.7 ------	UNKNOWN
Pre-slew background subtracted image of 15-350 keV band
Time interval of the image:
-0.704000 2.296000

# RAcent  DECcent POSerr Theta    Phi  PeakCts   SNR AngSep     Name
#  [deg]    [deg]    ['] [deg]  [deg]                   [']
 83.8159  22.1008    3.7  34.3  -57.2  -0.0962  -3.2   11.4	Crab
 10.9963  39.7749    2.3  29.4  108.7   0.1515   5.1 ------	UNKNOWN
 15.5612  46.7583    2.3  25.1  122.8   0.1249   5.1 ------	UNKNOWN
 47.5975   9.9705    2.6  31.6   13.4   0.1030   4.5 ------	UNKNOWN
 42.9286  30.2398    0.5  12.6   38.0   0.3936  22.0 ------	UNKNOWN
Post-slew image of 15-350 keV band
Time interval of the image:
43.196600 962.415200

# RAcent  DECcent POSerr Theta    Phi  PeakCts   SNR AngSep     Name
#  [deg]    [deg]    ['] [deg]  [deg]                   [']
 83.6347  22.0115    0.4  37.2  -76.7  37.1990  29.7    0.2	Crab
 78.0247 -12.6319    3.1  54.6  -33.0   9.1803   3.8 ------	UNKNOWN
 90.7721  30.4964    3.4  40.9  -92.5   7.4441   3.4 ------	UNKNOWN