Analysis Summary
Notes:
- 1) No attempt has been made to eliminate the non-significant decimal places.
- 2) This batgrbproduct analysis is done using the HEASARC data.
- 3) This batgrbproduct analysis is using the flight position for the mask-weighting calculation.
======================================================================
BAT GRB EVENT DATA PROCESSING REPORT
Process Script Ver: batgrbproduct v2.46
Process Start Time: Mon Jan 20 08:19:54 EST 2014
Host Name: batevent1
Current Working Dir: /local/data/batevent/batevent_reproc/trigger285948
======================================================================
Trigger: 00285948 Segment: 000
BAT Trigger Time: 206967232.32 [s; MET]
Trigger Stop: 206967232.832 [s; MET]
UTC: 2007-07-24T10:53:50.211640 [includes UTCF correction]
Where From?: TDRSS position message
BAT
RA: 27.8178746741569 Dec: -18.6216425472074 [deg; J2000]
Catalogged Source?: NO
Point Source?: YES
GRB Indicated?: YES [ by BAT flight software ]
Image S/N Ratio: 8.71
Image Trigger?: NO
Rate S/N Ratio: 13.0384048104053 [ if not an image trigger ]
Image S/N Ratio: 8.71
Analysis Position: [ source = BAT ]
RA: 27.8178746741569 Dec: -18.6216425472074 [deg; J2000]
Refined Position: [ source = BAT pre-slew burst ]
RA: 27.8221260545431 Dec: -18.606926437213 [deg; J2000]
{ 01h 51m 17.3s , -18d 36' 24.9" }
+/- 2.25588103450103 [arcmin] (estimated 90% radius based on SNR)
+/- 1.14066683450112 [arcmin] (formal 1-sigma fit error)
SNR: 9.51439026023414
Angular difference between the analysis and refined position is 0.915460 arcmin
Partial Coding Fraction: 0.9140625 [ including projection effects ]
Duration
T90: 0.432000011205673 +/- 0.0863712981793007
Measured from: 0.00400000810623169
to: 0.436000019311905 [s; relative to TRIGTIME]
T50: 0.227999985218048 +/- 0.0712179940465239
Measured from: 0.112000018358231
to: 0.340000003576279 [s; relative to TRIGTIME]
Fluence
Peak Flux (peak 1 second)
Measured from: -0.282000005245209
to: 0.717999994754791 [s; relative to TRIGTIME]
Total Fluence
Measured from: -0.0279999971389771
to: 0.46000000834465 [s; relative to TRIGTIME]
Band 1 Band 2 Band 3 Band 4
15-25 25-50 50-100 100-350 keV
Total 0.022668 0.022279 0.013210 0.001359
0.003570 0.003682 0.003239 0.002554 [error]
Peak 0.025876 0.026933 0.013150 0.001302
0.004844 0.004973 0.004343 0.003612 [error]
[ fluence units of on-axis counts / fully illuminated detector ]
======================================================================
====== Table of the duration information =============================
Value tstart tstop
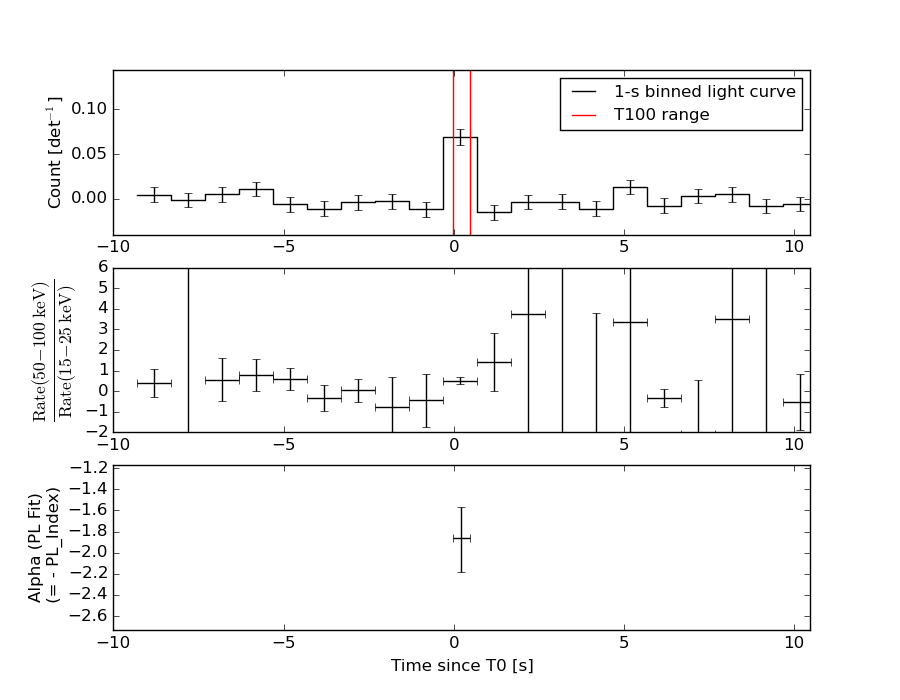
T100 0.488 -0.028 0.460
T90 0.432 0.004 0.436
T50 0.228 0.112 0.340
Peak 1.000 -0.282 0.718
====== Spectral Analysis Summary =====================================
Model : spectral model: simple power-law (PL) and cutoff power-law (CPL)
Ph_index : photon index: E^{Ph_index}
Ph_90err : 90% error of the photon index
Epeak : Epeak in keV
Epeak_90err: 90% error of Epeak
Norm : normalization at 50 keV in both the PL model and CPL model
Nomr_90err : 90% error of the normalization
chi2 : Chi-Squared
dof : degree of freedo
=== Time-averaged spectral analysis ===
(Best model with acceptable fit: PL)
Model Ph_index Ph_90err_low Ph_90err_hi Epeak Epeak_90err_low Epeak_90err_hi Norm Nomr_90err_low Norm_90err_hi chi2 dof
PL -1.861 -0.324 0.296 - - - 6.88e-03 -1.53e-03 1.48e-03 53.110 57
CPL -0.680 -1.309 1.823 45.854 -17.118 -45.854 3.39e-02 -3.39e-02 3.82e-01 50.880 56
=== 1-s peak spectral analysis ===
(Best model with acceptable fit: PL)
Model Ph_index Ph_90err_low Ph_90err_hi Epeak Epeak_90err_low Epeak_90err_hi Norm Nomr_90err_low Norm_90err_hi chi2 dof
PL -1.940 -0.373 0.335 - - - 3.73e-03 -9.98e-04 9.75e-04 48.990 57
CPL 0.407 -1.821 2.898 38.773 -9.035 16.149 1.01e-01 -1.01e-01 7.43e+00 43.700 56
=== Fluence/Peak Flux Summary ===
Model Band1 Band2 Band3 Band4 Band5 Total
15-25 25-50 50-100 100-350 15-150 15-350 keV
Fluence PL 6.02e-09 8.89e-09 9.79e-09 2.03e-08 3.09e-08 4.50e-08 erg/cm2
90%_error_low -1.41e-09 -1.58e-09 -2.82e-09 -9.48e-09 -6.64e-09 -1.32e-08 erg/cm2
90%_error_hi 1.45e-09 1.58e-09 2.91e-09 1.37e-08 6.88e-09 1.65e-08 erg/cm2
Peak flux PL 2.35e-01 1.82e-01 9.49e-02 7.14e-02 5.44e-01 5.83e-01 ph/cm2/s
90%_error_low -6.19e-02 -3.83e-02 -3.14e-02 -3.61e-02 -1.13e-01 -1.24e-01 ph/cm2/s
90%_error_hi 6.43e-02 3.82e-02 3.30e-02 5.31e-02 1.13e-01 1.26e-01 ph/cm2/s
Fluence CPL 6.35e-09 8.68e-09 9.06e-09 2.08e-08 3.01e-08 4.51e-08 erg/cm2
90%_error_low -1.68e-09 -6.13e-10 -3.65e-09 -2.04e-08 -9.12e-09 -1.39e-08 erg/cm2
90%_error_hi 1.49e-09 4.00e-09 3.63e-09 2.97e-09 5.16e-09 8.37e-09 erg/cm2
Peak flux CPL 2.05e-01 2.37e-01 7.74e-02 4.49e-03 5.23e-01 5.23e-01 ph/cm2/s
90%_error_low -7.11e-02 -5.62e-02 -4.52e-02 -4.49e-03 -1.10e-01 -1.10e-01 ph/cm2/s
90%_error_hi 7.19e-02 5.87e-02 4.51e-02 3.21e-02 1.11e-01 1.12e-01 ph/cm2/s
======================================================================
Image
Pre-slew 15.0-350.0 keV image (Event data)
#   RAcent    DECcent   POSerr    Theta     Phi              Peak Cts       SNR   Name
   27.8221   -18.6069   0.0201    17.2333    33.3837         0.0623730      9.514 TRIG_00285948

Foreground time interval of the image:
 -0.028   0.460 (delta_t =   0.488 [sec])
Background time interval of the image:
-239.320  -0.028 (delta_t = 239.292 [sec])
Light Curves
Note: The mask-weighted lightcurves have units of either count/det or counts/sec/det, where a det is 0.4 x 0.4 = 0.16 sq cm.
Full-time range; 1 s binning
Other quick-look light curves:
- 64 ms binning (zoomed)
- 16 ms binning (zoomed)
- 8 ms binning (zoomed)
- 2 ms binning (zoomed)
- SN=5 or 10 s binning (full-time range)
- Raw light curve
Spectra
- 64 ms binning (zoomed)
- 16 ms binning (zoomed)
- 8 ms binning (zoomed)
- 2 ms binning (zoomed)
- SN=5 or 10 s binning (full-time range)
- Raw light curve
Spectra
Notes:
- 1) The fitting includes the systematic errors.
- 2) When the burst includes telescope slew time periods, the fitting uses an average response file made from multiple 5-s response files through out the slew time plus single time preiod for the non-slew times, and weighted by the total counts in the corresponding time period using addrmf. An average response file is needed becuase a spectral fit using the pre-slew DRM will introduce some errors in both a spectral shape and a normalization if the PHA file contains a lot of the slew/post-slew time interval.
- 3) For fits to more complicated models (e.g. a power-law over a cutoff power-law), the BAT team has decided to require a chi-square improvement of more than 6 for each extra dof.
Time averaged spectrum fit using the average DRM
Power-law model
Time interval is from   -0.028 sec. to    0.460 sec.

Spectral model in power-law:
------------------------------------------------------------
Parameters  : value       lower 90%   higher 90%
Photon index: -1.86112     ( -0.323942   0.29613 )
Norm@50keV  : 6.88163E-03    ( -0.00152562   0.00147839 )
------------------------------------------------------------
#Fit statistic : Chi-Squared =          53.11 using 59 PHA bins.
# Reduced chi-squared =         0.9318 for     57 degrees of freedom
# Null hypothesis probability =   6.216334e-01

Photon flux (15-150 keV)    in 0.488 sec: 0.971741 ( -0.171439  0.171439 ) ph/cm2/s
Energy fluence (15-150 keV)             : 3.08802e-08 ( -6.64373e-09  6.87529e-09 ) ergs/cm2
Cutoff power-law model

Time interval is from   -0.028 sec. to    0.460 sec.
Spectral model in the cutoff power-law:
------------------------------------------------------------
Parameters  : value       lower 90%   higher 90%
Photon index: -0.679947     ( -1.31018   1.82233 )
Epeak [keV] : 45.8539      ( -17.1125 -45.8482 )
Norm@50keV  : 3.39427E-02    ( -0.0339871   0.382067 )
------------------------------------------------------------
#Fit statistic : Chi-Squared =          50.88 using 59 PHA bins.
# Reduced chi-squared =         0.9086 for     56 degrees of freedom
# Null hypothesis probability =   6.685518e-01

Photon flux (15-150 keV)    in 0.488 sec: 0.943885 ( -0.172674  0.174005 ) ph/cm2/s
Energy fluence (15-150 keV)             : 3.01453e-08 ( -9.11965e-09  5.15753e-09 ) ergs/cm2
1-s peak spectrum fit
Power-law model
Time interval is from   -0.282 sec. to    0.718 sec.

Spectral model in power-law:
------------------------------------------------------------
Parameters  : value       lower 90%   higher 90%
Photon index: -1.94013     ( -0.372436   0.335688 )
Norm@50keV  : 3.72782E-03    ( -0.000997297   0.000975628 )
------------------------------------------------------------
#Fit statistic : Chi-Squared =          48.99 using 59 PHA bins.
# Reduced chi-squared =         0.8596 for     57 degrees of freedom
# Null hypothesis probability =   7.657147e-01

Photon flux (15-150 keV)    in 1 sec: 0.544355 ( -0.11317  0.113223 ) ph/cm2/s
Energy fluence (15-150 keV)             : 3.42941e-08 ( -8.6404e-09  9.08694e-09 ) ergs/cm2
Cutoff power-law model

Time interval is from   -0.282 sec. to    0.718 sec.
Spectral model in the cutoff power-law:
------------------------------------------------------------
Parameters  : value       lower 90%   higher 90%
Photon index: 0.40708     ( -1.84809   2.87089 )
Epeak [keV] : 38.7735      ( -8.95256 16.2315 )
Norm@50keV  : 0.101304    ( -0.108343   7.42331 )
------------------------------------------------------------
#Fit statistic : Chi-Squared =          43.70 using 59 PHA bins.
# Reduced chi-squared =         0.7803 for     56 degrees of freedom
# Null hypothesis probability =   8.842305e-01

Photon flux (15-150 keV)    in 1 sec: 0.522898 ( -0.109749  0.111378 ) ph/cm2/s
Energy fluence (15-150 keV)             : 2.84702e-08 ( -7.29049e-09  8.95809e-09 ) ergs/cm2
Time-resolved spectra
Distribution
T90 vs. Hardness ratio plot

T90                                   = 0.432 sec.
Hardness ratio (energy fluence ratio) = 1.10113385547
S(15-50 keV) vs. S(50-150 keV) plot

S(15-50 keV)  = 1.4914042e-08
S(50-150 keV) = 1.5966301e-08
The dash-dotted line and the dashed line traces the fluences calculated from the Band function with Epeak = 15 and 150 keV, respectively. Both lines assume a canonical values of alpha = -1 and beta = -2.5.
Mask shadow pattern
IMX = 2.590083416516621E-01, IMY = -1.706787245475634E-01
Spacecraft aspect plot
Bright source in the pre-burst/pre-slew/post-slew images
Pre-burst image of 15-350 keV band
Time interval of the image:
-239.320000 -0.028000

# RAcent  DECcent POSerr Theta    Phi  PeakCts   SNR AngSep     Name
#  [deg]    [deg]    ['] [deg]  [deg]                   [']
352.2981  21.1616    2.6  46.3  138.4   2.6501   4.4 ------	UNKNOWN
 40.5937 -45.9086    2.1  44.2    8.6   1.3562   5.5 ------	UNKNOWN
 51.6974 -52.0151    2.3  52.2    1.7   1.9803   5.0 ------	UNKNOWN
 70.5903 -44.2242    2.1  53.5  -16.8   2.2608   5.5 ------	UNKNOWN
 56.7410  49.1281    3.3  55.2 -145.4   3.7331   3.5 ------	UNKNOWN
Pre-slew background subtracted image of 15-350 keV band
Time interval of the image:
-0.028000 0.460000

# RAcent  DECcent POSerr Theta    Phi  PeakCts   SNR AngSep     Name
#  [deg]    [deg]    ['] [deg]  [deg]                   [']
357.5338  10.9544    3.0  37.8  127.1   0.0574   3.8 ------	UNKNOWN
 27.8221 -18.6069    1.2  17.2   33.4   0.0624   9.5 ------	UNKNOWN
 60.6673  12.2643    2.4  30.9 -102.6   0.0440   4.8 ------	UNKNOWN
 67.8758  25.9324    1.8  43.8 -116.3   0.1554   6.4 ------	UNKNOWN
Post-slew image of 15-350 keV band
Time interval of the image:
55.780650 938.580610

# RAcent  DECcent POSerr Theta    Phi  PeakCts   SNR AngSep     Name
#  [deg]    [deg]    ['] [deg]  [deg]                   [']
 78.9924 -61.7347    3.1  55.8   -9.1   4.4029   3.7 ------	UNKNOWN
 23.8223  40.2677    3.5  59.0 -166.1   9.0244   3.3 ------	UNKNOWN