Analysis Summary
Notes:
- 1) No attempt has been made to eliminate the non-significant decimal places.
- 2) This batgrbproduct analysis is done using the HEASARC data.
- 3) This batgrbproduct analysis is using the flight position for the mask-weighting calculation.
======================================================================
BAT GRB EVENT DATA PROCESSING REPORT
Process Script Ver: batgrbproduct v2.46
Process Start Time: Mon Jan 20 08:08:01 EST 2014
Host Name: batevent1
Current Working Dir: /local/data/batevent/batevent_reproc/trigger286574
======================================================================
Trigger: 00286574 Segment: 000
BAT Trigger Time: 207567204.8 [s; MET]
Trigger Stop: 207567205.312 [s; MET]
UTC: 2007-07-31T09:33:22.676340 [includes UTCF correction]
Where From?: TDRSS position message
BAT
RA: 328.569634421567 Dec: -15.7454090771216 [deg; J2000]
Catalogged Source?: NO
Point Source?: YES
GRB Indicated?: YES [ by BAT flight software ]
Image S/N Ratio: 7.54
Image Trigger?: NO
Rate S/N Ratio: 13.7840487520902 [ if not an image trigger ]
Image S/N Ratio: 7.54
Analysis Position: [ source = BAT ]
RA: 328.569634421567 Dec: -15.7454090771216 [deg; J2000]
Refined Position: [ source = BAT pre-slew burst ]
RA: 328.584430515266 Dec: -15.7429950018337 [deg; J2000]
{ 21h 54m 20.3s , -15d 44' 34.8" }
+/- 1.92440188423991 [arcmin] (estimated 90% radius based on SNR)
+/- 0.648632981520966 [arcmin] (formal 1-sigma fit error)
SNR: 11.9393741127866
Angular difference between the analysis and refined position is 0.866649 arcmin
Partial Coding Fraction: 0.4921875 [ including projection effects ]
Duration
T90: 2.85600000619888 +/- 0.38907581688944
Measured from: -0.0560000240802765
to: 2.79999998211861 [s; relative to TRIGTIME]
T50: 1.81600001454353 +/- 0.622356818612982
Measured from: 0.227999985218048
to: 2.04399999976158 [s; relative to TRIGTIME]
Fluence
Peak Flux (peak 1 second)
Measured from: -0.144000023603439
to: 0.855999976396561 [s; relative to TRIGTIME]
Total Fluence
Measured from: -0.144000023603439
to: 2.9839999973774 [s; relative to TRIGTIME]
Band 1 Band 2 Band 3 Band 4
15-25 25-50 50-100 100-350 keV
Total 0.080882 0.110805 0.072328 0.017615
0.012204 0.013091 0.011708 0.009720 [error]
Peak 0.039478 0.052529 0.045829 0.013128
0.007111 0.007682 0.007249 0.005743 [error]
[ fluence units of on-axis counts / fully illuminated detector ]
======================================================================
====== Table of the duration information =============================
Value tstart tstop
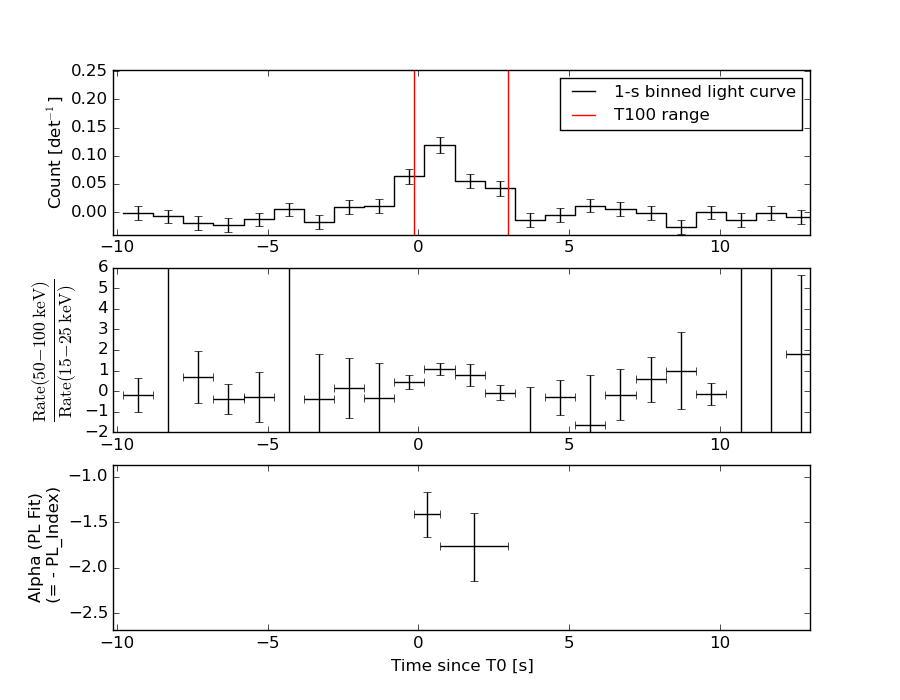
T100 3.128 -0.144 2.984
T90 2.856 -0.056 2.800
T50 1.816 0.228 2.044
Peak 1.000 -0.144 0.856
====== Spectral Analysis Summary =====================================
Model : spectral model: simple power-law (PL) and cutoff power-law (CPL)
Ph_index : photon index: E^{Ph_index}
Ph_90err : 90% error of the photon index
Epeak : Epeak in keV
Epeak_90err: 90% error of Epeak
Norm : normalization at 50 keV in both the PL model and CPL model
Nomr_90err : 90% error of the normalization
chi2 : Chi-Squared
dof : degree of freedo
=== Time-averaged spectral analysis ===
(Best model with acceptable fit: PL)
Model Ph_index Ph_90err_low Ph_90err_hi Epeak Epeak_90err_low Epeak_90err_hi Norm Nomr_90err_low Norm_90err_hi chi2 dof
PL -1.584 -0.229 0.222 - - - 5.69e-03 -8.35e-04 8.23e-04 48.440 57
CPL -0.554 -1.021 1.252 64.332 -15.717 171.089 2.06e-02 -2.06e-02 7.69e-02 44.980 56
=== 1-s peak spectral analysis ===
(Best model with acceptable fit: PL)
Model Ph_index Ph_90err_low Ph_90err_hi Epeak Epeak_90err_low Epeak_90err_hi Norm Nomr_90err_low Norm_90err_hi chi2 dof
PL -1.327 -0.251 0.249 - - - 9.88e-03 -1.51e-03 1.51e-03 49.250 57
CPL -0.536 -0.895 1.241 95.844 -32.620 -95.844 2.42e-02 -1.51e-02 6.90e-02 47.300 56
=== Fluence/Peak Flux Summary ===
Model Band1 Band2 Band3 Band4 Band5 Total
15-25 25-50 50-100 100-350 15-150 15-350 keV
Fluence PL 2.46e-08 4.29e-08 5.73e-08 1.56e-07 1.67e-07 2.81e-07 erg/cm2
90%_error_low -4.92e-09 -5.84e-09 -1.09e-08 -5.31e-08 -2.62e-08 -6.49e-08 erg/cm2
90%_error_hi 5.12e-09 5.82e-09 1.10e-08 6.84e-08 2.67e-08 7.73e-08 erg/cm2
Peak flux PL 3.44e-01 3.84e-01 3.06e-01 4.05e-01 1.18e+00 1.44e+00 ph/cm2/s
90%_error_low -8.55e-02 -6.30e-02 -5.72e-02 -1.35e-01 -1.80e-01 -2.27e-01 ph/cm2/s
90%_error_hi 9.17e-02 6.22e-02 5.65e-02 1.69e-01 1.80e-01 2.32e-01 ph/cm2/s
Fluence CPL 2.18e-08 4.85e-08 5.84e-08 3.83e-08 1.53e-07 1.67e-07 erg/cm2
90%_error_low -5.78e-09 -7.84e-09 -1.31e-08 -2.76e-08 -2.80e-08 -3.96e-08 erg/cm2
90%_error_hi 5.83e-09 8.30e-09 1.27e-08 9.91e-08 2.95e-08 9.97e-08 erg/cm2
Peak flux CPL 2.96e-01 4.12e-01 3.30e-01 1.88e-01 1.15e+00 1.23e+00 ph/cm2/s
90%_error_low -1.04e-01 -7.32e-02 -6.62e-02 -1.16e-01 -1.85e-01 -2.27e-01 ph/cm2/s
90%_error_hi 1.09e-01 7.66e-02 6.89e-02 2.79e-01 1.84e-01 3.34e-01 ph/cm2/s
======================================================================
Image
Pre-slew 15.0-350.0 keV image (Event data)
#   RAcent    DECcent   POSerr    Theta     Phi              Peak Cts       SNR   Name
  328.5844   -15.7430   0.0162    26.3413   107.6686         0.2899573     11.939 TRIG_00286574

Foreground time interval of the image:
 -0.144   2.984 (delta_t =   3.128 [sec])
Background time interval of the image:
-239.800  -0.144 (delta_t = 239.656 [sec])
Light Curves
Note: The mask-weighted lightcurves have units of either count/det or counts/sec/det, where a det is 0.4 x 0.4 = 0.16 sq cm.
Full-time range; 1 s binning
Other quick-look light curves:
- 64 ms binning (zoomed)
- 16 ms binning (zoomed)
- 8 ms binning (zoomed)
- 2 ms binning (zoomed)
- SN=5 or 10 s binning (full-time range)
- Raw light curve
Spectra
- 64 ms binning (zoomed)
- 16 ms binning (zoomed)
- 8 ms binning (zoomed)
- 2 ms binning (zoomed)
- SN=5 or 10 s binning (full-time range)
- Raw light curve
Spectra
Notes:
- 1) The fitting includes the systematic errors.
- 2) When the burst includes telescope slew time periods, the fitting uses an average response file made from multiple 5-s response files through out the slew time plus single time preiod for the non-slew times, and weighted by the total counts in the corresponding time period using addrmf. An average response file is needed becuase a spectral fit using the pre-slew DRM will introduce some errors in both a spectral shape and a normalization if the PHA file contains a lot of the slew/post-slew time interval.
- 3) For fits to more complicated models (e.g. a power-law over a cutoff power-law), the BAT team has decided to require a chi-square improvement of more than 6 for each extra dof.
Time averaged spectrum fit using the average DRM
Power-law model
Time interval is from   -0.144 sec. to    2.984 sec.

Spectral model in power-law:
------------------------------------------------------------
Parameters  : value       lower 90%   higher 90%
Photon index: -1.58412     ( -0.228665   0.221664 )
Norm@50keV  : 5.68834E-03    ( -0.000834614   0.00082301 )
------------------------------------------------------------
#Fit statistic : Chi-Squared =          48.44 using 59 PHA bins.
# Reduced chi-squared =         0.8498 for     57 degrees of freedom
# Null hypothesis probability =   7.830204e-01

Photon flux (15-150 keV)    in 3.128 sec: 0.727454 ( -0.098314  0.098348 ) ph/cm2/s
Energy fluence (15-150 keV)             : 1.66754e-07 ( -2.6183e-08  2.66636e-08 ) ergs/cm2
Cutoff power-law model
Time interval is from   -0.144 sec. to    2.984 sec.
Spectral model in the cutoff power-law:
------------------------------------------------------------
Parameters  : value       lower 90%   higher 90%
Photon index: -0.553655     ( -1.02092   1.25179 )
Epeak [keV] : 64.3323      ( -15.7167 171.089 )
Norm@50keV  : 2.05906E-02    ( -0.0205906   0.0768661 )
------------------------------------------------------------
#Fit statistic : Chi-Squared =          44.98 using 59 PHA bins.
# Reduced chi-squared =         0.8032 for     56 degrees of freedom
# Null hypothesis probability =   8.542628e-01

Photon flux (15-150 keV)    in 3.128 sec: 0.703530 ( -0.101051  0.100964 ) ph/cm2/s
Energy fluence (15-150 keV)             : 1.5284e-07 ( -2.80279e-08  2.94768e-08 ) ergs/cm2
1-s peak spectrum fit
Power-law model
Time interval is from   -0.144 sec. to    0.856 sec.

Spectral model in power-law:
------------------------------------------------------------
Parameters  : value       lower 90%   higher 90%
Photon index: -1.32702     ( -0.250907   0.248783 )
Norm@50keV  : 9.87735E-03    ( -0.00151206   0.00150582 )
------------------------------------------------------------
#Fit statistic : Chi-Squared =          49.25 using 59 PHA bins.
# Reduced chi-squared =         0.8640 for     57 degrees of freedom
# Null hypothesis probability =   7.576875e-01

Photon flux (15-150 keV)    in 1 sec: 1.18448 ( -0.17993  0.18009 ) ph/cm2/s
Energy fluence (15-150 keV)             : 9.69907e-08 ( -1.6577e-08  1.68035e-08 ) ergs/cm2
Cutoff power-law model
Time interval is from   -0.144 sec. to    0.856 sec.
Spectral model in the cutoff power-law:
------------------------------------------------------------
Parameters  : value       lower 90%   higher 90%
Photon index: -0.535738     ( -0.894744   1.24068 )
Epeak [keV] : 95.8438      ( -32.6196 -95.8433 )
Norm@50keV  : 2.42451E-02    ( -0.0151384   0.0689704 )
------------------------------------------------------------
#Fit statistic : Chi-Squared =          47.30 using 59 PHA bins.
# Reduced chi-squared =         0.8447 for     56 degrees of freedom
# Null hypothesis probability =   7.894786e-01

Photon flux (15-150 keV)    in 1 sec: 1.15331 ( -0.18494  0.18449 ) ph/cm2/s
Energy fluence (15-150 keV)             : 3.9819e-08 ( -1.84379e-08  1.47819e-08 ) ergs/cm2
Time-resolved spectra
Distribution
T90 vs. Hardness ratio plot
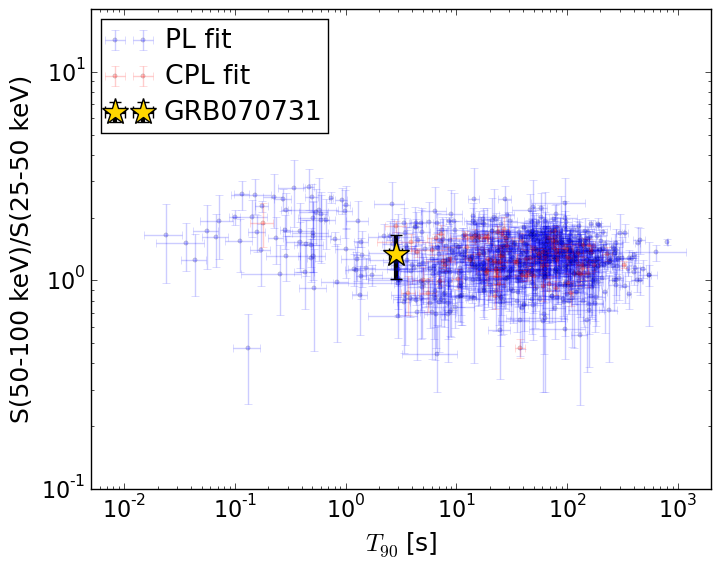
T90                                   = 2.856 sec.
Hardness ratio (energy fluence ratio) = 1.33410535322
S(15-50 keV) vs. S(50-150 keV) plot
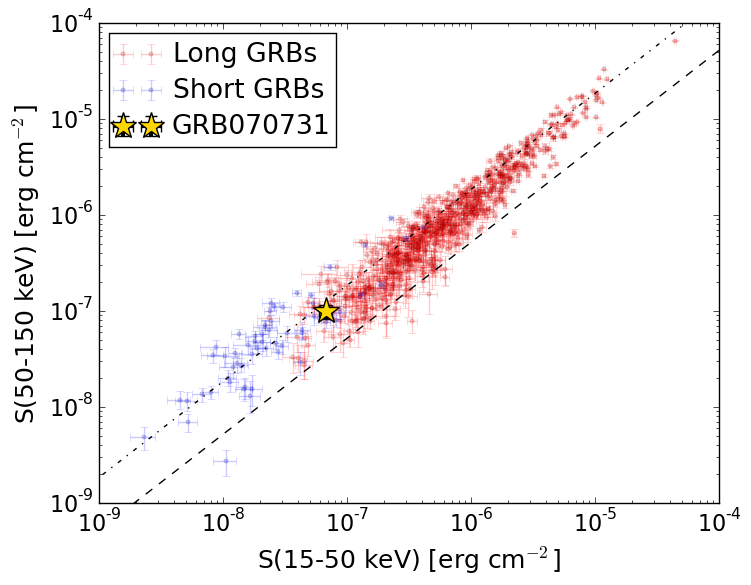
S(15-50 keV)  = 6.750592e-08
S(50-150 keV) = 9.924781e-08
The dash-dotted line and the dashed line traces the fluences calculated from the Band function with Epeak = 15 and 150 keV, respectively. Both lines assume a canonical values of alpha = -1 and beta = -2.5.
Mask shadow pattern
IMX = -1.502765794764963E-01, IMY = -4.717709638029596E-01
Spacecraft aspect plot
Bright source in the pre-burst/pre-slew/post-slew images
Pre-burst image of 15-350 keV band
Time interval of the image:
-239.800000 -0.144000

# RAcent  DECcent POSerr Theta    Phi  PeakCts   SNR AngSep     Name
#  [deg]    [deg]    ['] [deg]  [deg]                   [']
264.5831 -44.3262    6.9  50.7    4.8  -0.7179  -1.7   10.1	4U 1735-44
275.9221 -30.3658  247.3  48.8   26.5   0.0278   0.0    0.2	H1820-303
284.9196 -24.9767    5.0  45.0   38.5   1.1140   2.3    7.2	HT1900.1-2455
314.6236  -9.9910    2.7  36.5   86.8   1.8460   4.3 ------	UNKNOWN
292.2061 -54.0524    2.9  31.4   -5.3   0.7201   3.9 ------	UNKNOWN
257.4767 -71.4587    2.3  47.6  -31.4   1.7165   5.1 ------	UNKNOWN
 39.1483 -37.4608    2.3  48.0 -129.0   3.8366   5.0 ------	UNKNOWN
Pre-slew background subtracted image of 15-350 keV band
Time interval of the image:
-0.144000 2.984000

# RAcent  DECcent POSerr Theta    Phi  PeakCts   SNR AngSep     Name
#  [deg]    [deg]    ['] [deg]  [deg]                   [']
264.7929 -44.3729    4.3  50.5    4.8  -0.1198  -2.7    5.1	4U 1735-44
275.8684 -30.3730    7.0  48.9   26.4   0.1090   1.7    2.9	H1820-303
285.1607 -24.9237    4.6  44.8   38.8   0.1349   2.5    6.8	HT1900.1-2455
328.5844 -15.7430    1.0  26.3  107.7   0.2899  11.9 ------	UNKNOWN
 13.2053   0.9002    2.6  54.1  172.1   0.2947   4.4 ------	UNKNOWN
  7.3848  -9.7626    2.9  42.0  174.0   0.1030   3.9 ------	UNKNOWN
Post-slew image of 15-350 keV band
Time interval of the image:
917.500600 962.285300

# RAcent  DECcent POSerr Theta    Phi  PeakCts   SNR AngSep     Name
#  [deg]    [deg]    ['] [deg]  [deg]                   [']
357.3924  14.1044    2.2  52.9  157.5   1.5658   5.3 ------	UNKNOWN
 14.1628  12.7459    2.7  55.5  177.5   1.0653   4.3 ------	UNKNOWN
257.6414 -85.1682    2.6  52.0  -23.7   0.7157   4.5 ------	UNKNOWN
 39.7542  -7.6745    2.8  53.2 -142.2   1.2799   4.1 ------	UNKNOWN