Analysis Summary
Notes:
- 1) No attempt has been made to eliminate the non-significant decimal places.
- 2) This batgrbproduct analysis is done using the HEASARC data.
- 3) This batgrbproduct analysis is using the flight position for the mask-weighting calculation.
======================================================================
                  BAT GRB EVENT DATA PROCESSING REPORT
    Process Script Ver: batgrbproduct v2.46
    Process Start Time: Mon Jan 20 08:01:57 EST 2014
             Host Name: batevent1
   Current Working Dir: /local/data/batevent/batevent_reproc/trigger286809
======================================================================

  Trigger: 00286809      Segment: 000

  BAT Trigger Time: 207731248   [s; MET]
      Trigger Stop: 207731312   [s; MET]
               UTC: 2007-08-02T07:07:25.872160    [includes UTCF correction]
       Where From?: TDRSS position message

  BAT
    RA: 36.850987019423   Dec: -55.5364556715457  [deg; J2000]

     Catalogged Source?: NO
     Point Source?:      YES
     GRB Indicated?:     YES    [ by BAT flight software ]
     Image S/N Ratio:    7.15
     Image Trigger?:     YES
     Rate S/N Ratio:     0  [ if not an image trigger ]
     Image S/N Ratio:    7.15

  Analysis Position:   [ source = BAT ]
    RA: 36.850987019423   Dec: -55.5364556715457  [deg; J2000]

  Refined Position:   [ source = BAT pre-slew burst ]
    RA: 36.9041697866925   Dec: -55.5176559558811  [deg; J2000]
        { 02h 27m 37.0s , -55d 31' 03.6" }
         +/- 1.99292433539677 [arcmin] (estimated 90% radius based on SNR)
         +/- 0.822207385364391 [arcmin] (formal 1-sigma fit error)
    SNR: 11.3572808452912

  Angular difference between the analysis and refined position is 2.129434 arcmin

  Partial Coding Fraction: 0.734375    [ including projection effects ]

  Duration
     T90: 15.8000000119209 +/- 2.50065271085923
        Measured from: 5.53999999165535
                   to: 21.3400000035763     [s; relative to TRIGTIME]
     T50: 9.03200000524521 +/- 2.45140365771526
        Measured from: 8.26800000667572
                   to: 17.3000000119209     [s; relative to TRIGTIME]


  Fluence
     Peak Flux  (peak 1 second)
        Measured from: 6.15599998831749
                   to: 7.15599998831749     [s; relative to TRIGTIME]
     Total Fluence
        Measured from: 4.80399999022484
                   to: 22.7680000066757     [s; relative to TRIGTIME]

             Band 1     Band 2     Band 3     Band 4
              15-25      25-50     50-100    100-350     keV
 Total     0.146602   0.205848   0.105335   0.043499
           0.023249   0.023931   0.020836   0.018238 [error]
 Peak      0.026411   0.009428   0.018689   0.002672
           0.005437   0.005912   0.004984   0.004168 [error]

     [ fluence units of on-axis counts / fully illuminated detector ]

======================================================================


====== Table of the duration information =============================

        Value   tstart    tstop
T100   17.964    4.804   22.768
T90    15.800    5.540   21.340
T50     9.032    8.268   17.300
Peak    1.000    6.156    7.156


====== Spectral Analysis Summary =====================================

Model      : spectral model: simple power-law (PL) and cutoff power-law (CPL)
Ph_index   : photon index: E^{Ph_index}
Ph_90err   : 90% error of the photon index
Epeak      : Epeak in keV
Epeak_90err: 90% error of Epeak
Norm       : normalization at 50 keV in both the PL model and CPL model
Nomr_90err : 90% error of the normalization
chi2       : Chi-Squared
dof        : degree of freedo

=== Time-averaged spectral analysis ===
(Best model with acceptable fit: PL)

Model Ph_index Ph_90err_low Ph_90err_hi  Epeak  Epeak_90err_low  Epeak_90err_hi  Norm       Nomr_90err_low    Norm_90err_hi    chi2    dof
PL      -1.750    -0.258      0.246       -           -               -         1.68e-03     -2.76e-04          2.69e-04      54.980   57
CPL     -1.039    -0.560      1.493       58.306      N/A           N/A         4.25e-03        N/A               N/A         53.810   56


=== 1-s peak spectral analysis ===
(Best model with acceptable fit: N/A)

Model Ph_index Ph_90err_low Ph_90err_hi  Epeak  Epeak_90err_low  Epeak_90err_hi  Norm       Nomr_90err_low    Norm_90err_hi    chi2    dof
PL      -2.479     -1.486     0.745       -           -               -         2.32e-03     -2.32e-03          1.45e-03      56.210   57
CPL     -1.971      N/A       N/A           5.040      N/A           N/A         3.77e-03        N/A               N/A         56.950   56


=== Fluence/Peak Flux Summary ===

              Model    Band1     Band2     Band3     Band4     Band5     Total
                       15-25     25-50    50-100    100-350    15-150    15-350    keV
Fluence         PL   4.89e-08  7.71e-08  9.17e-08  2.12e-07  2.79e-07  4.30e-07   erg/cm2
      90%_error_low -1.00e-08 -1.08e-08 -2.00e-08 -8.05e-08 -4.66e-08 -1.03e-07   erg/cm2
      90%_error_hi   1.04e-08  1.08e-08  2.02e-08  1.08e-07  4.77e-08  1.25e-07   erg/cm2
Peak flux       PL   2.48e-01  1.40e-01  5.02e-02  2.36e-02  4.51e-01  4.62e-01   ph/cm2/s
      90%_error_low -9.57e-02 -7.44e-02 -5.02e-02 -2.36e-02 -1.41e-01 -1.50e-01   ph/cm2/s
      90%_error_hi   9.71e-02  5.12e-02  4.77e-02  6.06e-02  1.38e-01  1.49e-01   ph/cm2/s

Fluence        CPL   4.57e-08  8.41e-08  9.02e-08  6.73e-08  2.59e-07  2.87e-07   erg/cm2
      90%_error_low -1.16e-08 -1.51e-08 -2.50e-08 -5.59e-08 -5.38e-08 -7.98e-08   erg/cm2
      90%_error_hi   1.16e-08  1.63e-08  2.24e-08  1.71e-07  5.71e-08  1.88e-07   erg/cm2
Peak flux      CPL   2.32e-01  4.79e-02  5.27e-03  7.69e-04  2.86e-01  2.86e-01   ph/cm2/s
      90%_error_low -9.75e-02 -4.79e-02 -5.27e-03 -7.69e-04 -1.42e-01     N/A     ph/cm2/s
      90%_error_hi   9.63e-02  1.24e-01  7.46e-02  6.19e-02  2.53e-01     N/A     ph/cm2/s

======================================================================
Image
Pre-slew 15.0-350.0 keV image (Event data)
#   RAcent    DECcent   POSerr    Theta     Phi              Peak Cts       SNR   Name
   36.9042   -55.5177   0.0169    25.4461    28.4818         0.5170895     11.357 TRIG_00286809

Foreground time interval of the image:
  4.804  22.768 (delta_t =  17.964 [sec])
Background time interval of the image:
-134.499   4.804 (delta_t = 139.303 [sec])
Light Curves
Note: The mask-weighted lightcurves have units of either count/det or counts/sec/det, where a det is 0.4 x 0.4 = 0.16 sq cm.
Full-time range; 1 s binning
Other quick-look light curves:
- 64 ms binning (zoomed)
- 16 ms binning (zoomed)
- 8 ms binning (zoomed)
- 2 ms binning (zoomed)
- SN=5 or 10 s binning (full-time range)
- Raw light curve
Spectra
- 64 ms binning (zoomed)
- 16 ms binning (zoomed)
- 8 ms binning (zoomed)
- 2 ms binning (zoomed)
- SN=5 or 10 s binning (full-time range)
- Raw light curve
Spectra
Notes:
- 1) The fitting includes the systematic errors.
- 2) When the burst includes telescope slew time periods, the fitting uses an average response file made from multiple 5-s response files through out the slew time plus single time preiod for the non-slew times, and weighted by the total counts in the corresponding time period using addrmf. An average response file is needed becuase a spectral fit using the pre-slew DRM will introduce some errors in both a spectral shape and a normalization if the PHA file contains a lot of the slew/post-slew time interval.
- 3) For fits to more complicated models (e.g. a power-law over a cutoff power-law), the BAT team has decided to require a chi-square improvement of more than 6 for each extra dof.
Time averaged spectrum fit using the average DRM
Power-law model
Time interval is from    4.804 sec. to   22.768 sec.

Spectral model in power-law:
------------------------------------------------------------
Parameters  : value       lower 90%   higher 90%
Photon index: -1.75011     ( -0.258453   0.246435 )
Norm@50keV  : 1.68463E-03    ( -0.000275859   0.000269354 )
------------------------------------------------------------
#Fit statistic : Chi-Squared =          54.98 using 59 PHA bins.
# Reduced chi-squared =         0.9646 for     57 degrees of freedom
# Null hypothesis probability =   5.512148e-01

Photon flux (15-150 keV)    in 17.96 sec: 0.227809 ( -0.032091  0.032102 ) ph/cm2/s
Energy fluence (15-150 keV)             : 2.79221e-07 ( -4.65794e-08  4.77181e-08 ) ergs/cm2
Cutoff power-law model
Time interval is from    4.804 sec. to   22.768 sec.
Spectral model in the cutoff power-law:
------------------------------------------------------------
Parameters  : value       lower 90%   higher 90%
Photon index: -1.03928     ( -0.560494   1.49334 )
Epeak [keV] : 58.3065      (   )
Norm@50keV  : 4.25108E-03    (     )
------------------------------------------------------------
#Fit statistic : Chi-Squared =          53.81 using 59 PHA bins.
# Reduced chi-squared =         0.9609 for     56 degrees of freedom
# Null hypothesis probability =   5.581228e-01

Photon flux (15-150 keV)    in 17.96 sec: 0.221637 ( -0.033655  0.03356 ) ph/cm2/s
Energy fluence (15-150 keV)             : 2.58707e-07 ( -5.38092e-08  5.70819e-08 ) ergs/cm2
1-s peak spectrum fit
Power-law model
Time interval is from    6.156 sec. to    7.156 sec.

Spectral model in power-law:
------------------------------------------------------------
Parameters  : value       lower 90%   higher 90%
Photon index: -2.4795     ( -1.48323   0.747745 )
Norm@50keV  : 2.32455E-03    ( -0.00231934   0.00145932 )
------------------------------------------------------------
#Fit statistic : Chi-Squared =          56.21 using 59 PHA bins.
# Reduced chi-squared =         0.9862 for     57 degrees of freedom
# Null hypothesis probability =   5.046361e-01

Photon flux (15-150 keV)    in 1 sec: 0.450887 ( -0.1408  0.138204 ) ph/cm2/s
Energy fluence (15-150 keV)             : 2.3085e-08 ( -1.11044e-08  1.16686e-08 ) ergs/cm2
Cutoff power-law model

Time interval is from    6.156 sec. to    7.156 sec.
Spectral model in the cutoff power-law:
------------------------------------------------------------
Parameters  : value       lower 90%   higher 90%
Photon index: -1.97116     (       )
Epeak [keV] : 5.03950      (   )
Norm@50keV  : 3.76792E-03    (     )
------------------------------------------------------------
#Fit statistic : Chi-Squared =          56.95 using 59 PHA bins.
# Reduced chi-squared =          1.017 for     56 degrees of freedom
# Null hypothesis probability =   4.396753e-01

Photon flux (15-150 keV)    in 1 sec: 0.286036 ( -0.141687  0.253197 ) ph/cm2/s
Energy fluence (15-150 keV)             : 0 ( 0  0 ) ergs/cm2
Time-resolved spectra

Distribution
T90 vs. Hardness ratio plot
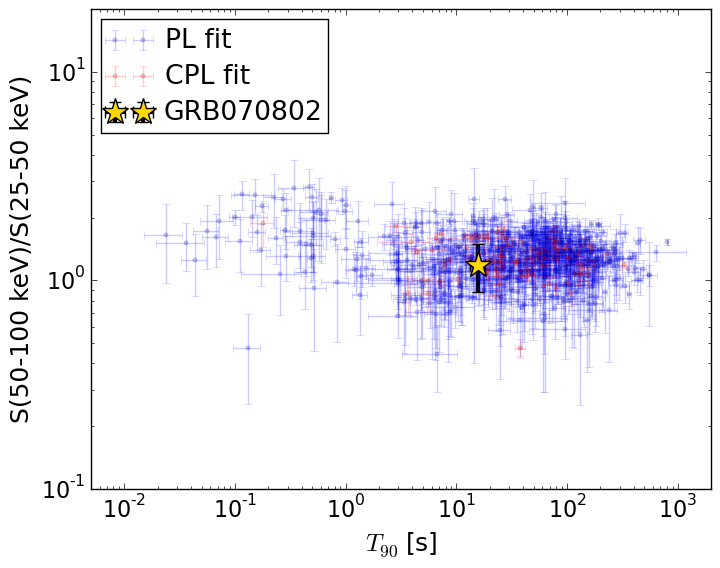
T90                                   = 15.8 sec.
Hardness ratio (energy fluence ratio) = 1.18915920842
S(15-50 keV) vs. S(50-150 keV) plot
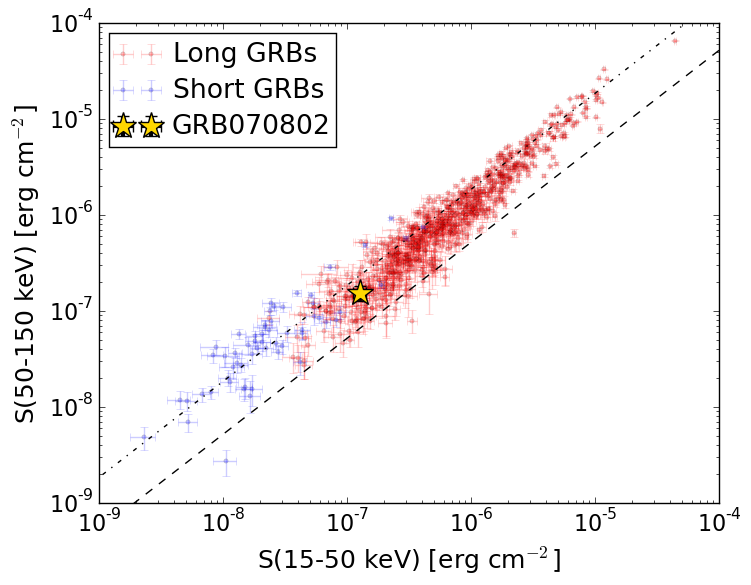
S(15-50 keV)  = 1.2600998e-07
S(50-150 keV) = 1.5321498e-07
The dash-dotted line and the dashed line traces the fluences calculated from the Band function with Epeak = 15 and 150 keV, respectively. Both lines assume a canonical values of alpha = -1 and beta = -2.5.
Mask shadow pattern
IMX = 4.182326421089206E-01, IMY = -2.269102216803238E-01
Spacecraft aspect plot
Bright source in the pre-burst/pre-slew/post-slew images
Pre-burst image of 15-350 keV band
Time interval of the image:
-134.499400 4.804000

# RAcent  DECcent POSerr Theta    Phi  PeakCts   SNR AngSep     Name
#  [deg]    [deg]    ['] [deg]  [deg]                   [']
 10.8272   1.3164    2.5  43.1  153.9   1.1254   4.6 ------	UNKNOWN
 16.4300  11.0854    2.0  47.9  168.1   1.6811   5.9 ------	UNKNOWN
Pre-slew background subtracted image of 15-350 keV band
Time interval of the image:
4.804000 22.768000

# RAcent  DECcent POSerr Theta    Phi  PeakCts   SNR AngSep     Name
#  [deg]    [deg]    ['] [deg]  [deg]                   [']
 36.9042 -55.5176    1.0  25.4   28.5   0.5171  11.4 ------	UNKNOWN
 33.2280   3.7886    2.3  35.0 -172.3   0.2391   5.0 ------	UNKNOWN
106.9305 -42.8774    2.3  52.6  -34.6   0.8232   5.1 ------	UNKNOWN
Post-slew image of 15-350 keV band
Time interval of the image:
121.900600 947.700600

# RAcent  DECcent POSerr Theta    Phi  PeakCts   SNR AngSep     Name
#  [deg]    [deg]    ['] [deg]  [deg]                   [']
170.2149 -60.6023   23.5  58.1  -18.7   1.1724   0.5    3.2	Cen X-3
 93.9010 -77.7670    2.6  29.4  -15.1   1.8159   4.4 ------	UNKNOWN