Analysis Summary
Notes:
- 1) No attempt has been made to eliminate the non-significant decimal places.
- 2) This batgrbproduct analysis is done using the HEASARC data.
- 3) This batgrbproduct analysis is using the flight position for the mask-weighting calculation.
======================================================================
BAT GRB EVENT DATA PROCESSING REPORT
Process Script Ver: batgrbproduct v2.46
Process Start Time: Mon Jan 20 07:57:25 EST 2014
Host Name: batevent1
Current Working Dir: /local/data/batevent/batevent_reproc/trigger287088
======================================================================
Trigger: 00287088 Segment: 000
BAT Trigger Time: 208036547.584 [s; MET]
Trigger Stop: 208036551.68 [s; MET]
UTC: 2007-08-05T19:55:45.448360 [includes UTCF correction]
Where From?: TDRSS position message
BAT
RA: 245.043192352659 Dec: -59.9448796085781 [deg; J2000]
Catalogged Source?: NO
Point Source?: YES
GRB Indicated?: YES [ by BAT flight software ]
Image S/N Ratio: 9.19
Image Trigger?: NO
Rate S/N Ratio: 11.3137084989848 [ if not an image trigger ]
Image S/N Ratio: 9.19
Analysis Position: [ source = BAT ]
RA: 245.043192352659 Dec: -59.9448796085781 [deg; J2000]
Refined Position: [ source = BAT pre-slew burst ]
RA: 245.042046748349 Dec: -59.9590092901461 [deg; J2000]
{ 16h 20m 10.1s , -59d 57' 32.4" }
+/- 1.39634729023887 [arcmin] (estimated 90% radius based on SNR)
+/- 0.485727300988602 [arcmin] (formal 1-sigma fit error)
SNR: 18.8792564092908
Angular difference between the analysis and refined position is 0.848479 arcmin
Partial Coding Fraction: 0.609375 [ including projection effects ]
Duration
T90: 26.4320000112057 +/- 3.11137784326295
Measured from: 0.596000015735626
to: 27.0280000269413 [s; relative to TRIGTIME]
T50: 16.0920000076294 +/- 1.83535499321479
Measured from: 4.07600000500679
to: 20.1680000126362 [s; relative to TRIGTIME]
Fluence
Peak Flux (peak 1 second)
Measured from: 3.2320000231266
to: 4.2320000231266 [s; relative to TRIGTIME]
Total Fluence
Measured from: -0.843999981880188
to: 28.6680000126362 [s; relative to TRIGTIME]
Band 1 Band 2 Band 3 Band 4
15-25 25-50 50-100 100-350 keV
Total 0.394579 0.396959 0.288202 0.134219
0.033590 0.035124 0.031078 0.026836 [error]
Peak 0.017039 0.028852 0.023277 0.012792
0.006230 0.006632 0.006046 0.004995 [error]
[ fluence units of on-axis counts / fully illuminated detector ]
======================================================================
====== Table of the duration information =============================
Value tstart tstop
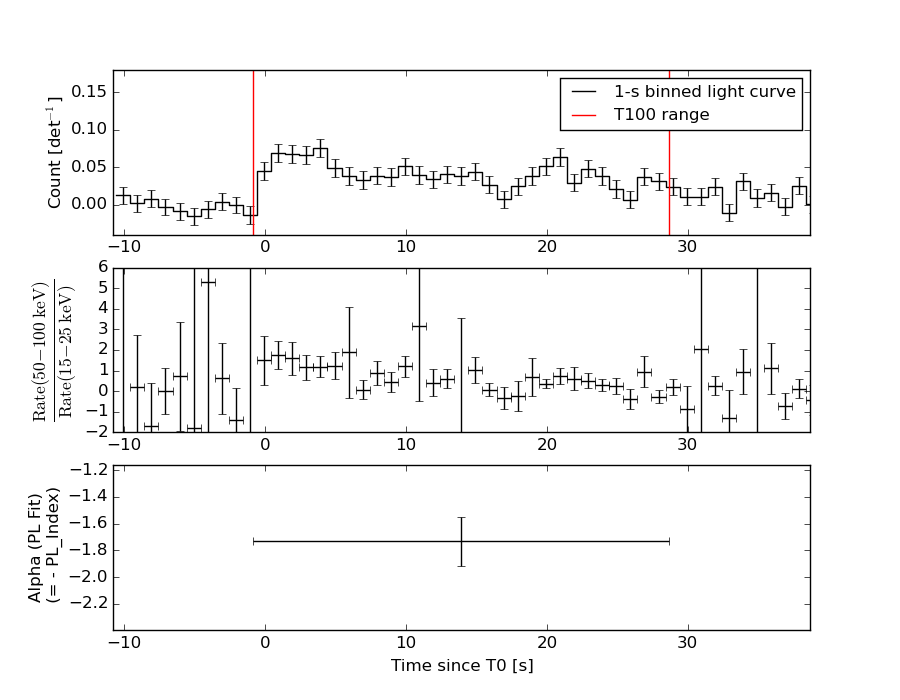
T100 29.512 -0.844 28.668
T90 26.432 0.596 27.028
T50 16.092 4.076 20.168
Peak 1.000 3.232 4.232
====== Spectral Analysis Summary =====================================
Model : spectral model: simple power-law (PL) and cutoff power-law (CPL)
Ph_index : photon index: E^{Ph_index}
Ph_90err : 90% error of the photon index
Epeak : Epeak in keV
Epeak_90err: 90% error of Epeak
Norm : normalization at 50 keV in both the PL model and CPL model
Nomr_90err : 90% error of the normalization
chi2 : Chi-Squared
dof : degree of freedo
=== Time-averaged spectral analysis ===
(Best model with acceptable fit: PL)
Model Ph_index Ph_90err_low Ph_90err_hi Epeak Epeak_90err_low Epeak_90err_hi Norm Nomr_90err_low Norm_90err_hi chi2 dof
PL -1.732 -0.184 0.180 - - - 2.60e-03 -2.61e-04 2.56e-04 55.650 57
CPL -1.728 -0.188 0.187 9999.360 -9999.350 -9999.360 2.60e-03 -2.22e-03 -1.01e-03 55.670 56
=== 1-s peak spectral analysis ===
(Best model with acceptable fit: PL)
Model Ph_index Ph_90err_low Ph_90err_hi Epeak Epeak_90err_low Epeak_90err_hi Norm Nomr_90err_low Norm_90err_hi chi2 dof
PL -1.337 -0.420 0.430 - - - 5.53e-03 -1.32e-03 1.32e-03 44.000 57
CPL -1.301 N/A N/A 952.084 N/A N/A 5.78e-03 N/A N/A 44.020 56
=== Fluence/Peak Flux Summary ===
Model Band1 Band2 Band3 Band4 Band5 Total
15-25 25-50 50-100 100-350 15-150 15-350 keV
Fluence PL 1.22e-07 1.94e-07 2.34e-07 5.50e-07 7.08e-07 1.10e-06 erg/cm2
90%_error_low -1.85e-08 -1.76e-08 -3.29e-08 -1.50e-07 -7.39e-08 -1.80e-07 erg/cm2
90%_error_hi 1.91e-08 1.75e-08 3.28e-08 1.85e-07 7.49e-08 2.07e-07 erg/cm2
Peak flux PL 1.95e-01 2.16e-01 1.71e-01 2.23e-01 6.64e-01 8.05e-01 ph/cm2/s
90%_error_low -8.11e-02 -6.02e-02 -4.90e-02 -1.09e-01 -1.64e-01 -1.95e-01 ph/cm2/s
90%_error_hi 9.14e-02 5.79e-02 4.75e-02 1.60e-01 1.64e-01 1.98e-01 ph/cm2/s
Fluence CPL 1.13e-07 1.58e-07 1.70e-07 4.14e-07 5.51e-07 8.51e-07 erg/cm2
90%_error_low -2.62e-08 -3.33e-08 -1.67e-08 -7.38e-08 -6.56e-08 -1.59e-07 erg/cm2
90%_error_hi 2.02e-08 2.24e-08 1.38e-08 5.12e-08 5.10e-08 1.32e-07 erg/cm2
Peak flux CPL 1.99e-01 2.15e-01 1.70e-01 2.49e-01 6.67e-01 8.32e-01 ph/cm2/s
90%_error_low -1.99e-01 -3.01e-02 -4.82e-02 N/A -1.76e-01 -2.37e-01 ph/cm2/s
90%_error_hi 9.96e-02 6.82e-02 5.68e-02 N/A 1.71e-01 1.71e-01 ph/cm2/s
======================================================================
Image
Pre-slew 15.0-350.0 keV image (Event data)
#   RAcent    DECcent   POSerr    Theta     Phi              Peak Cts       SNR   Name
  245.0420   -59.9590   0.0102    35.6576   -32.5120         1.2728908     18.879 TRIG_00287088

Foreground time interval of the image:
 -0.844  28.668 (delta_t =  29.512 [sec])
Background time interval of the image:
-239.584  -0.844 (delta_t = 238.740 [sec])
Light Curves
Note: The mask-weighted lightcurves have units of either count/det or counts/sec/det, where a det is 0.4 x 0.4 = 0.16 sq cm.
Full-time range; 1 s binning
Other quick-look light curves:
- 64 ms binning (zoomed)
- 16 ms binning (zoomed)
- 8 ms binning (zoomed)
- 2 ms binning (zoomed)
- SN=5 or 10 s binning (full-time range)
- Raw light curve
Spectra
- 64 ms binning (zoomed)
- 16 ms binning (zoomed)
- 8 ms binning (zoomed)
- 2 ms binning (zoomed)
- SN=5 or 10 s binning (full-time range)
- Raw light curve
Spectra
Notes:
- 1) The fitting includes the systematic errors.
- 2) When the burst includes telescope slew time periods, the fitting uses an average response file made from multiple 5-s response files through out the slew time plus single time preiod for the non-slew times, and weighted by the total counts in the corresponding time period using addrmf. An average response file is needed becuase a spectral fit using the pre-slew DRM will introduce some errors in both a spectral shape and a normalization if the PHA file contains a lot of the slew/post-slew time interval.
- 3) For fits to more complicated models (e.g. a power-law over a cutoff power-law), the BAT team has decided to require a chi-square improvement of more than 6 for each extra dof.
Time averaged spectrum fit using the average DRM
Power-law model
Time interval is from   -0.844 sec. to   28.668 sec.

Spectral model in power-law:
------------------------------------------------------------
Parameters  : value       lower 90%   higher 90%
Photon index: -1.73242     ( -0.183772   0.179588 )
Norm@50keV  : 2.59876E-03    ( -0.000261476   0.000255731 )
------------------------------------------------------------
#Fit statistic : Chi-Squared =          55.65 using 59 PHA bins.
# Reduced chi-squared =         0.9763 for     57 degrees of freedom
# Null hypothesis probability =   5.259207e-01

Photon flux (15-150 keV)    in 29.51 sec: 0.349162 ( -0.031868  0.031936 ) ph/cm2/s
Energy fluence (15-150 keV)             : 7.085e-07 ( -7.3901e-08  7.48562e-08 ) ergs/cm2
Cutoff power-law model
Time interval is from   -0.844 sec. to   28.668 sec.
Spectral model in the cutoff power-law:
------------------------------------------------------------
Parameters  : value       lower 90%   higher 90%
Photon index: -2.73184     ( -0.188146   0.187287 )
Epeak [keV] : 235.616      ( -9999.35 -9999.36 )
Norm@50keV  : 8.55076E-04    ( -0.000470272   0.00074168 )
------------------------------------------------------------
#Fit statistic : Chi-Squared =          48.92 using 59 PHA bins.
# Reduced chi-squared =         0.8736 for     56 degrees of freedom
# Null hypothesis probability =   7.374035e-01

Photon flux (15-150 keV)    in 29.51 sec: 0.350970 ( -0.037235  0.033646 ) ph/cm2/s
Energy fluence (15-150 keV)             : 5.51023e-07 ( -6.55783e-08  5.09534e-08 ) ergs/cm2
1-s peak spectrum fit
Power-law model
Time interval is from    3.232 sec. to    4.232 sec.

Spectral model in power-law:
------------------------------------------------------------
Parameters  : value       lower 90%   higher 90%
Photon index: -1.33732     ( -0.419969   0.430437 )
Norm@50keV  : 5.52698E-03    ( -0.00131661   0.00131505 )
------------------------------------------------------------
#Fit statistic : Chi-Squared =          44.00 using 59 PHA bins.
# Reduced chi-squared =         0.7719 for     57 degrees of freedom
# Null hypothesis probability =   8.964000e-01

Photon flux (15-150 keV)    in 1 sec: 0.664139 ( -0.163701  0.164384 ) ph/cm2/s
Energy fluence (15-150 keV)             : 5.41427e-08 ( -1.40588e-08  1.41918e-08 ) ergs/cm2
Cutoff power-law model
Time interval is from    3.232 sec. to    4.232 sec.
Spectral model in the cutoff power-law:
------------------------------------------------------------
Parameters  : value       lower 90%   higher 90%
Photon index: -1.30083     (       )
Epeak [keV] : 952.084      (   )
Norm@50keV  : 5.78112E-03    (     )
------------------------------------------------------------
#Fit statistic : Chi-Squared =          44.02 using 59 PHA bins.
# Reduced chi-squared =         0.7860 for     56 degrees of freedom
# Null hypothesis probability =   8.771014e-01

Photon flux (15-150 keV)    in 1 sec: 0.666704 ( -0.176406  0.170814 ) ph/cm2/s
Energy fluence (15-150 keV)             : 5.44616e-08 ( -1.56662e-08  1.27555e-08 ) ergs/cm2
Time-resolved spectra
Distribution
T90 vs. Hardness ratio plot
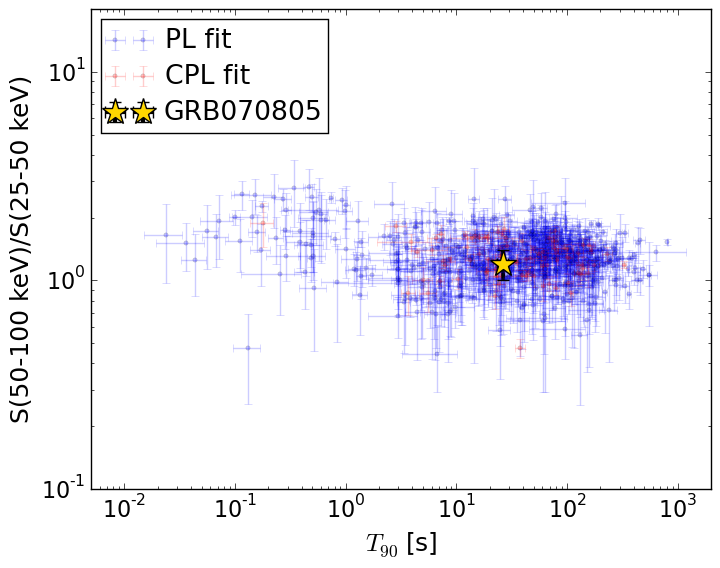
T90                                   = 26.432 sec.
Hardness ratio (energy fluence ratio) = 1.20378742349
S(15-50 keV) vs. S(50-150 keV) plot
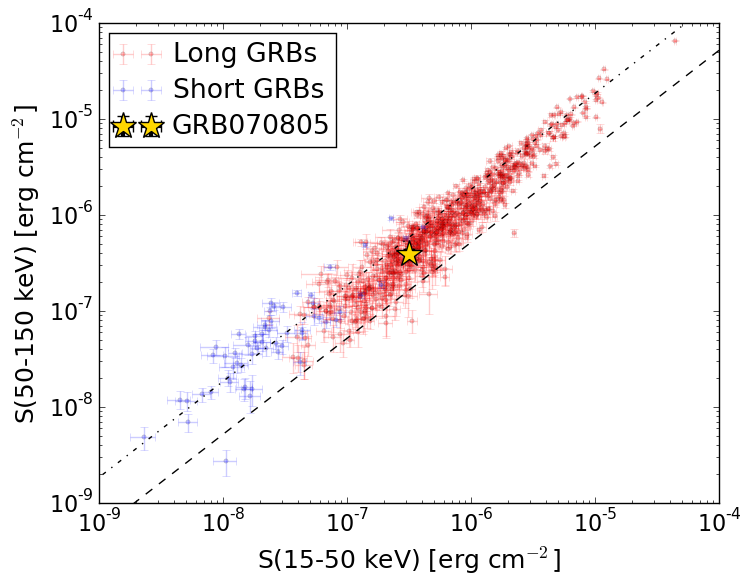
S(15-50 keV)  = 3.161858e-07
S(50-150 keV) = 3.923092e-07
The dash-dotted line and the dashed line traces the fluences calculated from the Band function with Epeak = 15 and 150 keV, respectively. Both lines assume a canonical values of alpha = -1 and beta = -2.5.
Mask shadow pattern
IMX = 6.050113605532932E-01, IMY = 3.856135393564443E-01
Spacecraft aspect plot
Bright source in the pre-burst/pre-slew/post-slew images
Pre-burst image of 15-350 keV band
Time interval of the image:
-239.584000 -0.844000

# RAcent  DECcent POSerr Theta    Phi  PeakCts   SNR AngSep     Name
#  [deg]    [deg]    ['] [deg]  [deg]                   [']
255.9305 -37.9624   50.6  47.0   -1.6  -0.0822  -0.2    7.6	4U 1700-377
256.4966 -36.3399    3.0  48.0    0.2   1.4893   3.9    5.8	GX 349+2
264.7101 -44.2727   18.0  37.9    0.4  -0.1528  -0.6   10.7	4U 1735-44
270.3716 -25.0268    5.2  51.3   21.3  -1.6715  -2.2    5.7	GX 5-1
270.2500 -25.6922    6.0  50.8   20.8   1.3686   1.9    4.2	GRS 1758-258
275.9595 -30.2517   10.0  44.4   23.8   0.4454   1.2    7.1	H1820-303
285.0628 -25.0251    9.4  45.4   37.3   0.7109   1.2    6.4	HT1900.1-2455
263.1322 -33.8071    9.2  47.0    8.2   0.4440   1.3    7.3	GX 354-0
 18.6545 -54.3013    2.0  28.9 -170.7   0.9633   5.9 ------	UNKNOWN
 40.8503 -30.7925    2.9  57.1 -175.4   3.4953   4.0 ------	UNKNOWN
Pre-slew background subtracted image of 15-350 keV band
Time interval of the image:
-0.844000 28.668000

# RAcent  DECcent POSerr Theta    Phi  PeakCts   SNR AngSep     Name
#  [deg]    [deg]    ['] [deg]  [deg]                   [']
256.0201 -37.8940   71.5  47.0   -1.5   0.0172   0.2    3.4	4U 1700-377
256.4675 -36.3922    4.0  48.0    0.1  -0.3126  -2.9    2.4	GX 349+2
264.8678 -44.5474    5.9  37.6    0.2   0.1417   2.0    7.9	4U 1735-44
270.3208 -25.0691    5.5  51.3   21.2   0.5530   2.1    2.1	GX 5-1
270.1807 -25.6483   56.3  50.9   20.7   0.0490   0.2    8.7	GRS 1758-258
275.9810 -30.5261    0.0  44.1   23.6   0.1359   1.1   10.0	H1820-303
284.9860 -25.0086    4.1  45.5   37.2  -0.5042  -2.8    5.9	HT1900.1-2455
262.9035 -33.9097    9.6  47.1    7.9  -0.1372  -1.2    6.2	GX 354-0
287.4469 -22.2015    1.8  47.2   41.6   1.5921   6.4 ------	UNKNOWN
245.0420 -59.9590    0.6  35.7  -32.5   1.2729  18.9 ------	UNKNOWN
126.2418 -76.1182    2.2  41.0  -96.3   1.1835   5.3 ------	UNKNOWN
Post-slew image of 15-350 keV band
Time interval of the image:
199.516600 962.488700

# RAcent  DECcent POSerr Theta    Phi  PeakCts   SNR AngSep     Name
#  [deg]    [deg]    ['] [deg]  [deg]                   [']
170.2899 -60.6135   11.6  58.1  -25.1   2.6048   1.0    0.9	Cen X-3
258.4259 -68.0117    2.0  52.7   17.9   9.0193   5.8 ------	UNKNOWN