Analysis Summary
Notes:
- 1) No attempt has been made to eliminate the non-significant decimal places.
- 2) This batgrbproduct analysis is done using the HEASARC data.
- 3) This batgrbproduct analysis is using the flight position for the mask-weighting calculation.
======================================================================
                  BAT GRB EVENT DATA PROCESSING REPORT
    Process Script Ver: batgrbproduct v2.46
    Process Start Time: Mon Jan 20 07:52:29 EST 2014
             Host Name: batevent1
   Current Working Dir: /local/data/batevent/batevent_reproc/trigger287260
======================================================================

  Trigger: 00287260      Segment: 000

  BAT Trigger Time: 208290482.688   [s; MET]
      Trigger Stop: 208290483.712   [s; MET]
               UTC: 2007-08-08T18:28:00.545880    [includes UTCF correction]
       Where From?: TDRSS position message

  BAT
    RA: 6.7657965873297   Dec: 1.16645825164436  [deg; J2000]

     Catalogged Source?: NO
     Point Source?:      YES
     GRB Indicated?:     YES    [ by BAT flight software ]
     Image S/N Ratio:    13.2
     Image Trigger?:     NO
     Rate S/N Ratio:     26.0959767013998  [ if not an image trigger ]
     Image S/N Ratio:    13.2

  Analysis Position:   [ source = BAT ]
    RA: 6.7657965873297   Dec: 1.16645825164436  [deg; J2000]

  Refined Position:   [ source = BAT pre-slew burst ]
    RA: 6.75541676803971   Dec: 1.17995009719578  [deg; J2000]
        { 00h 27m 01.3s , +01d 10' 47.8" }
         +/- 1.21463955997176 [arcmin] (estimated 90% radius based on SNR)
         +/- 0.490476840687234 [arcmin] (formal 1-sigma fit error)
    SNR: 23.0398265960603

  Angular difference between the analysis and refined position is 1.021279 arcmin

  Partial Coding Fraction: 0.4726562    [ including projection effects ]

  Duration
     T90: 58.431999951601 +/- 11.5085832385286
        Measured from: 0.00800001621246338
                   to: 58.4399999678135     [s; relative to TRIGTIME]
     T50: 20.6399999856949 +/- 5.76728426718169
        Measured from: 1.94400000572205
                   to: 22.5839999914169     [s; relative to TRIGTIME]


  Fluence
     Peak Flux  (peak 1 second)
        Measured from: 0.716000020503998
                   to: 1.716000020504     [s; relative to TRIGTIME]
     Total Fluence
        Measured from: -0.695999979972839
                   to: 69.1920000016689     [s; relative to TRIGTIME]

             Band 1     Band 2     Band 3     Band 4
              15-25      25-50     50-100    100-350     keV
 Total     0.535874   0.718552   0.589102   0.189780
           0.051406   0.053956   0.048122   0.041902 [error]
 Peak      0.035446   0.092198   0.085141   0.023174
           0.007660   0.008698   0.008475   0.006549 [error]

     [ fluence units of on-axis counts / fully illuminated detector ]

======================================================================


====== Table of the duration information =============================

        Value   tstart    tstop
T100   69.888   -0.696   69.192
T90    58.432    0.008   58.440
T50    20.640    1.944   22.584
Peak    1.000    0.716    1.716


====== Spectral Analysis Summary =====================================

Model      : spectral model: simple power-law (PL) and cutoff power-law (CPL)
Ph_index   : photon index: E^{Ph_index}
Ph_90err   : 90% error of the photon index
Epeak      : Epeak in keV
Epeak_90err: 90% error of Epeak
Norm       : normalization at 50 keV in both the PL model and CPL model
Nomr_90err : 90% error of the normalization
chi2       : Chi-Squared
dof        : degree of freedo

=== Time-averaged spectral analysis ===
(Best model with acceptable fit: PL)

Model Ph_index Ph_90err_low Ph_90err_hi  Epeak  Epeak_90err_low  Epeak_90err_hi  Norm       Nomr_90err_low    Norm_90err_hi    chi2    dof
PL      -1.444    -0.140      0.140       -           -               -         1.93e-03     -1.56e-04          1.55e-04      53.470   57
CPL     -1.170    -0.346      0.583      156.640    -156.640      -156.640      2.64e-03     -8.26e-04          2.38e-03      52.680   56


=== 1-s peak spectral analysis ===
(Best model with acceptable fit: PL)

Model Ph_index Ph_90err_low Ph_90err_hi  Epeak  Epeak_90err_low  Epeak_90err_hi  Norm       Nomr_90err_low    Norm_90err_hi    chi2    dof
PL      -1.127     -0.172     0.175       -           -               -         1.67e-02     -1.76e-03          1.76e-03      63.730   57
CPL     -0.273     -0.718     0.864      115.451     -32.417       260.725      4.02e-02     -2.07e-02          5.32e-02      59.480   56


=== Fluence/Peak Flux Summary ===

              Model    Band1     Band2     Band3     Band4     Band5     Total
                       15-25     25-50    50-100    100-350    15-150    15-350    keV
Fluence         PL   1.64e-07  3.11e-07  4.57e-07  1.44e-06  1.29e-06  2.37e-06   erg/cm2
      90%_error_low -2.30e-08 -2.71e-08 -4.65e-08 -2.94e-07 -1.13e-07 -3.31e-07   erg/cm2
      90%_error_hi   2.39e-08  2.68e-08  4.62e-08  3.42e-07  1.14e-07  3.70e-07   erg/cm2
Peak flux       PL   4.80e-01  6.03e-01  5.53e-01  8.84e-01  1.94e+00  2.52e+00   ph/cm2/s
      90%_error_low -9.45e-02 -7.71e-02 -6.41e-02 -1.96e-01 -2.11e-01 -2.77e-01   ph/cm2/s
      90%_error_hi   1.01e-01  7.62e-02  6.36e-02  2.27e-01  2.12e-01  2.81e-01   ph/cm2/s

Fluence        CPL   1.56e-07  3.20e-07  4.67e-07  9.64e-07  1.27e-06  1.91e-06   erg/cm2
      90%_error_low -2.75e-08 -3.13e-08 -5.03e-08 -4.92e-07 -1.23e-07 -5.04e-07   erg/cm2
      90%_error_hi   2.80e-08  3.22e-08  5.15e-08  7.86e-07  1.22e-07  5.99e-07   erg/cm2
Peak flux      CPL   3.86e-01  6.32e-01  6.11e-01  4.35e-01  1.88e+00  2.06e+00   ph/cm2/s
      90%_error_low -1.16e-01 -8.66e-02 -8.12e-02 -1.88e-01 -2.17e-01 -2.96e-01   ph/cm2/s
      90%_error_hi   1.25e-01  8.76e-02  8.36e-02  3.55e-01  2.17e-01  3.97e-01   ph/cm2/s

======================================================================
Image
Pre-slew 15.0-350.0 keV image (Event data)
#   RAcent    DECcent   POSerr    Theta     Phi              Peak Cts       SNR   Name
    6.7554     1.1800   0.0084    39.4156   168.3936         1.4986909     23.040 TRIG_00287260

Foreground time interval of the image:
 -0.696  18.213 (delta_t =  18.909 [sec])
Background time interval of the image:
-239.688  -0.696 (delta_t = 238.992 [sec])
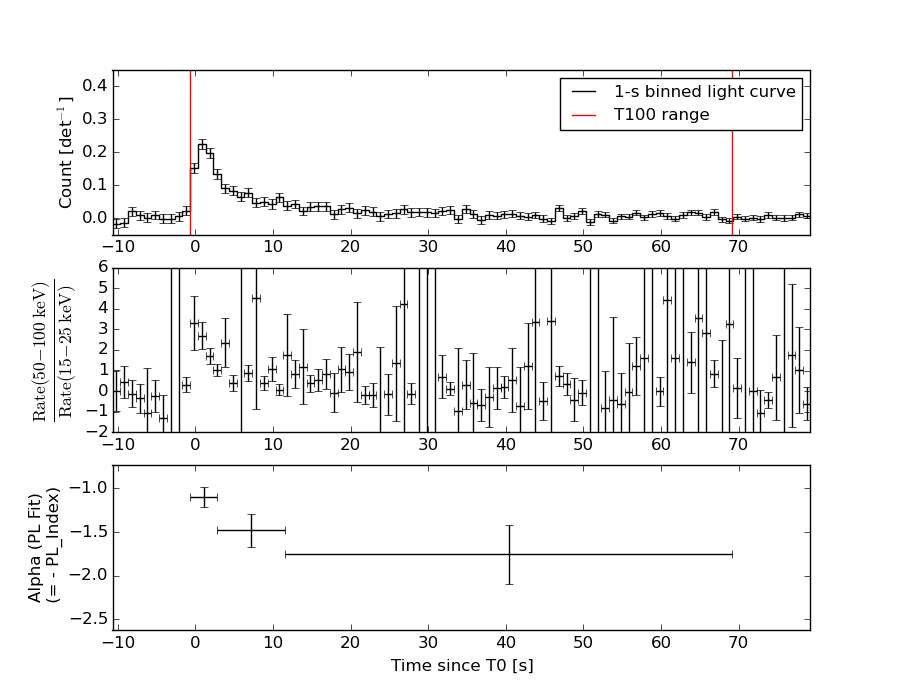
Light Curves
Note: The mask-weighted lightcurves have units of either count/det or counts/sec/det, where a det is 0.4 x 0.4 = 0.16 sq cm.
Full-time range; 1 s binning
Other quick-look light curves:
- 64 ms binning (zoomed)
- 16 ms binning (zoomed)
- 8 ms binning (zoomed)
- 2 ms binning (zoomed)
- SN=5 or 10 s binning (full-time range)
- Raw light curve
Spectra
- 64 ms binning (zoomed)
- 16 ms binning (zoomed)
- 8 ms binning (zoomed)
- 2 ms binning (zoomed)
- SN=5 or 10 s binning (full-time range)
- Raw light curve
Spectra
Notes:
- 1) The fitting includes the systematic errors.
- 2) When the burst includes telescope slew time periods, the fitting uses an average response file made from multiple 5-s response files through out the slew time plus single time preiod for the non-slew times, and weighted by the total counts in the corresponding time period using addrmf. An average response file is needed becuase a spectral fit using the pre-slew DRM will introduce some errors in both a spectral shape and a normalization if the PHA file contains a lot of the slew/post-slew time interval.
- 3) For fits to more complicated models (e.g. a power-law over a cutoff power-law), the BAT team has decided to require a chi-square improvement of more than 6 for each extra dof.
Time averaged spectrum fit using the average DRM
Power-law model
Time interval is from   -0.696 sec. to   69.192 sec.

Spectral model in power-law:
------------------------------------------------------------
Parameters  : value       lower 90%   higher 90%
Photon index: -1.44417     ( -0.140075   0.140017 )
Norm@50keV  : 1.93171E-03    ( -0.000155657   0.000155207 )
------------------------------------------------------------
#Fit statistic : Chi-Squared =          53.47 using 59 PHA bins.
# Reduced chi-squared =         0.9381 for     57 degrees of freedom
# Null hypothesis probability =   6.081753e-01

Photon flux (15-150 keV)    in 69.89 sec: 0.237720 ( -0.019683  0.019725 ) ph/cm2/s
Energy fluence (15-150 keV)             : 1.29347e-06 ( -1.13161e-07  1.13988e-07 ) ergs/cm2
Cutoff power-law model
Time interval is from   -0.696 sec. to   69.192 sec.
Spectral model in the cutoff power-law:
------------------------------------------------------------
Parameters  : value       lower 90%   higher 90%
Photon index: -1.17027     ( -0.345673   0.583336 )
Epeak [keV] : 156.640      ( -156.64 -156.64 )
Norm@50keV  : 2.63620E-03    ( -0.000826193   0.00237853 )
------------------------------------------------------------
#Fit statistic : Chi-Squared =          52.68 using 59 PHA bins.
# Reduced chi-squared =         0.9407 for     56 degrees of freedom
# Null hypothesis probability =   6.013542e-01

Photon flux (15-150 keV)    in 69.89 sec: 0.234775 ( -0.020489  0.020482 ) ph/cm2/s
Energy fluence (15-150 keV)             : 1.26989e-06 ( -1.23385e-07  1.2242e-07 ) ergs/cm2
1-s peak spectrum fit
Power-law model
Time interval is from    0.716 sec. to    1.716 sec.

Spectral model in power-law:
------------------------------------------------------------
Parameters  : value       lower 90%   higher 90%
Photon index: -1.1268     ( -0.172322   0.175161 )
Norm@50keV  : 1.66587E-02    ( -0.00175923   0.00175748 )
------------------------------------------------------------
#Fit statistic : Chi-Squared =          63.73 using 59 PHA bins.
# Reduced chi-squared =          1.118 for     57 degrees of freedom
# Null hypothesis probability =   2.518553e-01

Photon flux (15-150 keV)    in 1 sec: 1.93763 ( -0.21104  0.2116 ) ph/cm2/s
Energy fluence (15-150 keV)             : 1.72727e-07 ( -1.9523e-08  1.96132e-08 ) ergs/cm2
Cutoff power-law model
Time interval is from    0.716 sec. to    1.716 sec.
Spectral model in the cutoff power-law:
------------------------------------------------------------
Parameters  : value       lower 90%   higher 90%
Photon index: -0.272777     ( -0.717645   0.864043 )
Epeak [keV] : 115.451      ( -32.4167 260.725 )
Norm@50keV  : 4.02482E-02    ( -0.0207147   0.0531823 )
------------------------------------------------------------
#Fit statistic : Chi-Squared =          59.48 using 59 PHA bins.
# Reduced chi-squared =          1.062 for     56 degrees of freedom
# Null hypothesis probability =   3.501595e-01

Photon flux (15-150 keV)    in 1 sec: 1.87900 ( -0.21692  0.21732 ) ph/cm2/s
Energy fluence (15-150 keV)             : 1.67275e-07 ( -2.06527e-08  2.05399e-08 ) ergs/cm2
Time-resolved spectra
Distribution
T90 vs. Hardness ratio plot
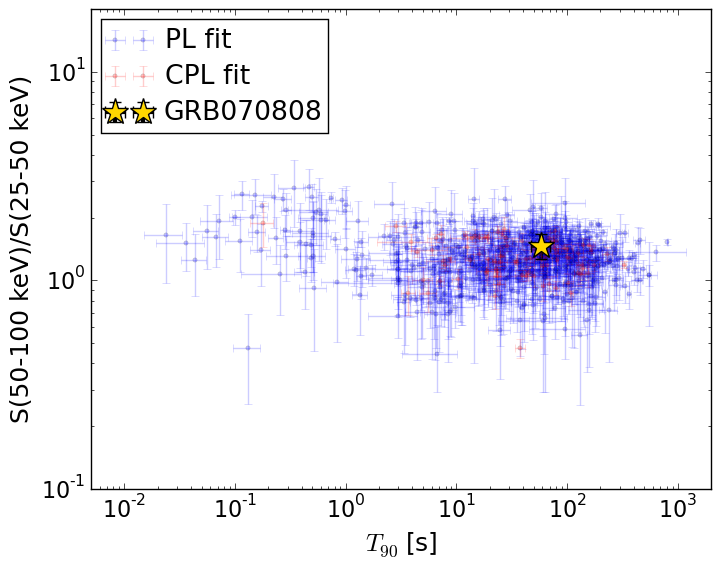
T90                                   = 58.432 sec.
Hardness ratio (energy fluence ratio) = 1.47004286525
S(15-50 keV) vs. S(50-150 keV) plot
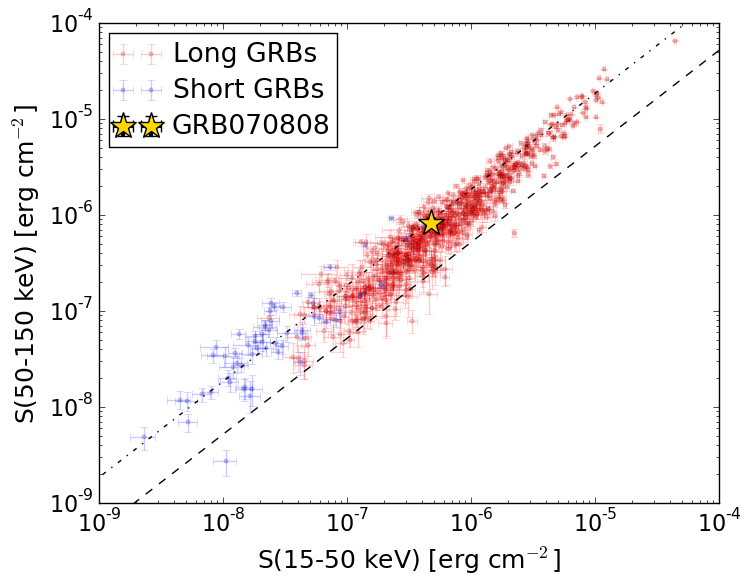
S(15-50 keV)  = 4.74676e-07
S(50-150 keV) = 8.188052e-07
The dash-dotted line and the dashed line traces the fluences calculated from the Band function with Epeak = 15 and 150 keV, respectively. Both lines assume a canonical values of alpha = -1 and beta = -2.5.
Mask shadow pattern
IMX = -8.050618673514568E-01, IMY = -1.653486430327001E-01
Spacecraft aspect plot
Bright source in the pre-burst/pre-slew/post-slew images
Pre-burst image of 15-350 keV band
Time interval of the image:
-239.688000 -0.696000

# RAcent  DECcent POSerr Theta    Phi  PeakCts   SNR AngSep     Name
#  [deg]    [deg]    ['] [deg]  [deg]                   [']
321.7042 -32.0040    3.1  22.2   46.4   0.6393   3.7 ------	UNKNOWN
 28.6455  -5.4551    2.8  47.2 -159.9   1.2629   4.2 ------	UNKNOWN
297.9455 -71.6687    2.7  45.6  -21.9   1.1807   4.2 ------	UNKNOWN
 17.7378 -47.7305    2.9  25.9  -91.2   0.8037   4.1 ------	UNKNOWN
 41.5622 -36.9817    3.2  42.9 -112.0   2.5826   3.6 ------	UNKNOWN
Pre-slew background subtracted image of 15-350 keV band
Time interval of the image:
-0.696000 18.212600

# RAcent  DECcent POSerr Theta    Phi  PeakCts   SNR AngSep     Name
#  [deg]    [deg]    ['] [deg]  [deg]                   [']
328.9073   1.8429    2.5  40.3  107.6   0.7315   4.5 ------	UNKNOWN
  6.7554   1.1799    0.5  39.4  168.4   1.4987  23.0  411.4	UNKNOWN
299.9229 -62.3712    2.7  41.1  -10.0   0.2517   4.3 ------	UNKNOWN
Post-slew image of 15-350 keV band
Time interval of the image:
96.812590 962.332100

# RAcent  DECcent POSerr Theta    Phi  PeakCts   SNR AngSep     Name
#  [deg]    [deg]    ['] [deg]  [deg]                   [']
326.2024  38.4114    9.9  52.6  162.1   1.8592   1.2    5.6	Cyg X-2
334.6439 -24.0649    3.3  40.2   71.0   5.0860   3.5 ------	UNKNOWN
339.5293  46.9085    3.0  51.5  178.4   3.9343   3.8 ------	UNKNOWN
 50.4122  -1.8961    4.7  43.7  -64.0   6.0566   2.5 ------	UNKNOWN