Analysis Summary
Notes:
- 1) No attempt has been made to eliminate the non-significant decimal places.
- 2) This batgrbproduct analysis is done using the HEASARC data.
- 3) This batgrbproduct analysis is using the flight position for the mask-weighting calculation.
======================================================================
                  BAT GRB EVENT DATA PROCESSING REPORT
    Process Script Ver: batgrbproduct v2.46
    Process Start Time: Mon Jan 20 07:47:58 EST 2014
             Host Name: batevent1
   Current Working Dir: /local/data/batevent/batevent_reproc/trigger287344
======================================================================

  Trigger: 00287344      Segment: 000

  BAT Trigger Time: 208380139.52   [s; MET]
      Trigger Stop: 208380140.544   [s; MET]
               UTC: 2007-08-09T19:22:17.375600    [includes UTCF correction]
       Where From?: TDRSS position message

  BAT
    RA: 203.781773398037   Dec: -22.1339357183962  [deg; J2000]

     Catalogged Source?: NO
     Point Source?:      YES
     GRB Indicated?:     YES    [ by BAT flight software ]
     Image S/N Ratio:    10.98
     Image Trigger?:     NO
     Rate S/N Ratio:     19.157244060668  [ if not an image trigger ]
     Image S/N Ratio:    10.98

  Analysis Position:   [ source = BAT ]
    RA: 203.781773398037   Dec: -22.1339357183962  [deg; J2000]

  Refined Position:   [ source = BAT pre-slew burst ]
    RA: 203.76740510343   Dec: -22.1212600129841  [deg; J2000]
        { 13h 35m 04.2s , -22d 07' 16.5" }
         +/- 1.70597246536292 [arcmin] (estimated 90% radius based on SNR)
         +/- 0.613692198490191 [arcmin] (formal 1-sigma fit error)
    SNR: 14.1817486476817

  Angular difference between the analysis and refined position is 1.102810 arcmin

  Partial Coding Fraction: 0.7421875    [ including projection effects ]

  Duration
     T90: 1.28000003099442 +/- 0.373180900662322
        Measured from: -0.288000017404556
                   to: 0.992000013589859     [s; relative to TRIGTIME]
     T50: 0.512000024318695 +/- 0.143108347361266
        Measured from: 0.223999977111816
                   to: 0.736000001430511     [s; relative to TRIGTIME]


  Fluence
     Peak Flux  (peak 1 second)
        Measured from: 0.0759999752044678
                   to: 1.07599997520447     [s; relative to TRIGTIME]
     Total Fluence
        Measured from: -0.351999998092651
                   to: 1.11999997496605     [s; relative to TRIGTIME]

             Band 1     Band 2     Band 3     Band 4
              15-25      25-50     50-100    100-350     keV
 Total     0.055939   0.071576   0.040574   0.018735
           0.006880   0.007421   0.006373   0.005314 [error]
 Peak      0.044999   0.063116   0.035611   0.013448
           0.005791   0.006295   0.005425   0.004472 [error]

     [ fluence units of on-axis counts / fully illuminated detector ]

======================================================================


====== Table of the duration information =============================

        Value   tstart    tstop
T100    1.472   -0.352    1.120
T90     1.280   -0.288    0.992
T50     0.512    0.224    0.736
Peak    1.000    0.076    1.076


====== Spectral Analysis Summary =====================================

Model      : spectral model: simple power-law (PL) and cutoff power-law (CPL)
Ph_index   : photon index: E^{Ph_index}
Ph_90err   : 90% error of the photon index
Epeak      : Epeak in keV
Epeak_90err: 90% error of Epeak
Norm       : normalization at 50 keV in both the PL model and CPL model
Nomr_90err : 90% error of the normalization
chi2       : Chi-Squared
dof        : degree of freedo

=== Time-averaged spectral analysis ===
(Best model with acceptable fit: PL)

Model Ph_index Ph_90err_low Ph_90err_hi  Epeak  Epeak_90err_low  Epeak_90err_hi  Norm       Nomr_90err_low    Norm_90err_hi    chi2    dof
PL      -1.660    -0.216      0.209       -           -               -         7.43e-03     -1.01e-03          9.85e-04      62.880   57
CPL     -1.431    -0.437      1.071      111.131     -86.486      -111.131      9.96e-03     -6.04e-03          2.91e-02      62.710   56


=== 1-s peak spectral analysis ===
(Best model with acceptable fit: PL)

Model Ph_index Ph_90err_low Ph_90err_hi  Epeak  Epeak_90err_low  Epeak_90err_hi  Norm       Nomr_90err_low    Norm_90err_hi    chi2    dof
PL      -1.544     -0.206     0.202       -           -               -         9.62e-03     -1.22e-03          1.20e-03      52.980   57
CPL     -1.334     -0.408     0.993      145.479    -145.479      -145.479      1.26e-02        N/A               N/A         52.800   56


=== Fluence/Peak Flux Summary ===

              Model    Band1     Band2     Band3     Band4     Band5     Total
                       15-25     25-50    50-100    100-350    15-150    15-350    keV
Fluence         PL   1.62e-08  2.70e-08  3.42e-08  8.66e-08  1.02e-07  1.64e-07   erg/cm2
      90%_error_low -2.91e-09 -3.23e-09 -6.19e-09 -2.82e-08 -1.45e-08 -3.48e-08   erg/cm2
      90%_error_hi   3.00e-09  3.23e-09  6.21e-09  3.61e-08  1.48e-08  4.12e-08   erg/cm2
Peak flux       PL   4.13e-01  4.05e-01  2.78e-01  3.00e-01  1.22e+00  1.40e+00   ph/cm2/s
      90%_error_low -7.69e-02 -4.93e-02 -4.48e-02 -8.65e-02 -1.44e-01 -1.69e-01   ph/cm2/s
      90%_error_hi   8.01e-02  4.90e-02  4.45e-02  1.06e-01  1.44e-01  1.71e-01   ph/cm2/s

Fluence        CPL   1.56e-08  2.12e-08  2.23e-08  5.28e-08  7.33e-08  1.12e-07   erg/cm2
      90%_error_low -3.98e-09 -5.05e-09 -5.22e-09    N/A    -1.13e-08 -2.52e-08   erg/cm2
      90%_error_hi   3.38e-09  3.68e-09  4.71e-09    N/A     9.11e-09  2.15e-08   erg/cm2
Peak flux      CPL   4.03e-01  4.16e-01  2.81e-01  2.23e-01  1.21e+00  1.32e+00   ph/cm2/s
      90%_error_low -8.79e-02 -5.80e-02 -4.66e-02     N/A   -1.48e-01 -2.21e-01   ph/cm2/s
      90%_error_hi   8.58e-02  6.80e-02  4.81e-02     N/A    1.47e-01  2.31e-01   ph/cm2/s

======================================================================
Image
Pre-slew 15.0-350.0 keV image (Event data)
#   RAcent    DECcent   POSerr    Theta     Phi              Peak Cts       SNR   Name
  203.7674   -22.1213   0.0135    18.7851   108.6904         0.1903166     14.182 TRIG_00287344

Foreground time interval of the image:
 -0.352   1.120 (delta_t =   1.472 [sec])
Background time interval of the image:
-239.520  -0.352 (delta_t = 239.168 [sec])
Light Curves
Note: The mask-weighted lightcurves have units of either count/det or counts/sec/det, where a det is 0.4 x 0.4 = 0.16 sq cm.
Full-time range; 1 s binning
Other quick-look light curves:
- 64 ms binning (zoomed)
- 16 ms binning (zoomed)
- 8 ms binning (zoomed)
- 2 ms binning (zoomed)
- SN=5 or 10 s binning (full-time range)
- Raw light curve
Spectra
- 64 ms binning (zoomed)
- 16 ms binning (zoomed)
- 8 ms binning (zoomed)
- 2 ms binning (zoomed)
- SN=5 or 10 s binning (full-time range)
- Raw light curve
Spectra
Notes:
- 1) The fitting includes the systematic errors.
- 2) When the burst includes telescope slew time periods, the fitting uses an average response file made from multiple 5-s response files through out the slew time plus single time preiod for the non-slew times, and weighted by the total counts in the corresponding time period using addrmf. An average response file is needed becuase a spectral fit using the pre-slew DRM will introduce some errors in both a spectral shape and a normalization if the PHA file contains a lot of the slew/post-slew time interval.
- 3) For fits to more complicated models (e.g. a power-law over a cutoff power-law), the BAT team has decided to require a chi-square improvement of more than 6 for each extra dof.
Time averaged spectrum fit using the average DRM
Power-law model

Time interval is from   -0.352 sec. to    1.120 sec.

Spectral model in power-law:
------------------------------------------------------------
Parameters  : value       lower 90%   higher 90%
Photon index: -1.6601     ( -0.216476   0.209324 )
Norm@50keV  : 7.42670E-03    ( -0.00100568   0.000985353 )
------------------------------------------------------------
#Fit statistic : Chi-Squared =          62.88 using 59 PHA bins.
# Reduced chi-squared =          1.103 for     57 degrees of freedom
# Null hypothesis probability =   2.758412e-01

Photon flux (15-150 keV)    in 1.472 sec: 0.973036 ( -0.116332  0.116354 ) ph/cm2/s
Energy fluence (15-150 keV)             : 1.01587e-07 ( -1.45071e-08  1.47687e-08 ) ergs/cm2
Cutoff power-law model
Time interval is from   -0.352 sec. to    1.120 sec.
Spectral model in the cutoff power-law:
------------------------------------------------------------
Parameters  : value       lower 90%   higher 90%
Photon index: -1.43128     ( -0.43492   1.07324 )
Epeak [keV] : 111.131      ( -87.6507 -112.296 )
Norm@50keV  : 9.96206E-03    ( -0.00598609   0.0291226 )
------------------------------------------------------------
#Fit statistic : Chi-Squared =          62.71 using 59 PHA bins.
# Reduced chi-squared =          1.120 for     56 degrees of freedom
# Null hypothesis probability =   2.505624e-01

Photon flux (15-150 keV)    in 1.472 sec: 0.965455 ( -0.120897  0.115145 ) ph/cm2/s
Energy fluence (15-150 keV)             : 7.33209e-08 ( -1.12858e-08  9.10956e-09 ) ergs/cm2
1-s peak spectrum fit
Power-law model
Time interval is from    0.076 sec. to    1.076 sec.

Spectral model in power-law:
------------------------------------------------------------
Parameters  : value       lower 90%   higher 90%
Photon index: -1.54443     ( -0.205684   0.201656 )
Norm@50keV  : 9.62286E-03    ( -0.00121752   0.00120163 )
------------------------------------------------------------
#Fit statistic : Chi-Squared =          52.98 using 59 PHA bins.
# Reduced chi-squared =         0.9295 for     57 degrees of freedom
# Null hypothesis probability =   6.265096e-01

Photon flux (15-150 keV)    in 1 sec: 1.21627 ( -0.14373  0.14379 ) ph/cm2/s
Energy fluence (15-150 keV)             : 9.06755e-08 ( -1.24749e-08  1.26553e-08 ) ergs/cm2
Cutoff power-law model
Time interval is from    0.076 sec. to    1.076 sec.
Spectral model in the cutoff power-law:
------------------------------------------------------------
Parameters  : value       lower 90%   higher 90%
Photon index: -1.33368     ( -0.40764   0.993888 )
Epeak [keV] : 145.479      ( -145.934 -145.934 )
Norm@50keV  : 1.25545E-02    (     )
------------------------------------------------------------
#Fit statistic : Chi-Squared =          52.80 using 59 PHA bins.
# Reduced chi-squared =         0.9429 for     56 degrees of freedom
# Null hypothesis probability =   5.965794e-01

Photon flux (15-150 keV)    in 1 sec: 1.20810 ( -0.14805  0.14729 ) ph/cm2/s
Energy fluence (15-150 keV)             : 8.87973e-08 ( -1.48674e-08  1.3834e-08 ) ergs/cm2
Time-resolved spectra
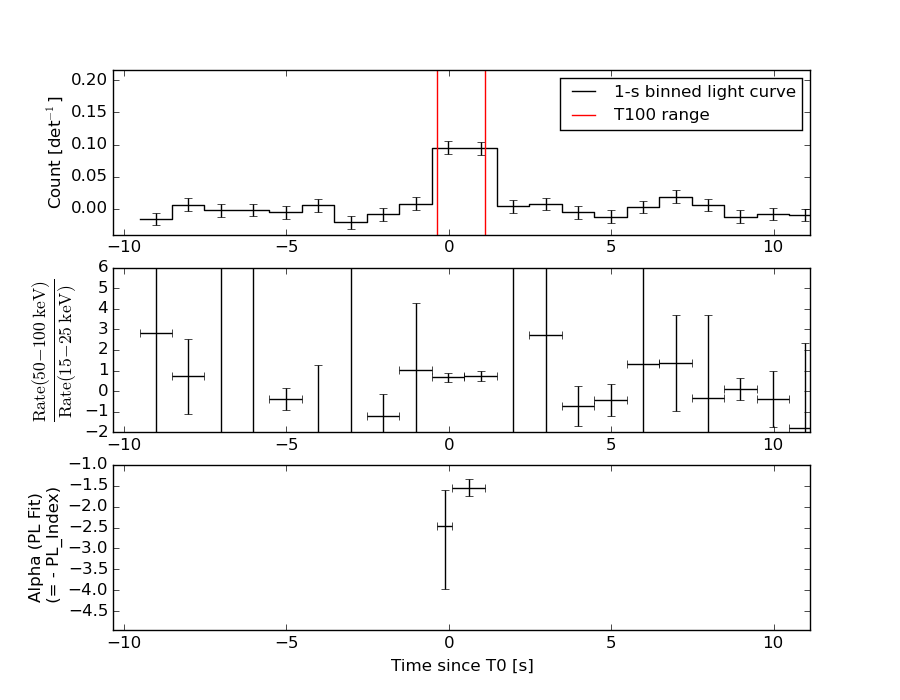
Distribution
T90 vs. Hardness ratio plot
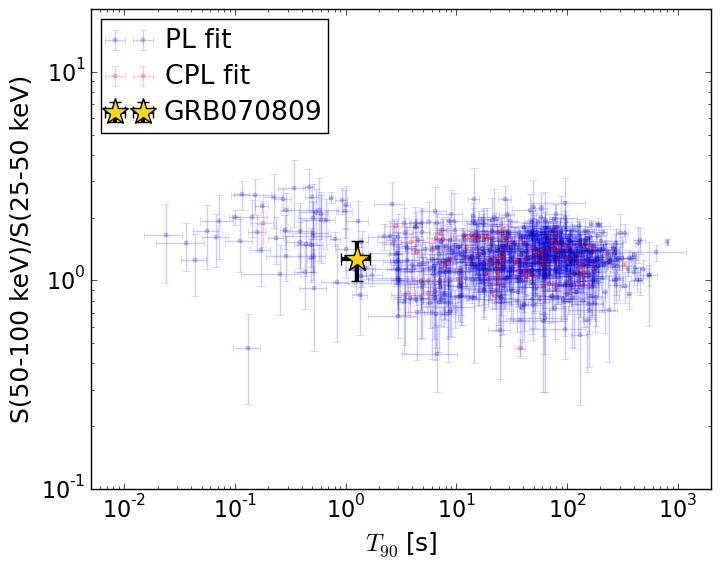
T90                                   = 1.28 sec.
Hardness ratio (energy fluence ratio) = 1.26569745856
S(15-50 keV) vs. S(50-150 keV) plot
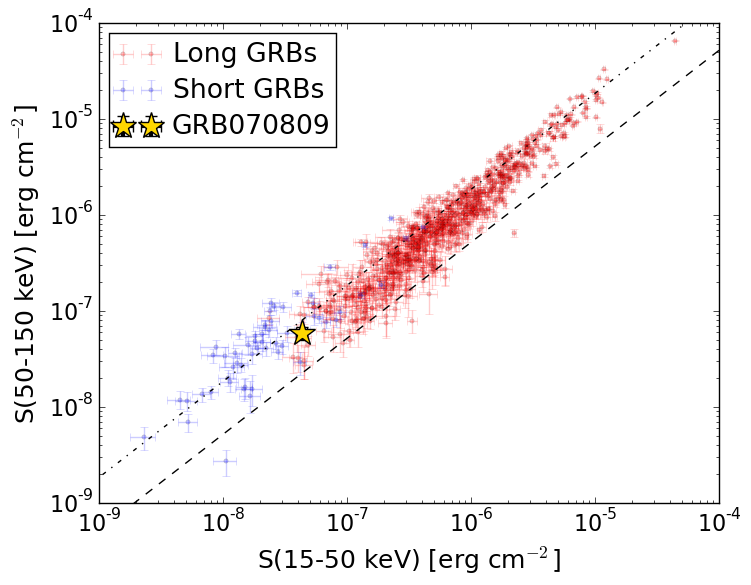
S(15-50 keV)  = 4.326644e-08
S(50-150 keV) = 5.832008e-08
The dash-dotted line and the dashed line traces the fluences calculated from the Band function with Epeak = 15 and 150 keV, respectively. Both lines assume a canonical values of alpha = -1 and beta = -2.5.
Mask shadow pattern
IMX = -1.089985465655456E-01, IMY = -3.221998356877339E-01
Spacecraft aspect plot
Bright source in the pre-burst/pre-slew/post-slew images
Pre-burst image of 15-350 keV band
Time interval of the image:
-239.520000 -0.352000

# RAcent  DECcent POSerr Theta    Phi  PeakCts   SNR AngSep     Name
#  [deg]    [deg]    ['] [deg]  [deg]                   [']
233.0926 -10.5640    2.2  41.2   63.9   3.0668   5.4 ------	UNKNOWN
182.8025 -57.4932    2.4  50.4  152.4   3.3696   4.7 ------	UNKNOWN
200.5507 -33.2061    3.1  27.0  129.5   0.7883   3.7 ------	UNKNOWN
231.6355  24.5618    2.6  50.6   15.8   2.1398   4.5 ------	UNKNOWN
227.7106  36.1780    2.5  55.4    1.8   2.9688   4.6 ------	UNKNOWN
207.1651  20.5154    2.8  32.0   -5.1   0.8027   4.1 ------	UNKNOWN
199.2841  28.6414    2.2  36.9  -22.2   1.0903   5.1 ------	UNKNOWN
167.4939   3.4485    2.9  26.3  -99.8   0.8485   3.9 ------	UNKNOWN
Pre-slew background subtracted image of 15-350 keV band
Time interval of the image:
-0.352000 1.120000

# RAcent  DECcent POSerr Theta    Phi  PeakCts   SNR AngSep     Name
#  [deg]    [deg]    ['] [deg]  [deg]                   [']
209.5445 -50.3269    2.2  45.4  130.3   0.2636   5.2 ------	UNKNOWN
218.4166 -29.9932    2.8  33.8  101.6   0.1046   4.2 ------	UNKNOWN
203.7674 -22.1212    0.8  18.8  108.7   0.1903  14.2 ------	UNKNOWN
169.5530   4.1764    2.8  24.8  -96.2   0.0601   4.1 ------	UNKNOWN
145.2290 -16.7045    2.4  46.0 -139.6   0.1266   4.7 ------	UNKNOWN
190.8698  42.8186    2.5  50.3  -34.2   0.1641   4.7 ------	UNKNOWN
Post-slew image of 15-350 keV band
Time interval of the image:
59.980580 664.727800
665.480000 962.553200

# RAcent  DECcent POSerr Theta    Phi  PeakCts   SNR AngSep     Name
#  [deg]    [deg]    ['] [deg]  [deg]                   [']
170.4047 -60.4471    0.0  44.8  177.5  -1.3534  -1.3   10.9	Cen X-3
186.7004 -62.7730    1.2  42.3  166.3   9.5877  10.0    1.2	GX 301-2
244.9796 -15.6340    0.4  39.4   62.8  56.7932  27.2    0.4	Sco X-1
244.3059   9.3814    2.2  50.7   30.8  11.5441   5.2 ------	UNKNOWN
151.7797 -27.4734    2.9  47.2 -132.8   7.6498   4.0 ------	UNKNOWN
146.0524 -31.4753    3.3  51.8 -138.6   9.3394   3.5 ------	UNKNOWN