Analysis Summary
Notes:
- 1) No attempt has been made to eliminate the non-significant decimal places.
- 2) This batgrbproduct analysis is done using the HEASARC data.
- 3) This batgrbproduct analysis is using the flight position for the mask-weighting calculation.
======================================================================
                  BAT GRB EVENT DATA PROCESSING REPORT
    Process Script Ver: batgrbproduct v2.46
    Process Start Time: Mon Jan 20 07:34:03 EST 2014
             Host Name: batevent1
   Current Working Dir: /local/data/batevent/batevent_reproc/trigger287409
======================================================================

  Trigger: 00287409      Segment: 000

  BAT Trigger Time: 208451960.036   [s; MET]
      Trigger Stop: 208451960.1   [s; MET]
               UTC: 2007-08-10T15:19:17.889760    [includes UTCF correction]
       Where From?: (*SHORT BURST*) TDRSS scaled map message

  BAT
    RA: 8.94039483391689   Dec: 8.83544274479816  [deg; J2000]

     Catalogged Source?: NO
     Point Source?:      YES
     GRB Indicated?:     YES    [ by BAT flight software ]
     Image S/N Ratio:    6.79
     Image Trigger?:     NO
     Rate S/N Ratio:     15.3948043183407  [ if not an image trigger ]
     Image S/N Ratio:    6.79

  Analysis Position:   [ source = BAT ]
    RA: 8.94039483391689   Dec: 8.83544274479816  [deg; J2000]

  Refined Position:   [ source = BAT pre-slew burst ]
    RA: 8.95523251043837   Dec: 8.81882137939258  [deg; J2000]
        { 00h 35m 49.3s , +08d 49' 07.8" }
         +/- 2.48517876657543 [arcmin] (estimated 90% radius based on SNR)
         +/- 1.17562189893019 [arcmin] (formal 1-sigma fit error)
    SNR: 8.28555795667913

  Angular difference between the analysis and refined position is 1.329839 arcmin

  Partial Coding Fraction: 1.03125    [ including projection effects ]

  Duration
     T90: 0.0719999969005585 +/- 0.0233237884026992
        Measured from: -0.00400000810623169
                   to: 0.0679999887943268     [s; relative to TRIGTIME]
     T50: 0.0280000269412994 +/- 0.019999998807908
        Measured from: 0.015999972820282
                   to: 0.0439999997615814     [s; relative to TRIGTIME]


  Fluence
     Peak Flux  (peak 1 second)
        Measured from: -0.464000016450882
                   to: 0.535999983549118     [s; relative to TRIGTIME]
     Total Fluence
        Measured from: -0.00800001621246338
                   to: 0.0759999752044678     [s; relative to TRIGTIME]

             Band 1     Band 2     Band 3     Band 4
              15-25      25-50     50-100    100-350     keV
 Total     0.006922   0.007626   0.007570   0.002273
           0.001572   0.001703   0.001699   0.001250 [error]
 Peak      0.009539   0.013606   0.005849   0.004542
           0.004499   0.004689   0.004287   0.003913 [error]

     [ fluence units of on-axis counts / fully illuminated detector ]

======================================================================


====== Table of the duration information =============================

        Value   tstart    tstop
T100    0.084   -0.008    0.076
T90     0.072   -0.004    0.068
T50     0.028    0.016    0.044
Peak    1.000   -0.464    0.536


====== Spectral Analysis Summary =====================================

Model      : spectral model: simple power-law (PL) and cutoff power-law (CPL)
Ph_index   : photon index: E^{Ph_index}
Ph_90err   : 90% error of the photon index
Epeak      : Epeak in keV
Epeak_90err: 90% error of Epeak
Norm       : normalization at 50 keV in both the PL model and CPL model
Nomr_90err : 90% error of the normalization
chi2       : Chi-Squared
dof        : degree of freedo

=== Time-averaged spectral analysis ===
(Best model with acceptable fit: PL)

Model Ph_index Ph_90err_low Ph_90err_hi  Epeak  Epeak_90err_low  Epeak_90err_hi  Norm       Nomr_90err_low    Norm_90err_hi    chi2    dof
PL      -1.054    -0.355      0.367       -           -               -         1.84e-02     -3.73e-03          3.73e-03      61.410   57
CPL     -1.006    -3.054      1.220      999.292      N/A           N/A         1.96e-02        N/A               N/A         61.460   56


=== 1-s peak spectral analysis ===
(Best model with acceptable fit: N/A)

Model Ph_index Ph_90err_low Ph_90err_hi  Epeak  Epeak_90err_low  Epeak_90err_hi  Norm       Nomr_90err_low    Norm_90err_hi    chi2    dof
PL      -1.311     -0.735     0.784       -           -               -         2.14e-03     -8.91e-04          8.68e-04      45.750   57
CPL     -1.313     -0.717     1.255     9999.260    -9999.260      -9999.260      2.14e-03     -2.14e-03          -2.14e-03      45.750   56


=== Fluence/Peak Flux Summary ===

              Model    Band1     Band2     Band3     Band4     Band5     Total
                       15-25     25-50    50-100    100-350    15-150    15-350    keV
Fluence         PL   1.30e-09  3.15e-09  6.07e-09  2.86e-08  1.64e-08  3.92e-08   erg/cm2
      90%_error_low -4.87e-10 -7.66e-10 -1.44e-09 -1.27e-08 -3.69e-09 -1.39e-08   erg/cm2
      90%_error_hi   5.46e-10  7.37e-10  1.40e-09  1.84e-08  3.72e-09  1.88e-08   erg/cm2
Peak flux       PL   7.34e-02  8.26e-02  6.66e-02  8.94e-02  2.55e-01  3.12e-01   ph/cm2/s
      90%_error_low -4.64e-02 -3.72e-02 -3.38e-02 -8.94e-02 -1.03e-01 -1.30e-01   ph/cm2/s
      90%_error_hi   5.43e-02  3.52e-02  3.35e-02  1.41e-01  1.03e-01  1.44e-01   ph/cm2/s

Fluence        CPL   1.32e-09  3.13e-09  5.96e-09  3.03e-08  1.65e-08  3.81e-08   erg/cm2
      90%_error_low    N/A    -7.74e-10 -1.62e-09    N/A    -4.53e-09 -2.20e-08   erg/cm2
      90%_error_hi     N/A     8.58e-10  2.06e-09    N/A     3.84e-09  9.28e-09   erg/cm2
Peak flux      CPL   7.45e-02  8.24e-02  6.65e-02  9.12e-02  2.56e-01  3.12e-01   ph/cm2/s
      90%_error_low -4.99e-02 -3.66e-02 -6.65e-02 -9.12e-02 -1.05e-01 -9.98e-02   ph/cm2/s
      90%_error_hi   5.31e-02  7.69e-02  3.60e-02  1.37e-01  1.03e-01  1.30e-01   ph/cm2/s

======================================================================
Image
Pre-slew 15.0-350.0 keV image (Event data)
#   RAcent    DECcent   POSerr    Theta     Phi              Peak Cts       SNR   Name
    8.9552     8.8188   0.0232     7.9419  -151.4026         0.0250508      8.286 TRIG_00287409

Foreground time interval of the image:
 -0.008   0.076 (delta_t =   0.084 [sec])
Background time interval of the image:
-150.935  -0.008 (delta_t = 150.927 [sec])
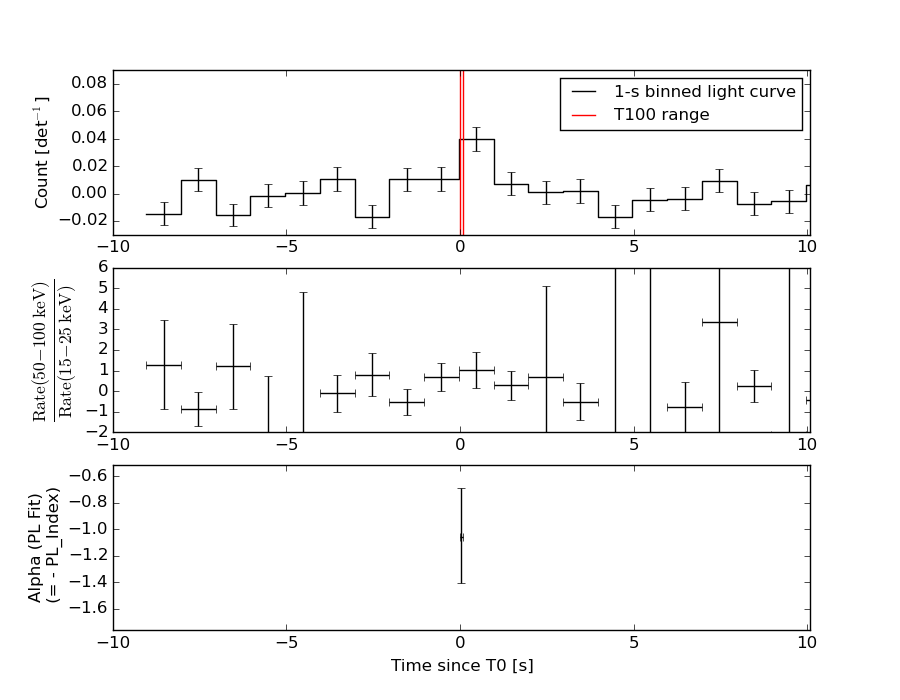
Light Curves
Note: The mask-weighted lightcurves have units of either count/det or counts/sec/det, where a det is 0.4 x 0.4 = 0.16 sq cm.
Full-time range; 1 s binning
Other quick-look light curves:
- 64 ms binning (zoomed)
- 16 ms binning (zoomed)
- 8 ms binning (zoomed)
- 2 ms binning (zoomed)
- SN=5 or 10 s binning (full-time range)
- Raw light curve
Spectra
- 64 ms binning (zoomed)
- 16 ms binning (zoomed)
- 8 ms binning (zoomed)
- 2 ms binning (zoomed)
- SN=5 or 10 s binning (full-time range)
- Raw light curve
Spectra
Notes:
- 1) The fitting includes the systematic errors.
- 2) When the burst includes telescope slew time periods, the fitting uses an average response file made from multiple 5-s response files through out the slew time plus single time preiod for the non-slew times, and weighted by the total counts in the corresponding time period using addrmf. An average response file is needed becuase a spectral fit using the pre-slew DRM will introduce some errors in both a spectral shape and a normalization if the PHA file contains a lot of the slew/post-slew time interval.
- 3) For fits to more complicated models (e.g. a power-law over a cutoff power-law), the BAT team has decided to require a chi-square improvement of more than 6 for each extra dof.
Time averaged spectrum fit using the average DRM
Power-law model
Time interval is from   -0.008 sec. to    0.076 sec.

Spectral model in power-law:
------------------------------------------------------------
Parameters  : value       lower 90%   higher 90%
Photon index: -1.05436     ( -0.354751   0.367366 )
Norm@50keV  : 1.84166E-02    ( -0.0037333   0.00372633 )
------------------------------------------------------------
#Fit statistic : Chi-Squared =          61.41 using 59 PHA bins.
# Reduced chi-squared =          1.077 for     57 degrees of freedom
# Null hypothesis probability =   3.209532e-01

Photon flux (15-150 keV)    in 0.084 sec: 2.12775 ( -0.4389  0.43974 ) ph/cm2/s
Energy fluence (15-150 keV)             : 1.64195e-08 ( -3.68857e-09  3.71541e-09 ) ergs/cm2
Cutoff power-law model
Time interval is from   -0.008 sec. to    0.076 sec.
Spectral model in the cutoff power-law:
------------------------------------------------------------
Parameters  : value       lower 90%   higher 90%
Photon index: -2.28971     ( -1.77015   2.50374 )
Epeak [keV] : 96.6595      (   )
Norm@50keV  : 3.10627E-03    (     )
------------------------------------------------------------
#Fit statistic : Chi-Squared =          61.15 using 59 PHA bins.
# Reduced chi-squared =          1.092 for     56 degrees of freedom
# Null hypothesis probability =   2.964496e-01

Photon flux (15-150 keV)    in 0.084 sec: 2.12746 ( -0.43887  0.43949 ) ph/cm2/s
Energy fluence (15-150 keV)             : 1.65097e-08 ( -4.53128e-09  3.83631e-09 ) ergs/cm2
1-s peak spectrum fit
Power-law model

Time interval is from   -0.464 sec. to    0.536 sec.

Spectral model in power-law:
------------------------------------------------------------
Parameters  : value       lower 90%   higher 90%
Photon index: -1.31085     ( -0.735362   0.783998 )
Norm@50keV  : 2.13700E-03    ( -0.000891004   0.00086821 )
------------------------------------------------------------
#Fit statistic : Chi-Squared =          45.75 using 59 PHA bins.
# Reduced chi-squared =         0.8027 for     57 degrees of freedom
# Null hypothesis probability =   8.573305e-01

Photon flux (15-150 keV)    in 1 sec: 0.255468 ( -0.102525  0.102719 ) ph/cm2/s
Energy fluence (15-150 keV)             : 2.10644e-08 ( -9.55534e-09  1.01942e-08 ) ergs/cm2
Cutoff power-law model
Time interval is from   -0.464 sec. to    0.536 sec.
Spectral model in the cutoff power-law:
------------------------------------------------------------
Parameters  : value       lower 90%   higher 90%
Photon index: -1.31328     ( -0.719517   1.25279 )
Epeak [keV] : 9999.26      ( -9999.36 -9999.36 )
Norm@50keV  : 2.14137E-03    ( -0.00214371   -0.00214371 )
------------------------------------------------------------
#Fit statistic : Chi-Squared =          45.75 using 59 PHA bins.
# Reduced chi-squared =         0.8170 for     56 degrees of freedom
# Null hypothesis probability =   8.340984e-01

Photon flux (15-150 keV)    in 1 sec: 0.255501 ( -0.10529  0.102613 ) ph/cm2/s
Energy fluence (15-150 keV)             : 2.11072e-08 ( -1.35827e-08  8.25307e-09 ) ergs/cm2
Time-resolved spectra
Distribution
T90 vs. Hardness ratio plot
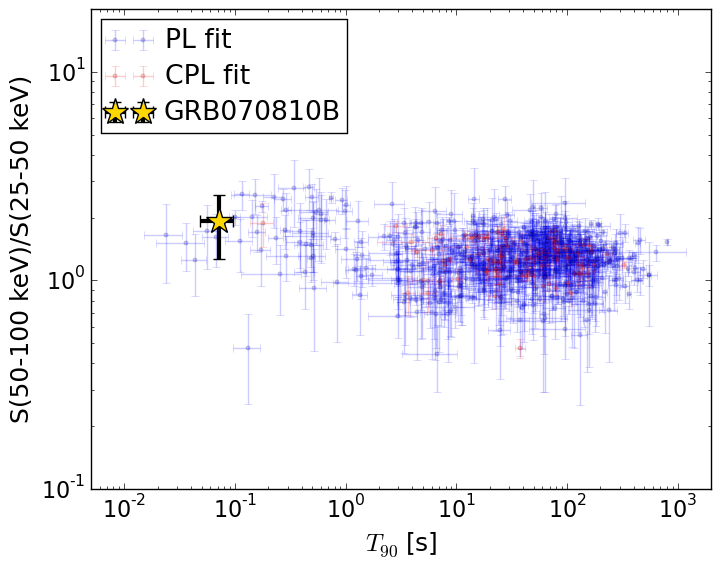
T90                                   = 0.072 sec.
Hardness ratio (energy fluence ratio) = 1.92606060183
S(15-50 keV) vs. S(50-150 keV) plot
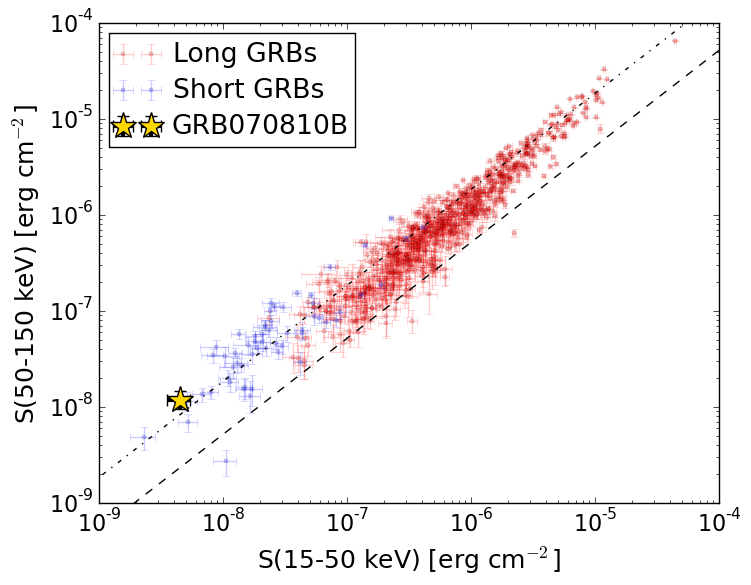
S(15-50 keV)  = 4.453903e-09
S(50-150 keV) = 1.196557e-08
The dash-dotted line and the dashed line traces the fluences calculated from the Band function with Epeak = 15 and 150 keV, respectively. Both lines assume a canonical values of alpha = -1 and beta = -2.5.
Mask shadow pattern
IMX = -1.224874329348857E-01, IMY = 6.677523658541844E-02
Spacecraft aspect plot
Bright source in the pre-burst/pre-slew/post-slew images
Pre-burst image of 15-350 keV band
Time interval of the image:
-150.935400 -0.008000

# RAcent  DECcent POSerr Theta    Phi  PeakCts   SNR AngSep     Name
#  [deg]    [deg]    ['] [deg]  [deg]                   [']
326.1046  38.2693    7.6  52.6  152.8   1.0381   1.5    4.5	Cyg X-2
 12.9394 -34.9975    2.5  36.6    4.4   0.7218   4.6 ------	UNKNOWN
Pre-slew background subtracted image of 15-350 keV band
Time interval of the image:
-0.008000 0.076000

# RAcent  DECcent POSerr Theta    Phi  PeakCts   SNR AngSep     Name
#  [deg]    [deg]    ['] [deg]  [deg]                   [']
326.0855  38.3659   30.2  52.6  152.9   0.0067   0.4    4.8	Cyg X-2
326.4224   4.7189    2.0  40.5  108.8   0.0736   5.8 ------	UNKNOWN
350.4683   5.2653    2.8  16.8  117.4   0.0135   4.2 ------	UNKNOWN
  8.9552   8.8188    1.4   7.9 -151.4   0.0251   8.3 ------	UNKNOWN
 23.5133  56.7793    2.4  57.2 -156.3   0.0770   4.9 ------	UNKNOWN
Post-slew image of 15-350 keV band
Time interval of the image:
43.864600 963.050900

# RAcent  DECcent POSerr Theta    Phi  PeakCts   SNR AngSep     Name
#  [deg]    [deg]    ['] [deg]  [deg]                   [']
326.2225  38.4458   11.0  48.4  161.2  -1.3817  -1.0    7.8	Cyg X-2
  7.9414 -24.7083    2.3  33.6   28.2   2.5848   5.1 ------	UNKNOWN
  4.6680  49.3312    2.7  40.7 -157.7   2.9564   4.3 ------	UNKNOWN
 36.2143  11.3789    3.0  26.9  -71.2   1.9269   3.9 ------	UNKNOWN
 41.9761  42.7199    2.7  44.5 -118.6   8.2210   4.2 ------	UNKNOWN