Analysis Summary
Notes:
- 1) No attempt has been made to eliminate the non-significant decimal places.
- 2) This batgrbproduct analysis is done using the HEASARC data.
- 3) This batgrbproduct analysis is using the flight position for the mask-weighting calculation.
======================================================================
                  BAT GRB EVENT DATA PROCESSING REPORT
    Process Script Ver: batgrbproduct v2.46
    Process Start Time: Mon Jan 20 07:30:42 EST 2014
             Host Name: batevent1
   Current Working Dir: /local/data/batevent/batevent_reproc/trigger290624
======================================================================

  Trigger: 00290624      Segment: 000

  BAT Trigger Time: 211183066.304   [s; MET]
      Trigger Stop: 211183067.328   [s; MET]
               UTC: 2007-09-11T05:57:44.087900    [includes UTCF correction]
       Where From?: TDRSS position message

  BAT
    RA: 25.7991691907814   Dec: -33.4728088428944  [deg; J2000]

     Catalogged Source?: NO
     Point Source?:      YES
     GRB Indicated?:     YES    [ by BAT flight software ]
     Image S/N Ratio:    10.5
     Image Trigger?:     NO
     Rate S/N Ratio:     17.4928556845359  [ if not an image trigger ]
     Image S/N Ratio:    10.5

  Analysis Position:   [ source = BAT ]
    RA: 25.7991691907814   Dec: -33.4728088428944  [deg; J2000]

  Refined Position:   [ source = BAT pre-slew burst ]
    RA: 25.8079287869266   Dec: -33.47960099546  [deg; J2000]
        { 01h 43m 13.9s , -33d 28' 46.6" }
         +/- 0.511717040489844 [arcmin] (estimated 90% radius based on SNR)
         +/- 0.134682943946186 [arcmin] (formal 1-sigma fit error)
    SNR: 79.2118179587907

  Angular difference between the analysis and refined position is 0.598554 arcmin

  Partial Coding Fraction: 0.8828125    [ including projection effects ]

  Duration
     T90: 161.724000006914 +/- 5.9724691640679
        Measured from: -31.311999976635
                   to: 130.412000030279     [s; relative to TRIGTIME]
     T50: 66.2120000123978 +/- 1.40253058074924
        Measured from: 21.3400000035763
                   to: 87.552000015974     [s; relative to TRIGTIME]


  Fluence
     Peak Flux  (peak 1 second)
        Measured from: 36.1280000209808
                   to: 37.1280000209808     [s; relative to TRIGTIME]
     Total Fluence
        Measured from: -72.2679999768734
                   to: 158.800000011921     [s; relative to TRIGTIME]

             Band 1     Band 2     Band 3     Band 4
              15-25      25-50     50-100    100-350     keV
 Total     6.801907   8.237469   5.395422   1.096555
           0.084948   0.089661   0.078911   0.067938 [error]
 Peak      0.107748   0.182408   0.158121   0.045885
           0.006150   0.007129   0.006862   0.005091 [error]

     [ fluence units of on-axis counts / fully illuminated detector ]

======================================================================


====== Table of the duration information =============================

        Value   tstart    tstop
T100  231.068  -72.268  158.800
T90   161.724  -31.312  130.412
T50    66.212   21.340   87.552
Peak    1.000   36.128   37.128


====== Spectral Analysis Summary =====================================

Model      : spectral model: simple power-law (PL) and cutoff power-law (CPL)
Ph_index   : photon index: E^{Ph_index}
Ph_90err   : 90% error of the photon index
Epeak      : Epeak in keV
Epeak_90err: 90% error of Epeak
Norm       : normalization at 50 keV in both the PL model and CPL model
Nomr_90err : 90% error of the normalization
chi2       : Chi-Squared
dof        : degree of freedo

=== Time-averaged spectral analysis ===
(Best model with acceptable fit: PL)

Model Ph_index Ph_90err_low Ph_90err_hi  Epeak  Epeak_90err_low  Epeak_90err_hi  Norm       Nomr_90err_low    Norm_90err_hi    chi2    dof
PL      -1.708    -0.037      0.037       -           -               -         5.94e-03     -1.06e-04          1.06e-04      35.650   57
CPL     -1.673    -0.051      0.131      481.655    -323.688      -481.655      6.15e-03     -3.04e-04          8.25e-04      35.760   56


=== 1-s peak spectral analysis ===
(Best model with acceptable fit: PL)

Model Ph_index Ph_90err_low Ph_90err_hi  Epeak  Epeak_90err_low  Epeak_90err_hi  Norm       Nomr_90err_low    Norm_90err_hi    chi2    dof
PL      -1.231     -0.077     0.077       -           -               -         3.33e-02     -1.46e-03          1.46e-03      53.310   57
CPL     -0.920     -0.291     0.313      186.053     -67.576      1277.987      4.69e-02     -1.24e-02          1.86e-02      49.970   56


=== Fluence/Peak Flux Summary ===

              Model    Band1     Band2     Band3     Band4     Band5     Total
                       15-25     25-50    50-100    100-350    15-150    15-350    keV
Fluence         PL   2.13e-06  3.45e-06  4.22e-06  1.02e-05  1.27e-05  2.00e-05   erg/cm2
      90%_error_low -8.27e-08 -7.54e-08 -9.35e-08 -5.29e-07 -2.29e-07 -5.64e-07   erg/cm2
      90%_error_hi   8.43e-08  7.51e-08  9.33e-08  5.49e-07  2.29e-07  5.77e-07   erg/cm2
Peak flux       PL   1.06e+00  1.25e+00  1.07e+00  1.54e+00  3.93e+00  4.92e+00   ph/cm2/s
      90%_error_low -8.73e-02 -6.35e-02 -5.57e-02 -1.64e-01 -1.76e-01 -2.29e-01   ph/cm2/s
      90%_error_hi   8.97e-02  6.31e-02  5.54e-02  1.76e-01  1.77e-01  2.31e-01   ph/cm2/s

Fluence        CPL   2.12e-06  3.45e-06  4.23e-06  9.95e-06  1.27e-05  1.97e-05   erg/cm2
      90%_error_low -1.15e-07 -7.14e-08 -5.12e-08 -1.68e-06 -2.67e-07 -1.72e-06   erg/cm2
      90%_error_hi   4.63e-08  7.70e-08  1.03e-07  3.48e-07  2.42e-07  7.61e-07   erg/cm2
Peak flux      CPL   9.91e-01  1.28e+00  1.10e+00  1.10e+00  3.88e+00  4.47e+00   ph/cm2/s
      90%_error_low -1.07e-01 -7.03e-02 -6.46e-02 -2.92e-01 -1.83e-01 -3.68e-01   ph/cm2/s
      90%_error_hi   1.09e-01  7.11e-02  6.55e-02  4.20e-01  1.83e-01  4.47e-01   ph/cm2/s

======================================================================
Image
Pre-slew 15.0-350.0 keV image (Event data)
#   RAcent    DECcent   POSerr    Theta     Phi              Peak Cts       SNR   Name
   25.8079   -33.4796   0.0024    21.2473   156.5654        14.4271489     79.212 TRIG_00290624

Foreground time interval of the image:
-72.268  74.797 (delta_t = 147.065 [sec])
Background time interval of the image:
-299.304 -72.268 (delta_t = 227.036 [sec])
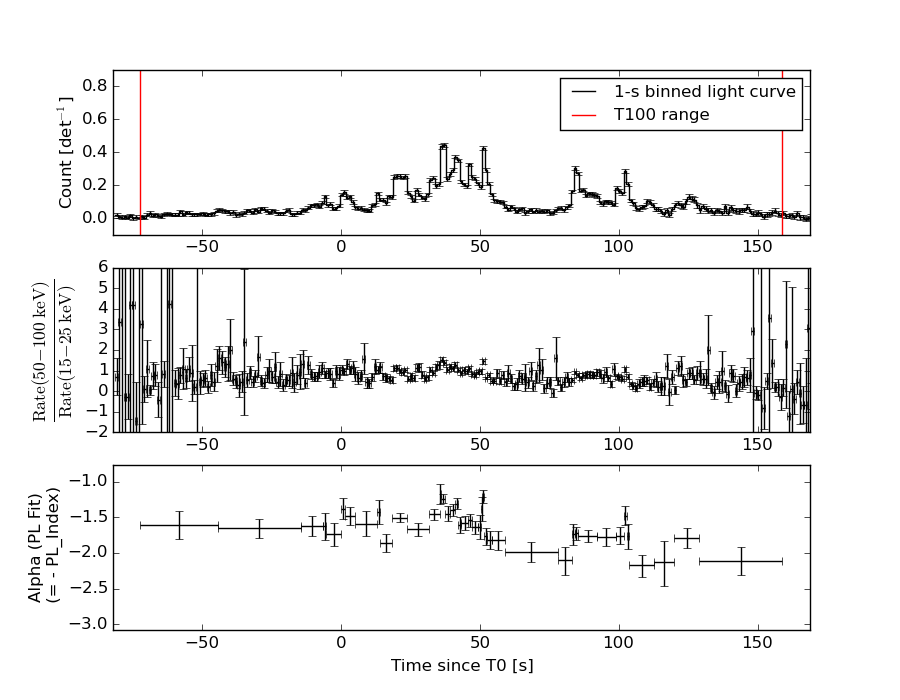
Light Curves
Note: The mask-weighted lightcurves have units of either count/det or counts/sec/det, where a det is 0.4 x 0.4 = 0.16 sq cm.
Full-time range; 1 s binning
Other quick-look light curves:
- 64 ms binning (zoomed)
- 16 ms binning (zoomed)
- 8 ms binning (zoomed)
- 2 ms binning (zoomed)
- SN=5 or 10 s binning (full-time range)
- Raw light curve
Spectra
- 64 ms binning (zoomed)
- 16 ms binning (zoomed)
- 8 ms binning (zoomed)
- 2 ms binning (zoomed)
- SN=5 or 10 s binning (full-time range)
- Raw light curve
Spectra
Notes:
- 1) The fitting includes the systematic errors.
- 2) When the burst includes telescope slew time periods, the fitting uses an average response file made from multiple 5-s response files through out the slew time plus single time preiod for the non-slew times, and weighted by the total counts in the corresponding time period using addrmf. An average response file is needed becuase a spectral fit using the pre-slew DRM will introduce some errors in both a spectral shape and a normalization if the PHA file contains a lot of the slew/post-slew time interval.
- 3) For fits to more complicated models (e.g. a power-law over a cutoff power-law), the BAT team has decided to require a chi-square improvement of more than 6 for each extra dof.
Time averaged spectrum fit using the average DRM
Power-law model

Time interval is from  -72.268 sec. to  158.800 sec.

Spectral model in power-law:
------------------------------------------------------------
Parameters  : value       lower 90%   higher 90%
Photon index: -1.70796     ( -0.0368769   0.0368563 )
Norm@50keV  : 5.93524E-03    ( -0.00010611   0.00010611 )
------------------------------------------------------------
#Fit statistic : Chi-Squared =          35.65 using 59 PHA bins.
# Reduced chi-squared =         0.6255 for     57 degrees of freedom
# Null hypothesis probability =   9.880496e-01

Photon flux (15-150 keV)    in 231.1 sec: 0.790505 ( -0.017501  0.017599 ) ph/cm2/s
Energy fluence (15-150 keV)             : 1.26937e-05 ( -2.29386e-07  2.29451e-07 ) ergs/cm2
Cutoff power-law model
Time interval is from  -72.268 sec. to  158.800 sec.
Spectral model in the cutoff power-law:
------------------------------------------------------------
Parameters  : value       lower 90%   higher 90%
Photon index: -1.67289     ( -0.0360784   0.146082 )
Epeak [keV] : 481.655      ( -826.844 -984.811 )
Norm@50keV  : 6.15299E-03    ( -0.000193786   0.000934854 )
------------------------------------------------------------
#Fit statistic : Chi-Squared =          35.76 using 59 PHA bins.
# Reduced chi-squared =         0.6385 for     56 degrees of freedom
# Null hypothesis probability =   9.839685e-01

Photon flux (15-150 keV)    in 231.1 sec: 0.789257 ( -0.020674  0.01861 ) ph/cm2/s
Energy fluence (15-150 keV)             : 1.26765e-05 ( -2.67438e-07  2.4161e-07 ) ergs/cm2
1-s peak spectrum fit
Power-law model
Time interval is from   36.128 sec. to   37.128 sec.

Spectral model in power-law:
------------------------------------------------------------
Parameters  : value       lower 90%   higher 90%
Photon index: -1.23136     ( -0.0768848   0.0770091 )
Norm@50keV  : 3.33099E-02    ( -0.00146311   0.00146292 )
------------------------------------------------------------
#Fit statistic : Chi-Squared =          53.31 using 59 PHA bins.
# Reduced chi-squared =         0.9352 for     57 degrees of freedom
# Null hypothesis probability =   6.143438e-01

Photon flux (15-150 keV)    in 1 sec: 3.92806 ( -0.17636  0.1765 ) ph/cm2/s
Energy fluence (15-150 keV)             : 3.35066e-07 ( -1.65583e-08  1.6624e-08 ) ergs/cm2
Cutoff power-law model
Time interval is from   36.128 sec. to   37.128 sec.
Spectral model in the cutoff power-law:
------------------------------------------------------------
Parameters  : value       lower 90%   higher 90%
Photon index: -0.920093     ( -0.291372   0.313275 )
Epeak [keV] : 186.053      ( -67.577 1277.98 )
Norm@50keV  : 4.68849E-02    ( -0.012407   0.0186132 )
------------------------------------------------------------
#Fit statistic : Chi-Squared =          49.97 using 59 PHA bins.
# Reduced chi-squared =         0.8923 for     56 degrees of freedom
# Null hypothesis probability =   7.012455e-01

Photon flux (15-150 keV)    in 1 sec: 3.87515 ( -0.18307  0.18303 ) ph/cm2/s
Energy fluence (15-150 keV)             : 3.28405e-07 ( -1.79562e-08  1.78611e-08 ) ergs/cm2
Time-resolved spectra
Distribution
T90 vs. Hardness ratio plot
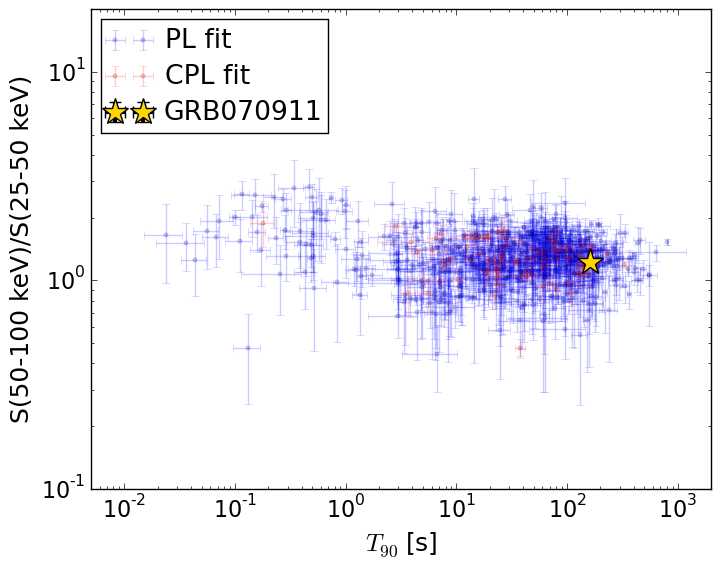
T90                                   = 161.724 sec.
Hardness ratio (energy fluence ratio) = 1.22439039955
S(15-50 keV) vs. S(50-150 keV) plot
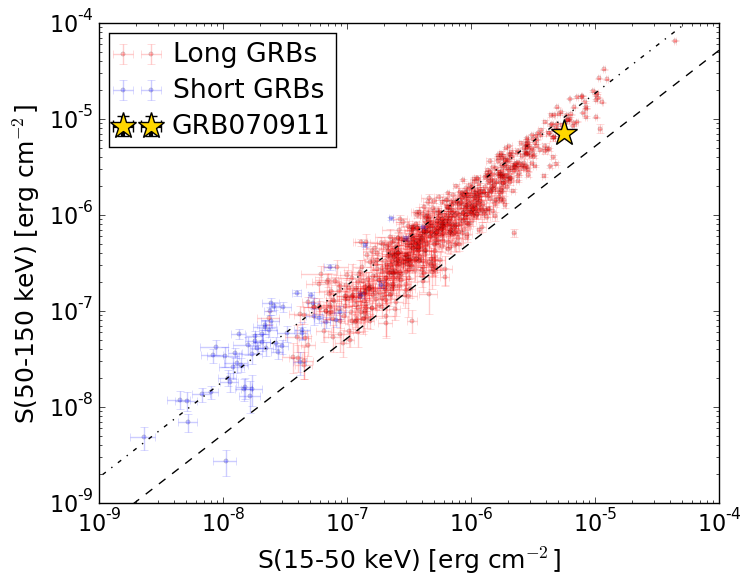
S(15-50 keV)  = 5.577154e-06
S(50-150 keV) = 7.116616e-06
The dash-dotted line and the dashed line traces the fluences calculated from the Band function with Epeak = 15 and 150 keV, respectively. Both lines assume a canonical values of alpha = -1 and beta = -2.5.
Mask shadow pattern
IMX = -3.567525846678423E-01, IMY = -1.546368169387835E-01
Spacecraft aspect plot
Bright source in the pre-burst/pre-slew/post-slew images
Pre-burst image of 15-350 keV band
Time interval of the image:
-299.304000 -72.268000

# RAcent  DECcent POSerr Theta    Phi  PeakCts   SNR AngSep     Name
#  [deg]    [deg]    ['] [deg]  [deg]                   [']
243.4304 -72.6155    3.1  50.7  -44.5   3.1459   3.8 ------	UNKNOWN
 91.5938 -67.3851    4.0  41.0  -98.1   2.3104   2.9 ------	UNKNOWN
 84.5598 -43.9766    3.3  48.7 -130.2   2.5682   3.6 ------	UNKNOWN
Pre-slew background subtracted image of 15-350 keV band
Time interval of the image:
-72.268000 74.796590

# RAcent  DECcent POSerr Theta    Phi  PeakCts   SNR AngSep     Name
#  [deg]    [deg]    ['] [deg]  [deg]                   [']
328.7869 -27.7587    2.2  38.7   48.9   2.0922   5.2 ------	UNKNOWN
295.0636 -34.3386    2.6  54.9   14.4   4.2761   4.4 ------	UNKNOWN
 25.8079 -33.4796    0.1  21.2  156.6  14.4098  79.1 ------	UNKNOWN
 43.3539 -62.6310    2.4  21.1 -107.4   0.9262   4.8 ------	UNKNOWN
254.6895 -63.8640    3.6  54.3  -33.3   2.8475   3.2 ------	UNKNOWN
 85.6606 -49.4397    2.5  46.2 -123.6   3.5307   4.6 ------	UNKNOWN
Post-slew image of 15-350 keV band
Time interval of the image:
125.996590 302.776000

# RAcent  DECcent POSerr Theta    Phi  PeakCts   SNR AngSep     Name
#  [deg]    [deg]    ['] [deg]  [deg]                   [']
 25.8048 -33.4748    1.1  29.6  107.1   2.3601  10.8 ------	UNKNOWN
 61.8269 -41.6068    2.5  14.2 -176.3   0.5486   4.6 ------	UNKNOWN
105.9006 -27.0453    3.0  46.1 -123.8   2.3606   3.9 ------	UNKNOWN