Analysis Summary
Notes:
- 1) No attempt has been made to eliminate the non-significant decimal places.
- 2) This batgrbproduct analysis is done using the HEASARC data.
- 3) This batgrbproduct analysis is using the flight position for the mask-weighting calculation.
======================================================================
                  BAT GRB EVENT DATA PROCESSING REPORT
    Process Script Ver: batgrbproduct v2.46
    Process Start Time: Mon Jan 20 07:26:05 EST 2014
             Host Name: batevent1
   Current Working Dir: /local/data/batevent/batevent_reproc/trigger290843
======================================================================

  Trigger: 00290843      Segment: 000

  BAT Trigger Time: 211336606.208   [s; MET]
      Trigger Stop: 211336607.232   [s; MET]
               UTC: 2007-09-13T00:36:43.987920    [includes UTCF correction]
       Where From?: TDRSS position message

  BAT
    RA: 228.831779421729   Dec: -24.3419572889613  [deg; J2000]

     Catalogged Source?: NO
     Point Source?:      YES
     GRB Indicated?:     YES    [ by BAT flight software ]
     Image S/N Ratio:    9.63
     Image Trigger?:     NO
     Rate S/N Ratio:     14.422205101856  [ if not an image trigger ]
     Image S/N Ratio:    9.63

  Analysis Position:   [ source = BAT ]
    RA: 228.831779421729   Dec: -24.3419572889613  [deg; J2000]

  Refined Position:   [ source = BAT pre-slew burst ]
    RA: 228.735789482905   Dec: -24.2788796947602  [deg; J2000]
        { 15h 14m 56.6s , -24d 16' 44.0" }
         +/- 1.76794997358706 [arcmin] (estimated 90% radius based on SNR)
         +/- 0.835902820981109 [arcmin] (formal 1-sigma fit error)
    SNR: 13.4768951213991

  Angular difference between the analysis and refined position is 6.470895 arcmin

  Partial Coding Fraction: 0.515625    [ including projection effects ]

  Duration
     T90: 2.68399998545647 +/- 0.563560121493796
        Measured from: -1.49599999189377
                   to: 1.1879999935627     [s; relative to TRIGTIME]
     T50: 1.2320000231266 +/- 0.597836080778623
        Measured from: -0.636000007390976
                   to: 0.596000015735626     [s; relative to TRIGTIME]


  Fluence
     Peak Flux  (peak 1 second)
        Measured from: -0.259999990463257
                   to: 0.740000009536743     [s; relative to TRIGTIME]
     Total Fluence
        Measured from: -1.58399999141693
                   to: 1.29199999570847     [s; relative to TRIGTIME]

             Band 1     Band 2     Band 3     Band 4
              15-25      25-50     50-100    100-350     keV
 Total     0.058998   0.104919   0.072394   0.004227
           0.012905   0.013842   0.012120   0.010087 [error]
 Peak      0.018164   0.045856   0.029994   0.011696
           0.007682   0.008285   0.007253   0.005851 [error]

     [ fluence units of on-axis counts / fully illuminated detector ]

======================================================================


====== Table of the duration information =============================

        Value   tstart    tstop
T100    2.876   -1.584    1.292
T90     2.684   -1.496    1.188
T50     1.232   -0.636    0.596
Peak    1.000   -0.260    0.740


====== Spectral Analysis Summary =====================================

Model      : spectral model: simple power-law (PL) and cutoff power-law (CPL)
Ph_index   : photon index: E^{Ph_index}
Ph_90err   : 90% error of the photon index
Epeak      : Epeak in keV
Epeak_90err: 90% error of Epeak
Norm       : normalization at 50 keV in both the PL model and CPL model
Nomr_90err : 90% error of the normalization
chi2       : Chi-Squared
dof        : degree of freedo

=== Time-averaged spectral analysis ===
(Best model with acceptable fit: PL)

Model Ph_index Ph_90err_low Ph_90err_hi  Epeak  Epeak_90err_low  Epeak_90err_hi  Norm       Nomr_90err_low    Norm_90err_hi    chi2    dof
PL      -1.412    -0.239      0.241       -           -               -         6.11e-03     -9.46e-04          9.45e-04      67.490   57
CPL      0.723    -1.402      2.144       62.314     -11.620        30.598      7.44e-02     -7.44e-02          8.19e-01      59.500   56


=== 1-s peak spectral analysis ===
(Best model with acceptable fit: PL)

Model Ph_index Ph_90err_low Ph_90err_hi  Epeak  Epeak_90err_low  Epeak_90err_hi  Norm       Nomr_90err_low    Norm_90err_hi    chi2    dof
PL      -1.264     -0.336     0.350       -           -               -         7.54e-03     -1.62e-03          1.62e-03      66.560   57
CPL      0.178     -1.545     2.809       78.556     -24.926       -78.556      3.80e-02     -3.80e-02          9.00e-01      64.180   56


=== Fluence/Peak Flux Summary ===

              Model    Band1     Band2     Band3     Band4     Band5     Total
                       15-25     25-50    50-100    100-350    15-150    15-350    keV
Fluence         PL   2.07e-08  4.01e-08  6.02e-08  1.96e-07  1.69e-07  3.17e-07   erg/cm2
      90%_error_low -5.16e-09 -6.71e-09 -1.11e-08 -6.55e-08 -2.79e-08 -7.62e-08   erg/cm2
      90%_error_hi   5.52e-09  6.65e-09  1.11e-08  8.40e-08  2.82e-08  9.07e-08   erg/cm2
Peak flux       PL   2.47e-01  2.87e-01  2.39e-01  3.35e-01  8.93e-01  1.11e+00   ph/cm2/s
      90%_error_low -9.21e-02 -7.35e-02 -5.64e-02 -1.35e-01 -2.01e-01 -2.39e-01   ph/cm2/s
      90%_error_hi   1.04e-01  7.21e-02  5.57e-02  1.81e-01  2.03e-01  2.41e-01   ph/cm2/s

Fluence        CPL   1.46e-08  4.90e-08  6.55e-08  2.38e-08  1.48e-07  1.53e-07   erg/cm2
      90%_error_low -6.12e-09 -9.21e-09 -1.53e-08 -1.85e-08 -2.98e-08 -3.40e-08   erg/cm2
      90%_error_hi   6.62e-09  9.85e-09  1.43e-08  5.55e-08  3.15e-08  5.82e-08   erg/cm2
Peak flux      CPL   1.85e-01  3.23e-01  2.72e-01  1.02e-01  8.55e-01  8.82e-01   ph/cm2/s
      90%_error_low -1.03e-01 -8.93e-02 -6.92e-02 -1.02e-01 -2.05e-01 -2.26e-01   ph/cm2/s
      90%_error_hi   1.22e-01  9.75e-02  7.21e-02  2.87e-01  2.07e-01  3.11e-01   ph/cm2/s

======================================================================
Image
Pre-slew 15.0-350.0 keV image (Event data)
#   RAcent    DECcent   POSerr    Theta     Phi              Peak Cts       SNR   Name
  228.7358   -24.2789   0.0142    41.8157    -8.4833         0.3389504     13.477 TRIG_00290843

Foreground time interval of the image:
 -1.584   1.292 (delta_t =   2.876 [sec])
Background time interval of the image:
-239.208  -1.584 (delta_t = 237.624 [sec])
Light Curves
Note: The mask-weighted lightcurves have units of either count/det or counts/sec/det, where a det is 0.4 x 0.4 = 0.16 sq cm.
Full-time range; 1 s binning
Other quick-look light curves:
- 64 ms binning (zoomed)
- 16 ms binning (zoomed)
- 8 ms binning (zoomed)
- 2 ms binning (zoomed)
- SN=5 or 10 s binning (full-time range)
- Raw light curve
Spectra
- 64 ms binning (zoomed)
- 16 ms binning (zoomed)
- 8 ms binning (zoomed)
- 2 ms binning (zoomed)
- SN=5 or 10 s binning (full-time range)
- Raw light curve
Spectra
Notes:
- 1) The fitting includes the systematic errors.
- 2) When the burst includes telescope slew time periods, the fitting uses an average response file made from multiple 5-s response files through out the slew time plus single time preiod for the non-slew times, and weighted by the total counts in the corresponding time period using addrmf. An average response file is needed becuase a spectral fit using the pre-slew DRM will introduce some errors in both a spectral shape and a normalization if the PHA file contains a lot of the slew/post-slew time interval.
- 3) For fits to more complicated models (e.g. a power-law over a cutoff power-law), the BAT team has decided to require a chi-square improvement of more than 6 for each extra dof.
Time averaged spectrum fit using the average DRM
Power-law model
Time interval is from   -1.584 sec. to    1.292 sec.

Spectral model in power-law:
------------------------------------------------------------
Parameters  : value       lower 90%   higher 90%
Photon index: -1.41195     ( -0.239301   0.240885 )
Norm@50keV  : 6.11105E-03    ( -0.0009461   0.000945247 )
------------------------------------------------------------
#Fit statistic : Chi-Squared =          67.49 using 59 PHA bins.
# Reduced chi-squared =          1.184 for     57 degrees of freedom
# Null hypothesis probability =   1.612000e-01

Photon flux (15-150 keV)    in 2.876 sec: 0.746287 ( -0.118869  0.119357 ) ph/cm2/s
Energy fluence (15-150 keV)             : 1.69429e-07 ( -2.79417e-08  2.81805e-08 ) ergs/cm2
Cutoff power-law model
Time interval is from   -1.584 sec. to    1.292 sec.
Spectral model in the cutoff power-law:
------------------------------------------------------------
Parameters  : value       lower 90%   higher 90%
Photon index: 0.723383     ( -1.40284   2.14267 )
Epeak [keV] : 62.3144      ( -11.6074 30.6097 )
Norm@50keV  : 7.43540E-02    ( -0.0744818   0.819121 )
------------------------------------------------------------
#Fit statistic : Chi-Squared =          59.50 using 59 PHA bins.
# Reduced chi-squared =          1.062 for     56 degrees of freedom
# Null hypothesis probability =   3.494976e-01

Photon flux (15-150 keV)    in 2.876 sec: 0.695310 ( -0.123763  0.124259 ) ph/cm2/s
Energy fluence (15-150 keV)             : 1.48176e-07 ( -2.98017e-08  3.15158e-08 ) ergs/cm2
1-s peak spectrum fit
Power-law model
Time interval is from   -0.260 sec. to    0.740 sec.

Spectral model in power-law:
------------------------------------------------------------
Parameters  : value       lower 90%   higher 90%
Photon index: -1.26371     ( -0.336012   0.350505 )
Norm@50keV  : 7.53603E-03    ( -0.00161782   0.00161598 )
------------------------------------------------------------
#Fit statistic : Chi-Squared =          66.56 using 59 PHA bins.
# Reduced chi-squared =          1.168 for     57 degrees of freedom
# Null hypothesis probability =   1.809910e-01

Photon flux (15-150 keV)    in 1 sec: 0.893367 ( -0.20095  0.202653 ) ph/cm2/s
Energy fluence (15-150 keV)             : 7.51571e-08 ( -1.68395e-08  1.69472e-08 ) ergs/cm2
Cutoff power-law model
Time interval is from   -0.260 sec. to    0.740 sec.
Spectral model in the cutoff power-law:
------------------------------------------------------------
Parameters  : value       lower 90%   higher 90%
Photon index: 0.177896     ( -1.54554   2.80922 )
Epeak [keV] : 78.5563      ( -24.9241 -78.5543 )
Norm@50keV  : 3.80256E-02    ( -0.0380299   0.900446 )
------------------------------------------------------------
#Fit statistic : Chi-Squared =          64.18 using 59 PHA bins.
# Reduced chi-squared =          1.146 for     56 degrees of freedom
# Null hypothesis probability =   2.118110e-01

Photon flux (15-150 keV)    in 1 sec: 0.854905 ( -0.205291  0.207295 ) ph/cm2/s
Energy fluence (15-150 keV)             : 6.94832e-08 ( -1.90751e-08  1.86156e-08 ) ergs/cm2
Time-resolved spectra

Distribution
T90 vs. Hardness ratio plot
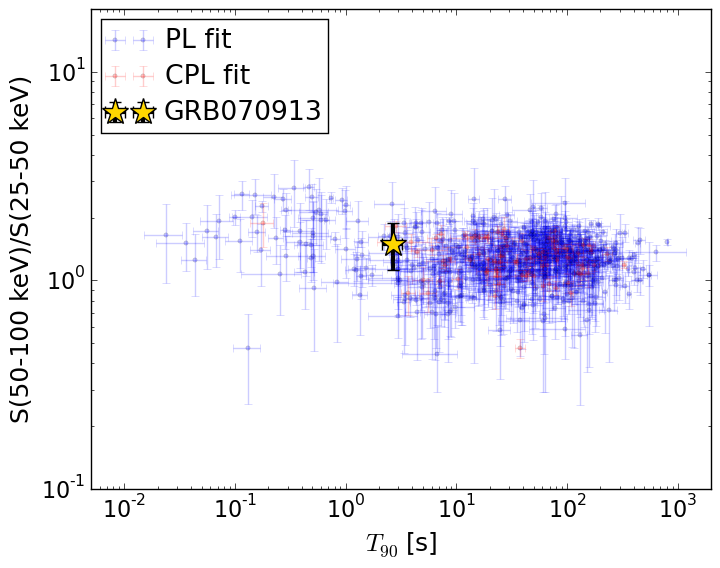
T90                                   = 2.684 sec.
Hardness ratio (energy fluence ratio) = 1.50310643937
S(15-50 keV) vs. S(50-150 keV) plot
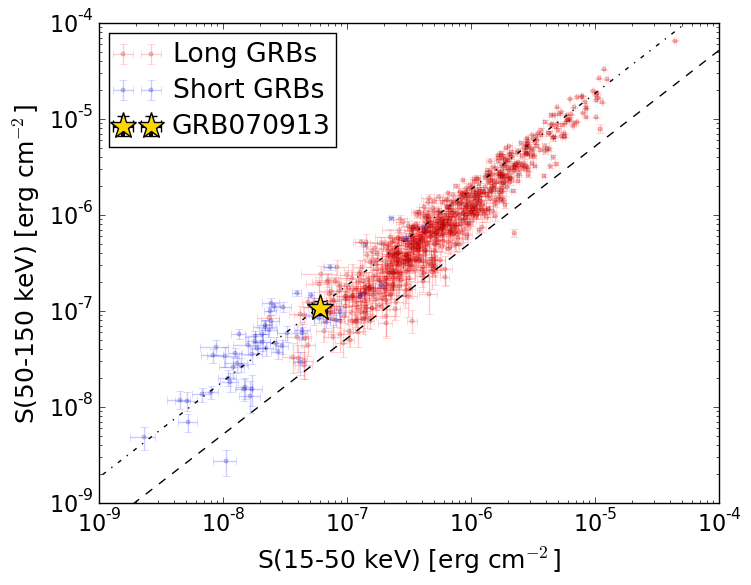
S(15-50 keV)  = 6.074445e-08
S(50-150 keV) = 1.0868749e-07
The dash-dotted line and the dashed line traces the fluences calculated from the Band function with Epeak = 15 and 150 keV, respectively. Both lines assume a canonical values of alpha = -1 and beta = -2.5.
Mask shadow pattern
IMX = 8.848086431628168E-01, IMY = 1.319718418351068E-01
Spacecraft aspect plot
Bright source in the pre-burst/pre-slew/post-slew images
Pre-burst image of 15-350 keV band
Time interval of the image:
-239.208000 -1.584000

# RAcent  DECcent POSerr Theta    Phi  PeakCts   SNR AngSep     Name
#  [deg]    [deg]    ['] [deg]  [deg]                   [']
135.5425 -40.5520    1.7  38.2 -158.4   1.7570   6.9    0.7	Vela X-1
170.4916 -60.6249    1.9  11.8  166.1   0.9002   6.1    5.2	Cen X-3
186.7073 -62.8005    1.4   8.0  123.7   1.3142   8.1    2.3	GX 301-2
256.0428 -37.8634    4.4  46.6   29.9   1.1979   2.6    2.9	4U 1700-377
256.3456 -36.5173    6.0  47.7   28.8   1.0049   1.9    7.1	GX 349+2
264.6514 -44.4767    5.6  47.0   42.6   1.4590   2.1    4.2	4U 1735-44
 99.9193 -56.8748    2.3  46.8  161.4   1.9470   4.9 ------	UNKNOWN
201.4098 -43.0386    1.9  14.0  -30.7   0.9440   6.0 ------	UNKNOWN
211.8868 -33.3116    2.0  26.5  -23.0   0.8877   5.7 ------	UNKNOWN
121.7310 -30.7616    3.0  53.1 -159.6   1.8556   3.9 ------	UNKNOWN
165.2422 -32.5457    2.2  28.4 -115.3   1.0707   5.2 ------	UNKNOWN
130.9138 -28.3742    2.9  49.6 -149.9   1.5359   3.9 ------	UNKNOWN
Pre-slew background subtracted image of 15-350 keV band
Time interval of the image:
-1.584000 1.292000

# RAcent  DECcent POSerr Theta    Phi  PeakCts   SNR AngSep     Name
#  [deg]    [deg]    ['] [deg]  [deg]                   [']
135.5175 -40.5586  299.6  38.2 -158.4   0.0009   0.0    0.6	Vela X-1
170.1903 -60.5755    4.0  11.9  166.6   0.0437   2.9    4.7	Cen X-3
186.8259 -62.8478    6.4   8.1  123.3   0.0282   1.8    6.6	GX 301-2
256.1076 -38.0418    0.0  46.5   30.1  -0.0382  -0.8   13.2	4U 1700-377
256.5248 -36.3911    8.0  47.9   28.8  -0.0787  -1.5    4.7	GX 349+2
264.5559 -44.3207   10.8  47.0   42.4  -0.0777  -1.1   11.2	4U 1735-44
235.4082 -41.0435    2.2  32.7   16.8   0.1075   5.3 ------	UNKNOWN
228.7356 -24.2788    0.9  41.8   -8.5   0.3389  13.5 ------	UNKNOWN
228.6402 -12.2886    2.1  52.2  -16.7   0.2208   5.5 ------	UNKNOWN
171.4490 -19.7385    2.0  37.9  -96.4   0.2515   5.7 ------	UNKNOWN
Post-slew image of 15-350 keV band
Time interval of the image:
243.292590 962.837900

# RAcent  DECcent POSerr Theta    Phi  PeakCts   SNR AngSep     Name
#  [deg]    [deg]    ['] [deg]  [deg]                   [']
170.0962 -60.6520    4.6  32.9 -149.3   1.4427   2.5    6.7	Cen X-3
186.7145 -62.7759    1.4  24.8 -149.9   4.0521   8.0    1.6	GX 301-2
244.9817 -15.6414    0.3  40.9   -8.2  25.1070  40.2    0.1	Sco X-1
255.9802 -37.8514    0.5  22.9   24.2   9.7718  23.2    0.5	4U 1700-377
256.4609 -36.4264    1.7  24.4   23.2   3.1084   6.9    1.2	GX 349+2
263.0292 -24.7404    2.3  37.3   22.0   3.2979   5.1    1.1	GX 1+4
264.5371 -44.3962    6.8  22.1   48.2   0.8861   1.7    9.4	4U 1735-44
270.1209 -24.9223    0.0  40.2   31.1   1.3469   1.7   12.9	GX 5-1
270.2215 -25.6089    7.3  39.7   31.8   1.2378   1.6    9.2	GRS 1758-258
274.0057 -14.0364   90.1  51.5   28.3   0.2656   0.1    0.0	GX 17+2
276.0717 -30.3714   11.5  38.6   42.8   0.8167   1.0    7.6	H1820-303
263.0619 -33.8794   16.4  29.4   30.3  -0.3482  -0.7    4.5	GX 354-0
276.5792 -37.1902    2.7  33.7   50.8   2.9437   4.3 ------	UNKNOWN
218.4388  -6.6699    3.8  50.7  -44.5   7.3366   3.1 ------	UNKNOWN
196.0402 -25.5216    2.9  41.0  -82.5   9.3092   3.9 ------	UNKNOWN