Analysis Summary
Notes:
- 1) No attempt has been made to eliminate the non-significant decimal places.
- 2) This batgrbproduct analysis is done using the HEASARC data.
- 3) This batgrbproduct analysis is using the flight position for the mask-weighting calculation.
======================================================================
                  BAT GRB EVENT DATA PROCESSING REPORT
    Process Script Ver: batgrbproduct v2.46
    Process Start Time: Mon Jan 20 07:21:12 EST 2014
             Host Name: batevent1
   Current Working Dir: /local/data/batevent/batevent_reproc/trigger291292
======================================================================

  Trigger: 00291292      Segment: 000

  BAT Trigger Time: 211707238.912   [s; MET]
      Trigger Stop: 211707239.936   [s; MET]
               UTC: 2007-09-17T07:33:56.682320    [includes UTCF correction]
       Where From?: TDRSS position message

  BAT
    RA: 293.925010039201   Dec: 2.41308727492074  [deg; J2000]

     Catalogged Source?: NO
     Point Source?:      YES
     GRB Indicated?:     YES    [ by BAT flight software ]
     Image S/N Ratio:    24.76
     Image Trigger?:     NO
     Rate S/N Ratio:     167.16758058906  [ if not an image trigger ]
     Image S/N Ratio:    24.76

  Analysis Position:   [ source = BAT ]
    RA: 293.925010039201   Dec: 2.41308727492074  [deg; J2000]

  Refined Position:   [ source = BAT pre-slew burst ]
    RA: 293.920429597368   Dec: 2.42436755961347  [deg; J2000]
        { 19h 35m 40.9s , +02d 25' 27.7" }
         +/- 0.608439337971967 [arcmin] (estimated 90% radius based on SNR)
         +/- 0.222478275194975 [arcmin] (formal 1-sigma fit error)
    SNR: 61.8556537423431

  Angular difference between the analysis and refined position is 0.730395 arcmin

  Partial Coding Fraction: 0.7734375    [ including projection effects ]

  Duration
     T90: 8.71999999880791 +/- 1.72291033212711
        Measured from: 0.212000012397766
                   to: 8.93200001120567     [s; relative to TRIGTIME]
     T50: 2.47200000286102 +/- 0.162086385406289
        Measured from: 0.796000003814697
                   to: 3.26800000667572     [s; relative to TRIGTIME]


  Fluence
     Peak Flux  (peak 1 second)
        Measured from: 0.212000012397766
                   to: 1.21200001239777     [s; relative to TRIGTIME]
     Total Fluence
        Measured from: -0.104000002145767
                   to: 15.1279999911785     [s; relative to TRIGTIME]

             Band 1     Band 2     Band 3     Band 4
              15-25      25-50     50-100    100-350     keV
 Total     0.917523   1.260095   0.945276   0.232299
           0.026622   0.026769   0.023308   0.018048 [error]
 Peak      0.236562   0.387197   0.340742   0.105800
           0.009086   0.010465   0.010214   0.007382 [error]

     [ fluence units of on-axis counts / fully illuminated detector ]

======================================================================


====== Table of the duration information =============================

        Value   tstart    tstop
T100   15.232   -0.104   15.128
T90     8.720    0.212    8.932
T50     2.472    0.796    3.268
Peak    1.000    0.212    1.212


====== Spectral Analysis Summary =====================================

Model      : spectral model: simple power-law (PL) and cutoff power-law (CPL)
Ph_index   : photon index: E^{Ph_index}
Ph_90err   : 90% error of the photon index
Epeak      : Epeak in keV
Epeak_90err: 90% error of Epeak
Norm       : normalization at 50 keV in both the PL model and CPL model
Nomr_90err : 90% error of the normalization
chi2       : Chi-Squared
dof        : degree of freedo

=== Time-averaged spectral analysis ===
(Best model with acceptable fit: PL)

Model Ph_index Ph_90err_low Ph_90err_hi  Epeak  Epeak_90err_low  Epeak_90err_hi  Norm       Nomr_90err_low    Norm_90err_hi    chi2    dof
PL      -1.496    -0.052      0.052       -           -               -         1.46e-02     -3.89e-04          3.89e-04      42.590   57
CPL     -1.408    -0.118      0.200      364.466    -364.466      -364.466      1.61e-02     -1.74e-03          3.67e-03      41.980   56


=== 1-s peak spectral analysis ===
(Best model with acceptable fit: N/A)

Model Ph_index Ph_90err_low Ph_90err_hi  Epeak  Epeak_90err_low  Epeak_90err_hi  Norm       Nomr_90err_low    Norm_90err_hi    chi2    dof
PL      -1.212     -0.058     0.058       -           -               -         7.29e-02     -2.29e-03          2.29e-03      36.350   57
CPL     -1.060     -0.175     0.226      349.093    -349.093      -349.093      8.54e-02     -1.42e-02          2.19e-02      34.910   56


=== Fluence/Peak Flux Summary ===

              Model    Band1     Band2     Band3     Band4     Band5     Total
                       15-25     25-50    50-100    100-350    15-150    15-350    keV
Fluence         PL   2.84e-07  5.22e-07  7.40e-07  2.21e-06  2.12e-06  3.76e-06   erg/cm2
      90%_error_low -1.53e-08 -1.62e-08 -2.46e-08 -1.66e-07 -5.95e-08 -1.79e-07   erg/cm2
      90%_error_hi   1.56e-08  1.61e-08  2.45e-08  1.75e-07  5.97e-08  1.86e-07   erg/cm2
Peak flux       PL   5.81e-04  6.90e-03  1.10e-01  9.60e+00  4.81e-01  9.64e+00   ph/cm2/s
      90%_error_low     N/A       N/A       N/A       N/A       N/A       N/A     ph/cm2/s
      90%_error_hi      N/A       N/A       N/A       N/A       N/A       N/A     ph/cm2/s

Fluence        CPL   2.73e-07  3.66e-07  3.77e-07  8.52e-07  1.24e-06  1.55e-06   erg/cm2
      90%_error_low -2.50e-08 -2.37e-08 -2.43e-08 -5.72e-08 -1.18e-07 1.28e-07   erg/cm2
      90%_error_hi   8.54e-09  7.70e-09  2.14e-08  4.98e-08  1.20e-07  3.95e-07   erg/cm2
Peak flux      CPL   2.19e+00  2.74e+00  2.39e+00  2.95e+00  8.50e+00  1.03e+01   ph/cm2/s
      90%_error_low -1.86e-01 -1.09e-01 -1.02e-01 -5.93e-01 -2.98e-01 -6.82e-01   ph/cm2/s
      90%_error_hi   9.54e-02  1.10e-01  1.03e-01  5.98e-01  2.98e-01  7.22e-01   ph/cm2/s

======================================================================
Image
Pre-slew 15.0-350.0 keV image (Event data)
#   RAcent    DECcent   POSerr    Theta     Phi              Peak Cts       SNR   Name
  293.9204     2.4244   0.0031    20.3668    42.4564         3.4417314     61.856 TRIG_00291292

Foreground time interval of the image:
 -0.104  15.128 (delta_t =  15.232 [sec])
Background time interval of the image:
-239.912  -0.104 (delta_t = 239.808 [sec])
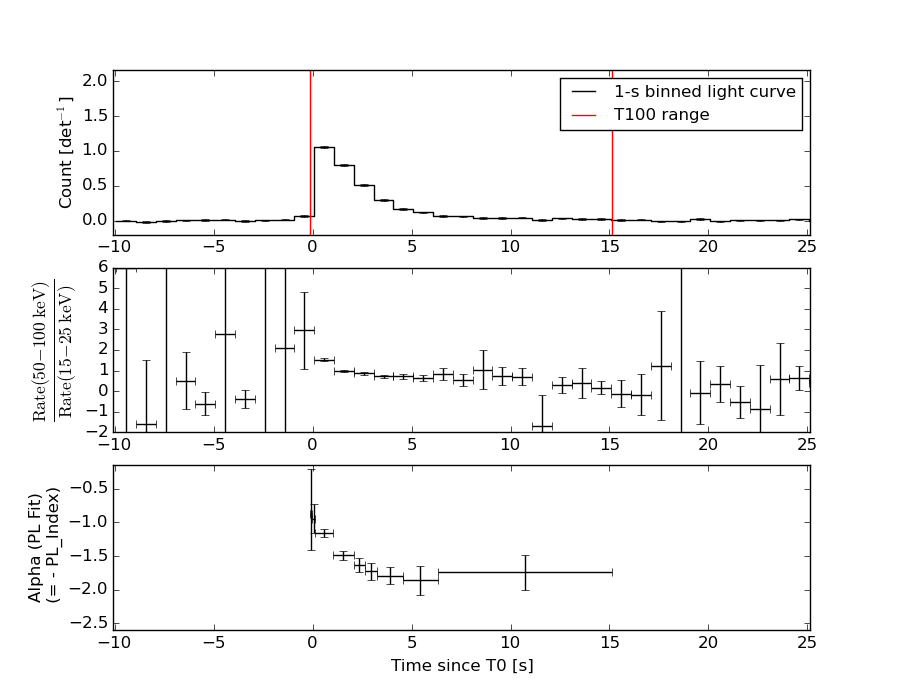
Light Curves
Note: The mask-weighted lightcurves have units of either count/det or counts/sec/det, where a det is 0.4 x 0.4 = 0.16 sq cm.
Full-time range; 1 s binning
Other quick-look light curves:
- 64 ms binning (zoomed)
- 16 ms binning (zoomed)
- 8 ms binning (zoomed)
- 2 ms binning (zoomed)
- SN=5 or 10 s binning (full-time range)
- Raw light curve
Spectra
- 64 ms binning (zoomed)
- 16 ms binning (zoomed)
- 8 ms binning (zoomed)
- 2 ms binning (zoomed)
- SN=5 or 10 s binning (full-time range)
- Raw light curve
Spectra
Notes:
- 1) The fitting includes the systematic errors.
- 2) When the burst includes telescope slew time periods, the fitting uses an average response file made from multiple 5-s response files through out the slew time plus single time preiod for the non-slew times, and weighted by the total counts in the corresponding time period using addrmf. An average response file is needed becuase a spectral fit using the pre-slew DRM will introduce some errors in both a spectral shape and a normalization if the PHA file contains a lot of the slew/post-slew time interval.
- 3) For fits to more complicated models (e.g. a power-law over a cutoff power-law), the BAT team has decided to require a chi-square improvement of more than 6 for each extra dof.
Time averaged spectrum fit using the average DRM
Power-law model
Time interval is from   -0.104 sec. to   15.128 sec.

Spectral model in power-law:
------------------------------------------------------------
Parameters  : value       lower 90%   higher 90%
Photon index: -1.4965     ( -0.0515692   0.0515707 )
Norm@50keV  : 1.46307E-02    ( -0.000388904   0.000388882 )
------------------------------------------------------------
#Fit statistic : Chi-Squared =          42.59 using 59 PHA bins.
# Reduced chi-squared =         0.7472 for     57 degrees of freedom
# Null hypothesis probability =   9.221532e-01

Photon flux (15-150 keV)    in 15.23 sec: 1.82481 ( -0.05379  0.05396 ) ph/cm2/s
Energy fluence (15-150 keV)             : 2.11529e-06 ( -5.95466e-08  5.96585e-08 ) ergs/cm2
Cutoff power-law model
Time interval is from   -0.104 sec. to   15.128 sec.
Spectral model in the cutoff power-law:
------------------------------------------------------------
Parameters  : value       lower 90%   higher 90%
Photon index: -1.40783     ( -0.11817   0.199856 )
Epeak [keV] : 364.466      ( -365.138 -365.138 )
Norm@50keV  : 1.60723E-02    ( -0.00173504   0.00367108 )
------------------------------------------------------------
#Fit statistic : Chi-Squared =          41.98 using 59 PHA bins.
# Reduced chi-squared =         0.7496 for     56 degrees of freedom
# Null hypothesis probability =   9.178127e-01

Photon flux (15-150 keV)    in 15.23 sec: 1.81241 ( -0.05972  0.05975 ) ph/cm2/s
Energy fluence (15-150 keV)             : 1.23891e-06 ( -1.18131e-07  1.19559e-07 ) ergs/cm2
1-s peak spectrum fit
Power-law model
Time interval is from    0.212 sec. to    1.212 sec.

Spectral model in power-law:
------------------------------------------------------------
Parameters  : value       lower 90%   higher 90%
Photon index: -1.21172     ( -0.0575026   0.0576053 )
Norm@50keV  : 7.28843E-02    ( -0.00229097   0.00229072 )
------------------------------------------------------------
#Fit statistic : Chi-Squared =          36.35 using 59 PHA bins.
# Reduced chi-squared =         0.6378 for     57 degrees of freedom
# Null hypothesis probability =   9.849736e-01

Photon flux (15-150 keV)    in 1 sec: 0.480664 (    ) ph/cm2/s
Energy fluence (15-150 keV)             : 7.37106e-07 ( -2.5483e-08  2.55347e-08 ) ergs/cm2
Cutoff power-law model
Time interval is from    0.212 sec. to    1.212 sec.
Spectral model in the cutoff power-law:
------------------------------------------------------------
Parameters  : value       lower 90%   higher 90%
Photon index: -1.05974     ( -0.175419   0.225824 )
Epeak [keV] : 349.093      ( -349.093 -349.093 )
Norm@50keV  : 8.53765E-02    ( -0.0142039   0.0218699 )
------------------------------------------------------------
#Fit statistic : Chi-Squared =          34.91 using 59 PHA bins.
# Reduced chi-squared =         0.6234 for     56 degrees of freedom
# Null hypothesis probability =   9.878706e-01

Photon flux (15-150 keV)    in 1 sec: 8.49948 ( -0.29757  0.29792 ) ph/cm2/s
Energy fluence (15-150 keV)             : 7.30903e-07 ( -2.71342e-08  2.70286e-08 ) ergs/cm2
Time-resolved spectra
Distribution
T90 vs. Hardness ratio plot
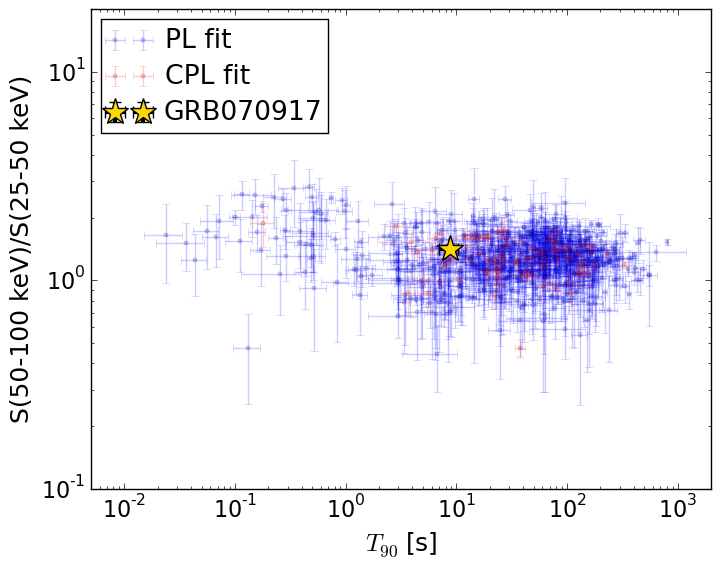
T90                                   = 8.72 sec.
Hardness ratio (energy fluence ratio) = 1.41768581023
S(15-50 keV) vs. S(50-150 keV) plot
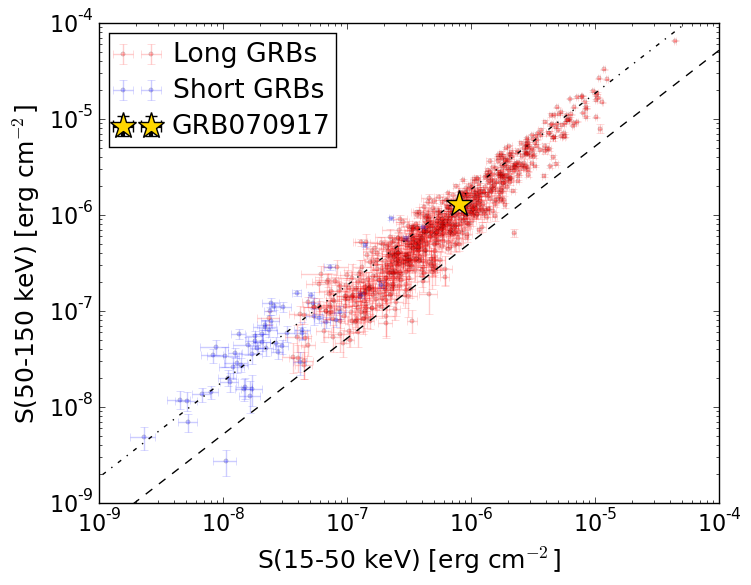
S(15-50 keV)  = 8.058236e-07
S(50-150 keV) = 1.3094958e-06
The dash-dotted line and the dashed line traces the fluences calculated from the Band function with Epeak = 15 and 150 keV, respectively. Both lines assume a canonical values of alpha = -1 and beta = -2.5.
Mask shadow pattern
IMX = 2.738953237306905E-01, IMY = -2.505954614291482E-01
Spacecraft aspect plot
Bright source in the pre-burst/pre-slew/post-slew images
Pre-burst image of 15-350 keV band
Time interval of the image:
-239.912000 -0.104000

# RAcent  DECcent POSerr Theta    Phi  PeakCts   SNR AngSep     Name
#  [deg]    [deg]    ['] [deg]  [deg]                   [']
244.9760 -15.6495    0.5  32.7 -110.9   7.6998  24.6    0.6	Sco X-1
254.6551  35.4912   62.0  51.2  -33.2   0.1159   0.2   13.2	Her X-1
256.0072 -37.8428    1.0  33.7 -155.9   2.4033  11.1    1.0	4U 1700-377
256.4486 -36.4410    2.8  32.4 -154.7   0.8425   4.1    1.3	GX 349+2
263.0045 -24.8036    2.6  20.2 -144.9   0.7889   4.4    3.5	GX 1+4
264.5595 -44.4722    3.4  35.8 -171.7   0.7496   3.4    8.0	4U 1735-44
268.3345  -1.4545    2.5  13.5  -56.0   0.8389   4.5    2.0	SW J1753.5-0127
270.2779 -25.1075    1.4  16.3 -162.0   1.4415   8.3    1.7	GX 5-1
270.3442 -25.9034   12.0  17.0 -163.5   0.1674   1.0    9.9	GRS 1758-258
274.0819 -14.2005    5.5   5.4 -140.2   0.3414   2.1   10.8	GX 17+2
276.0124 -30.3744    4.8  19.8  177.2   0.4017   2.4    4.5	H1820-303
285.2154 -24.7998    5.4  15.6  147.3   0.3522   2.1   12.2	HT1900.1-2455
288.8514  10.7853    6.7  23.9   18.1   0.3087   1.7   10.1	GRS 1915+105
299.5869  35.2120    0.7  50.1   14.3   8.5372  16.3    0.6	Cyg X-1
263.1465 -33.8722    4.7  27.0 -160.1   0.4636   2.4    8.2	GX 354-0
288.0696 -37.4631    3.3  28.2  154.9   0.7923   3.5 ------	UNKNOWN
277.3096 -23.6895    1.8  13.1  175.2   1.0868   6.3 ------	UNKNOWN
243.7931 -48.6519    2.9  47.6 -158.1   1.4540   4.1 ------	UNKNOWN
237.1303 -39.1962    2.3  46.3 -143.7   2.0476   4.9 ------	UNKNOWN
Pre-slew background subtracted image of 15-350 keV band
Time interval of the image:
-0.104000 15.128000

# RAcent  DECcent POSerr Theta    Phi  PeakCts   SNR AngSep     Name
#  [deg]    [deg]    ['] [deg]  [deg]                   [']
245.1036 -15.7757   12.9  32.6 -111.2  -0.0759  -0.9   10.8	Sco X-1
254.2952  35.2940    4.2  51.2  -33.6   0.4673   2.7    8.5	Her X-1
255.9607 -37.8100  177.8  33.7 -155.8  -0.0039  -0.1    2.4	4U 1700-377
256.2821 -36.3748    3.6  32.5 -154.4   0.1871   3.2    7.9	GX 349+2
263.1785 -24.7104    7.4  20.0 -145.0  -0.0809  -1.6    9.5	GX 1+4
264.6144 -44.3051    6.0  35.6 -171.7   0.1275   1.9   10.3	4U 1735-44
268.1985  -1.5532    7.9  13.5  -56.8   0.0698   1.5   11.8	SW J1753.5-0127
270.2132 -25.0614    6.1  16.3 -161.7  -0.0975  -1.9    4.0	GX 5-1
270.2594 -25.8877    4.1  17.0 -163.2   0.1458   2.8    9.0	GRS 1758-258
273.8926 -14.1697   25.1   5.5 -138.7   0.0214   0.5   10.4	GX 17+2
275.7922 -30.1965    0.0  19.7  177.8   0.0625   1.2   12.3	H1820-303
284.9902 -25.0654    5.2  15.8  148.4   0.1030   2.2    9.0	HT1900.1-2455
288.6725  11.0736    4.6  24.1   17.4   0.1413   2.5   10.7	GRS 1915+105
299.6170  35.2145    4.2  50.1   14.4   0.4775   2.8    1.5	Cyg X-1
263.1401 -33.8969   12.4  27.0 -160.1  -0.0522  -0.9    8.4	GX 354-0
293.9204   2.4244    0.2  20.4   42.5   3.4421  61.9 ------	UNKNOWN
239.3152   2.3216    2.6  40.8  -82.2   0.8418   4.5 ------	UNKNOWN
236.7680  -7.7678    2.9  41.0  -98.1   0.8166   4.0 ------	UNKNOWN
245.6721  27.6740    2.3  49.6  -47.2   1.0503   4.9 ------	UNKNOWN
Post-slew image of 15-350 keV band
Time interval of the image:
539.488580 962.187100

# RAcent  DECcent POSerr Theta    Phi  PeakCts   SNR AngSep     Name
#  [deg]    [deg]    ['] [deg]  [deg]                   [']
244.9811 -15.6470    0.6  41.0  -48.9  11.5038  19.7    0.4	Sco X-1
255.9859 -37.8232    0.6  22.2  -79.4   6.3206  20.4    1.3	4U 1700-377
256.5430 -36.5581    5.8  22.0  -75.9   0.6365   2.0    9.6	GX 349+2
262.9885 -24.7697    1.8  22.3  -40.8   1.6471   6.5    1.8	GX 1+4
264.5288 -44.4320    3.0  16.1 -100.9   0.9212   3.8    9.2	4U 1735-44
268.4046  -1.4178    2.7  39.3   -6.3   1.5670   4.3    3.0	SW J1753.5-0127
270.2812 -25.0868    1.5  17.4  -27.5   1.9183   7.6    0.5	GX 5-1
270.3951 -25.7267    3.8  16.9  -28.6   0.7848   3.2    5.1	GRS 1758-258
274.1028 -14.0275    3.2  25.5   -4.1   1.2650   3.6    5.7	GX 17+2
275.9611 -30.3305    2.5  10.2  -25.2   1.0886   4.6    2.9	H1820-303
285.0946 -25.0602    5.4  12.9   22.9   0.4794   2.1    9.0	HT1900.1-2455
288.8915  10.9651    4.1  49.1   25.3  -3.1178  -2.8    5.6	GRS 1915+105
262.8147 -33.7896    7.6  17.8  -63.9   0.3745   1.5    9.1	GX 354-0
332.2853 -55.7355    3.9  36.4  154.3   1.3300   3.0 ------	UNKNOWN
277.3305 -23.7920    1.7  15.3   -5.3   1.6422   6.8 ------	UNKNOWN
262.0704  13.6976    2.2  55.6   -7.1   4.4658   5.3 ------	UNKNOWN
251.9816   9.6302    3.0  56.3  -20.0   3.6817   3.9 ------	UNKNOWN
205.2942 -70.2636    2.7  51.0 -135.6   6.1264   4.3 ------	UNKNOWN