Analysis Summary
Notes:
- 1) No attempt has been made to eliminate the non-significant decimal places.
- 2) This batgrbproduct analysis is done using the HEASARC data.
- 3) This batgrbproduct analysis is using the flight position for the mask-weighting calculation.
======================================================================
BAT GRB EVENT DATA PROCESSING REPORT
Process Script Ver: batgrbproduct v2.46
Process Start Time: Mon Jan 20 07:16:23 EST 2014
Host Name: batevent1
Current Working Dir: /local/data/batevent/batevent_reproc/trigger291614
======================================================================
Trigger: 00291614 Segment: 000
BAT Trigger Time: 211953616 [s; MET]
Trigger Stop: 211953680 [s; MET]
UTC: 2007-09-20T04:00:13.763940 [includes UTCF correction]
Where From?: TDRSS position message
BAT
RA: 100.932293960004 Dec: 72.2273663433026 [deg; J2000]
Catalogged Source?: NO
Point Source?: YES
GRB Indicated?: YES [ by BAT flight software ]
Image S/N Ratio: 10.26
Image Trigger?: YES
Rate S/N Ratio: 0 [ if not an image trigger ]
Image S/N Ratio: 10.26
Analysis Position: [ source = BAT ]
RA: 100.932293960004 Dec: 72.2273663433026 [deg; J2000]
Refined Position: [ source = BAT pre-slew burst ]
RA: 100.971964315622 Dec: 72.242209888389 [deg; J2000]
{ 06h 43m 53.3s , +72d 14' 32.0" }
+/- 1.93229129482644 [arcmin] (estimated 90% radius based on SNR)
+/- 1.17504729485443 [arcmin] (formal 1-sigma fit error)
SNR: 11.8697956148075
Angular difference between the analysis and refined position is 1.149184 arcmin
Partial Coding Fraction: 1.015625 [ including projection effects ]
Duration
T90: 55.7600000202656 +/- 5.28902259694316
Measured from: 16.8799999952316
to: 72.6400000154972 [s; relative to TRIGTIME]
T50: 32.3160000145435 +/- 10.9756566778799
Measured from: 24.136000007391
to: 56.4520000219345 [s; relative to TRIGTIME]
Fluence
Peak Flux (peak 1 second)
Measured from: 30.4519999921322
to: 31.4519999921322 [s; relative to TRIGTIME]
Total Fluence
Measured from: 15.1800000071526
to: 74.8160000145435 [s; relative to TRIGTIME]
Band 1 Band 2 Band 3 Band 4
15-25 25-50 50-100 100-350 keV
Total 0.286194 0.357491 0.205800 0.036111
0.035464 0.036964 0.032266 0.027751 [error]
Peak 0.012542 0.019671 0.011123 0.004176
0.004671 0.004768 0.004208 0.003564 [error]
[ fluence units of on-axis counts / fully illuminated detector ]
======================================================================
====== Table of the duration information =============================
Value tstart tstop
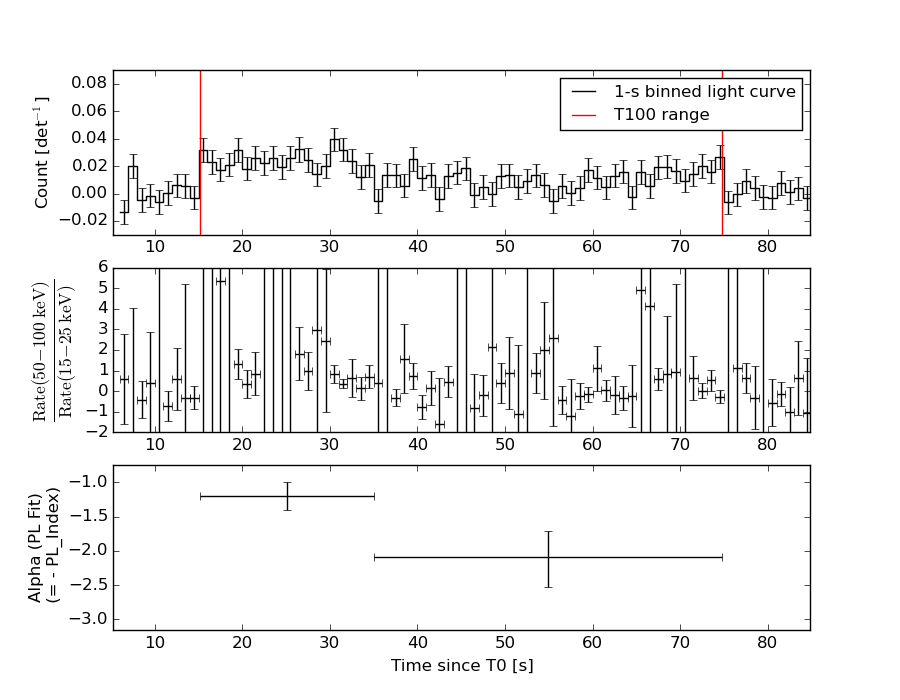
T100 59.636 15.180 74.816
T90 55.760 16.880 72.640
T50 32.316 24.136 56.452
Peak 1.000 30.452 31.452
====== Spectral Analysis Summary =====================================
Model : spectral model: simple power-law (PL) and cutoff power-law (CPL)
Ph_index : photon index: E^{Ph_index}
Ph_90err : 90% error of the photon index
Epeak : Epeak in keV
Epeak_90err: 90% error of Epeak
Norm : normalization at 50 keV in both the PL model and CPL model
Nomr_90err : 90% error of the normalization
chi2 : Chi-Squared
dof : degree of freedo
=== Time-averaged spectral analysis ===
(Best model with acceptable fit: PL)
Model Ph_index Ph_90err_low Ph_90err_hi Epeak Epeak_90err_low Epeak_90err_hi Norm Nomr_90err_low Norm_90err_hi chi2 dof
PL -1.604 -0.213 0.207 - - - 9.23e-04 -1.21e-04 1.19e-04 34.060 57
CPL -1.156 -0.430 0.957 85.928 -40.728 -85.928 1.62e-03 -7.94e-04 3.76e-03 33.120 56
=== 1-s peak spectral analysis ===
(Best model with acceptable fit: PL)
Model Ph_index Ph_90err_low Ph_90err_hi Epeak Epeak_90err_low Epeak_90err_hi Norm Nomr_90err_low Norm_90err_hi chi2 dof
PL -1.769 -0.587 0.511 - - - 2.52e-03 -9.57e-04 9.15e-04 55.010 57
CPL -0.530 N/A N/A 52.084 N/A N/A 1.25e-02 N/A N/A 53.860 56
=== Fluence/Peak Flux Summary ===
Model Band1 Band2 Band3 Band4 Band5 Total
15-25 25-50 50-100 100-350 15-150 15-350 keV
Fluence PL 7.75e-08 1.34e-07 1.76e-07 4.71e-07 5.15e-07 8.58e-07 erg/cm2
90%_error_low -1.40e-08 -1.59e-08 -3.08e-08 -1.50e-07 -7.26e-08 -1.82e-07 erg/cm2
90%_error_hi 1.45e-08 1.59e-08 3.09e-08 1.92e-07 7.40e-08 2.16e-07 erg/cm2
Peak flux PL 1.35e-01 1.15e-01 6.78e-02 5.95e-02 3.44e-01 3.77e-01 ph/cm2/s
90%_error_low -5.58e-02 -3.59e-02 -3.14e-02 -3.98e-02 -1.07e-01 -1.20e-01 ph/cm2/s
90%_error_hi 6.05e-02 3.59e-02 3.27e-02 6.92e-02 1.07e-01 1.23e-01 ph/cm2/s
Fluence CPL 7.36e-08 1.41e-07 1.77e-07 2.24e-07 4.92e-07 6.16e-07 erg/cm2
90%_error_low -1.59e-08 -2.04e-08 -3.36e-08 -1.59e-07 -8.27e-08 -1.83e-07 erg/cm2
90%_error_hi 1.60e-08 2.16e-08 3.32e-08 2.98e-07 8.39e-08 3.20e-07 erg/cm2
Peak flux CPL 1.17e-01 1.34e-01 6.96e-02 1.58e-02 3.33e-01 3.36e-01 ph/cm2/s
90%_error_low -6.48e-02 -4.56e-02 -6.96e-02 -1.58e-02 -1.06e-01 -1.08e-01 ph/cm2/s
90%_error_hi 6.72e-02 4.99e-02 3.90e-02 6.55e-02 1.07e-01 1.31e-01 ph/cm2/s
======================================================================
Image
Pre-slew 15.0-350.0 keV image (Event data)
#   RAcent    DECcent   POSerr    Theta     Phi              Peak Cts       SNR   Name
  100.9720    72.2422   0.0161    14.3977  -153.4907         0.8539508     11.870 TRIG_00291614

Foreground time interval of the image:
 15.180  74.816 (delta_t =  59.636 [sec])
Background time interval of the image:
-239.000  15.180 (delta_t = 254.180 [sec])
Light Curves
Note: The mask-weighted lightcurves have units of either count/det or counts/sec/det, where a det is 0.4 x 0.4 = 0.16 sq cm.
Full-time range; 1 s binning
Other quick-look light curves:
- 64 ms binning (zoomed)
- 16 ms binning (zoomed)
- 8 ms binning (zoomed)
- 2 ms binning (zoomed)
- SN=5 or 10 s binning (full-time range)
- Raw light curve
Spectra
- 64 ms binning (zoomed)
- 16 ms binning (zoomed)
- 8 ms binning (zoomed)
- 2 ms binning (zoomed)
- SN=5 or 10 s binning (full-time range)
- Raw light curve
Spectra
Notes:
- 1) The fitting includes the systematic errors.
- 2) When the burst includes telescope slew time periods, the fitting uses an average response file made from multiple 5-s response files through out the slew time plus single time preiod for the non-slew times, and weighted by the total counts in the corresponding time period using addrmf. An average response file is needed becuase a spectral fit using the pre-slew DRM will introduce some errors in both a spectral shape and a normalization if the PHA file contains a lot of the slew/post-slew time interval.
- 3) For fits to more complicated models (e.g. a power-law over a cutoff power-law), the BAT team has decided to require a chi-square improvement of more than 6 for each extra dof.
Time averaged spectrum fit using the average DRM
Power-law model
Time interval is from   15.180 sec. to   74.816 sec.

Spectral model in power-law:
------------------------------------------------------------
Parameters  : value       lower 90%   higher 90%
Photon index: -1.60367     ( -0.21286   0.207089 )
Norm@50keV  : 9.23291E-04    ( -0.000121303   0.000119317 )
------------------------------------------------------------
#Fit statistic : Chi-Squared =          34.06 using 59 PHA bins.
# Reduced chi-squared =         0.5975 for     57 degrees of freedom
# Null hypothesis probability =   9.931980e-01

Photon flux (15-150 keV)    in 59.64 sec: 0.118786 ( -0.014092  0.014096 ) ph/cm2/s
Energy fluence (15-150 keV)             : 5.14823e-07 ( -7.25628e-08  7.39769e-08 ) ergs/cm2
Cutoff power-law model
Time interval is from   15.180 sec. to   74.816 sec.
Spectral model in the cutoff power-law:
------------------------------------------------------------
Parameters  : value       lower 90%   higher 90%
Photon index: -1.15647     ( -0.429555   0.957303 )
Epeak [keV] : 85.9277      ( -40.728 -85.9277 )
Norm@50keV  : 1.62044E-03    ( -0.00079369   0.00376114 )
------------------------------------------------------------
#Fit statistic : Chi-Squared =          33.12 using 59 PHA bins.
# Reduced chi-squared =         0.5914 for     56 degrees of freedom
# Null hypothesis probability =   9.936149e-01

Photon flux (15-150 keV)    in 59.64 sec: 0.116697 ( -0.014592  0.01456 ) ph/cm2/s
Energy fluence (15-150 keV)             : 4.91686e-07 ( -8.27475e-08  8.39099e-08 ) ergs/cm2
1-s peak spectrum fit
Power-law model
Time interval is from   30.452 sec. to   31.452 sec.

Spectral model in power-law:
------------------------------------------------------------
Parameters  : value       lower 90%   higher 90%
Photon index: -1.76938     ( -0.587009   0.511168 )
Norm@50keV  : 2.52230E-03    ( -0.000957075   0.000914477 )
------------------------------------------------------------
#Fit statistic : Chi-Squared =          55.01 using 59 PHA bins.
# Reduced chi-squared =         0.9651 for     57 degrees of freedom
# Null hypothesis probability =   5.501029e-01

Photon flux (15-150 keV)    in 1 sec: 0.343544 ( -0.106793  0.106794 ) ph/cm2/s
Energy fluence (15-150 keV)             : 2.32557e-08 ( -8.58773e-09  9.15586e-09 ) ergs/cm2
Cutoff power-law model
Time interval is from   30.452 sec. to   31.452 sec.
Spectral model in the cutoff power-law:
------------------------------------------------------------
Parameters  : value       lower 90%   higher 90%
Photon index: -0.529809     (       )
Epeak [keV] : 52.0836      (   )
Norm@50keV  : 1.24797E-02    (     )
------------------------------------------------------------
#Fit statistic : Chi-Squared =          53.86 using 59 PHA bins.
# Reduced chi-squared =         0.9618 for     56 degrees of freedom
# Null hypothesis probability =   5.561859e-01

Photon flux (15-150 keV)    in 1 sec: 0.333302 ( -0.106131  0.107314 ) ph/cm2/s
Energy fluence (15-150 keV)             : 2.11958e-08 ( -8.20637e-09  9.5843e-09 ) ergs/cm2
Time-resolved spectra
Distribution
T90 vs. Hardness ratio plot
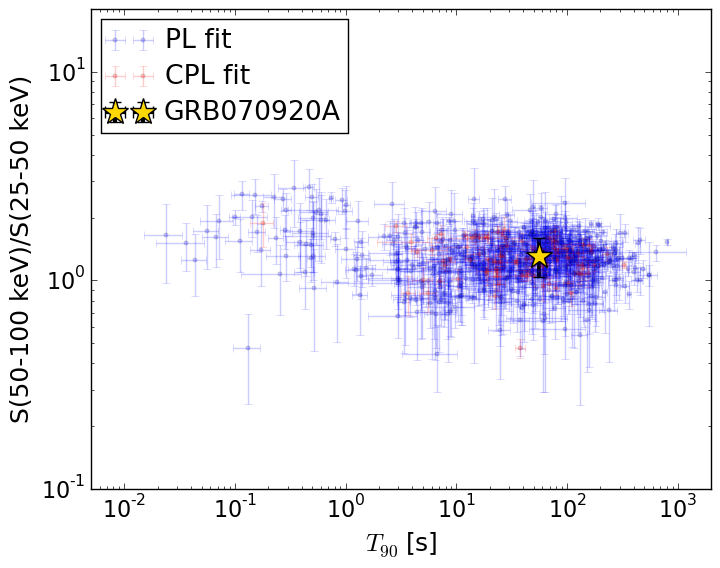
T90                                   = 55.76 sec.
Hardness ratio (energy fluence ratio) = 1.3161936978
S(15-50 keV) vs. S(50-150 keV) plot
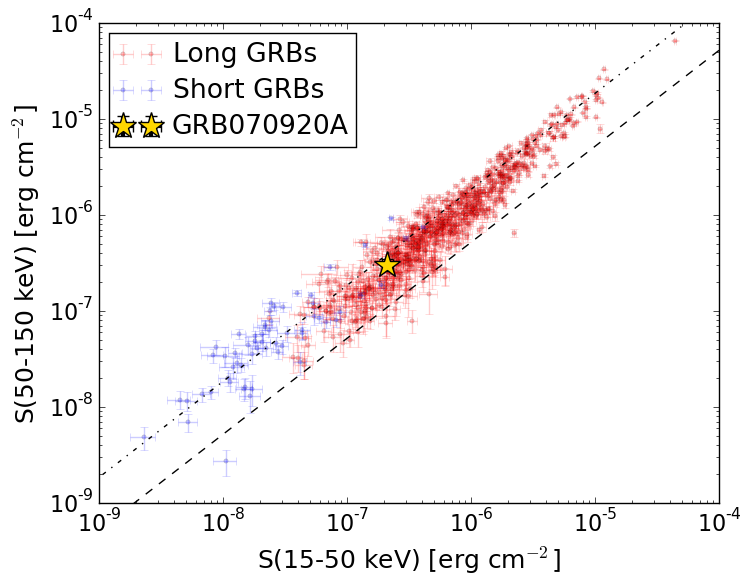
S(15-50 keV)  = 2.1118145e-07
S(50-150 keV) = 3.036395e-07
The dash-dotted line and the dashed line traces the fluences calculated from the Band function with Epeak = 15 and 150 keV, respectively. Both lines assume a canonical values of alpha = -1 and beta = -2.5.
Mask shadow pattern
IMX = -2.297229043253134E-01, IMY = 1.145821390813567E-01
Spacecraft aspect plot

Bright source in the pre-burst/pre-slew/post-slew images
Pre-burst image of 15-350 keV band
Time interval of the image:
-239.000000 15.180000

# RAcent  DECcent POSerr Theta    Phi  PeakCts   SNR AngSep     Name
#  [deg]    [deg]    ['] [deg]  [deg]                   [']
 83.6293  22.0143    0.3  37.1   12.1  10.7189  43.3    0.2	Crab
Pre-slew background subtracted image of 15-350 keV band
Time interval of the image:
15.180000 74.816000

# RAcent  DECcent POSerr Theta    Phi  PeakCts   SNR AngSep     Name
#  [deg]    [deg]    ['] [deg]  [deg]                   [']
 83.5906  21.8758    4.5  37.3   12.2  -0.3021  -2.6    8.7	Crab
 42.8649  32.4538    1.8  39.1   74.7   1.8702   6.4 ------	UNKNOWN
345.6086  73.4808    2.4  37.3  160.7   0.5617   4.9 ------	UNKNOWN
333.5373  79.1592    2.1  36.3  171.2   0.5315   5.5 ------	UNKNOWN
100.9719  72.2423    1.0  14.4 -153.5   0.8550  11.9 ------	UNKNOWN
129.9640  38.1034    2.2  34.8  -64.4   0.6259   5.1 ------	UNKNOWN
Post-slew image of 15-350 keV band
Time interval of the image:
384.400590 963.078800

# RAcent  DECcent POSerr Theta    Phi  PeakCts   SNR AngSep     Name
#  [deg]    [deg]    ['] [deg]  [deg]                   [']
 83.6304  22.0097    0.3  36.7   38.3  23.5197  36.2    0.3	Crab
107.8166  69.1893    2.4  19.1  161.6   1.5624   4.8 ------	UNKNOWN
123.8451  -7.8927    3.6  58.9  -24.2   7.7268   3.2 ------	UNKNOWN
137.9677   3.9832    3.0  50.7  -44.5   7.8491   3.8 ------	UNKNOWN
136.7151   2.2464    4.2  51.9  -42.3   5.4485   2.8 ------	UNKNOWN